Agriculture dominates Cumberland County in the supplied 2025 classification, covering 72.29% of the county. Forest accounts for 18.27%, but its dark green bands break up the farm blocks along drainages and across much of the southern half. Separate developed clusters mark the Neoga, Toledo, and Greenup areas. This Cumberland County Illinois Land Cover Map set lets those patterns be compared without treating farmland, forest, built land, wetlands, and hard surfaces as the same kind of information.
Four views are included: current land cover, forest and farmland, fractional impervious surface, and a 1985–2025 class-difference map. The original 2480 × 1754-pixel JPG versions are available together in one ZIP farther down the page. They work well as county reference graphics, environmental teaching material, agriculture-and-forest comparisons, and presentation images when the goal is to explain the countywide pattern rather than parcel-level detail.
Table of Contents
Farm blocks fill the county, while wooded drainages divide the open ground
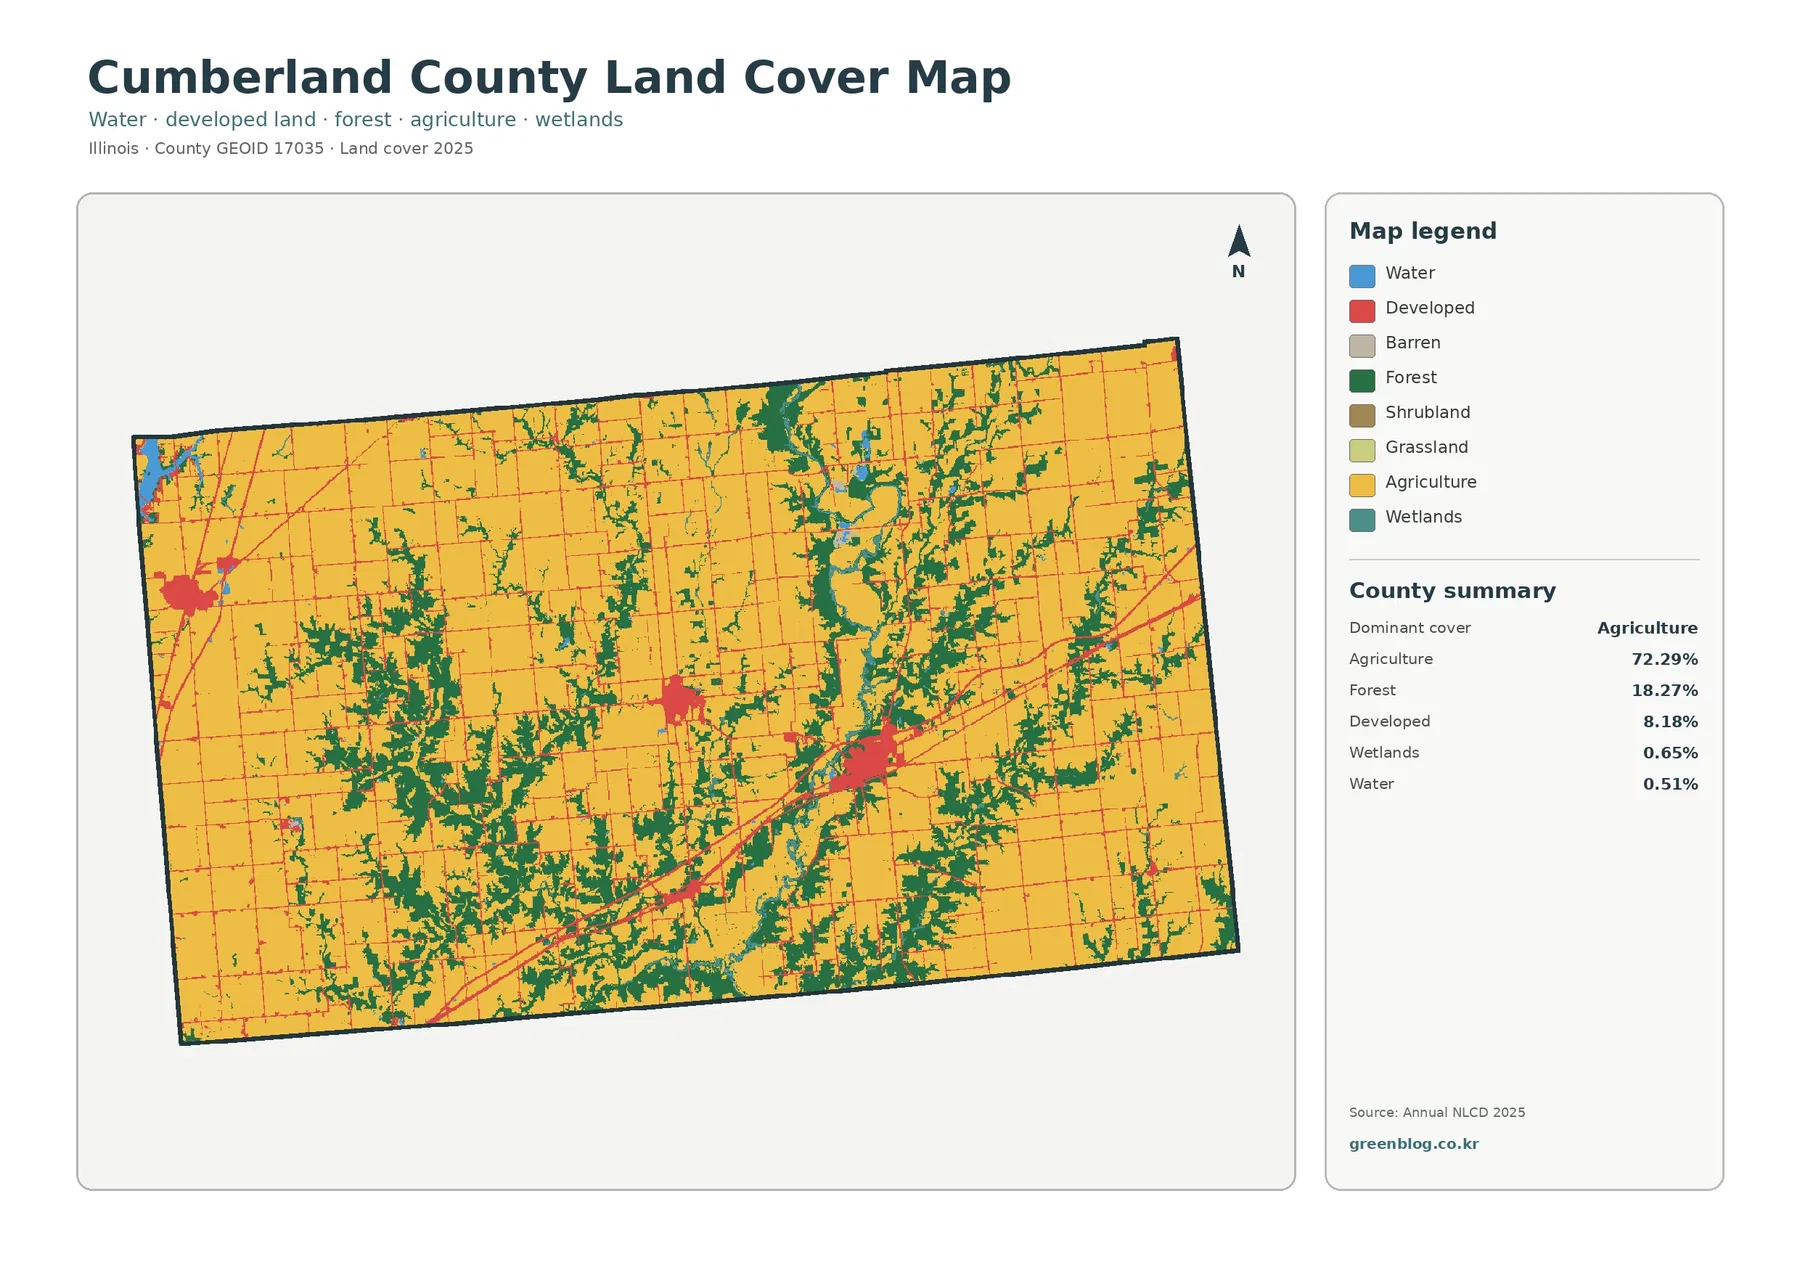
The county summary places agriculture at 72.29%, forest at 18.27%, and developed land at 8.18%. Wetlands account for 0.65% and open water for 0.51%. Grassland is only 0.04% and shrubland 0.01%, so they do not define the countywide appearance. The most useful first impression is therefore a farm-dominated landscape interrupted by wooded drainage networks and several compact centers of development rather than a county with one continuous urban core.
Large agricultural blocks cover much of the north, northeast, west, and interior. Forest becomes denser in the south and southwest and also forms narrow, branching strips through the middle and eastern portions of the county. Those shapes matter because 18.27% forest can look modest in a table while still having a strong visual presence on the map. The woods are not evenly scattered. Many patches follow irregular lowland or drainage-like shapes, which gives the agricultural landscape a much more divided appearance than the percentage alone suggests.
Developed land appears differently. It forms several compact clusters plus thin lines that cross the agricultural background. The western cluster aligns with Neoga, the central cluster with Toledo, and the larger eastern cluster with Greenup. Cumberland County’s comprehensive plan documents Interstate 57 near Neoga and Interstate 70 through the southern and central county with an interchange at Greenup. It also identifies U.S. 40 and state highways that connect local communities. That transportation geography helps explain the map’s linear pattern, although the land-cover image itself does not label roads and should not be used as a route map.
Removing most built surfaces makes the wooded south and central drainages easier to follow
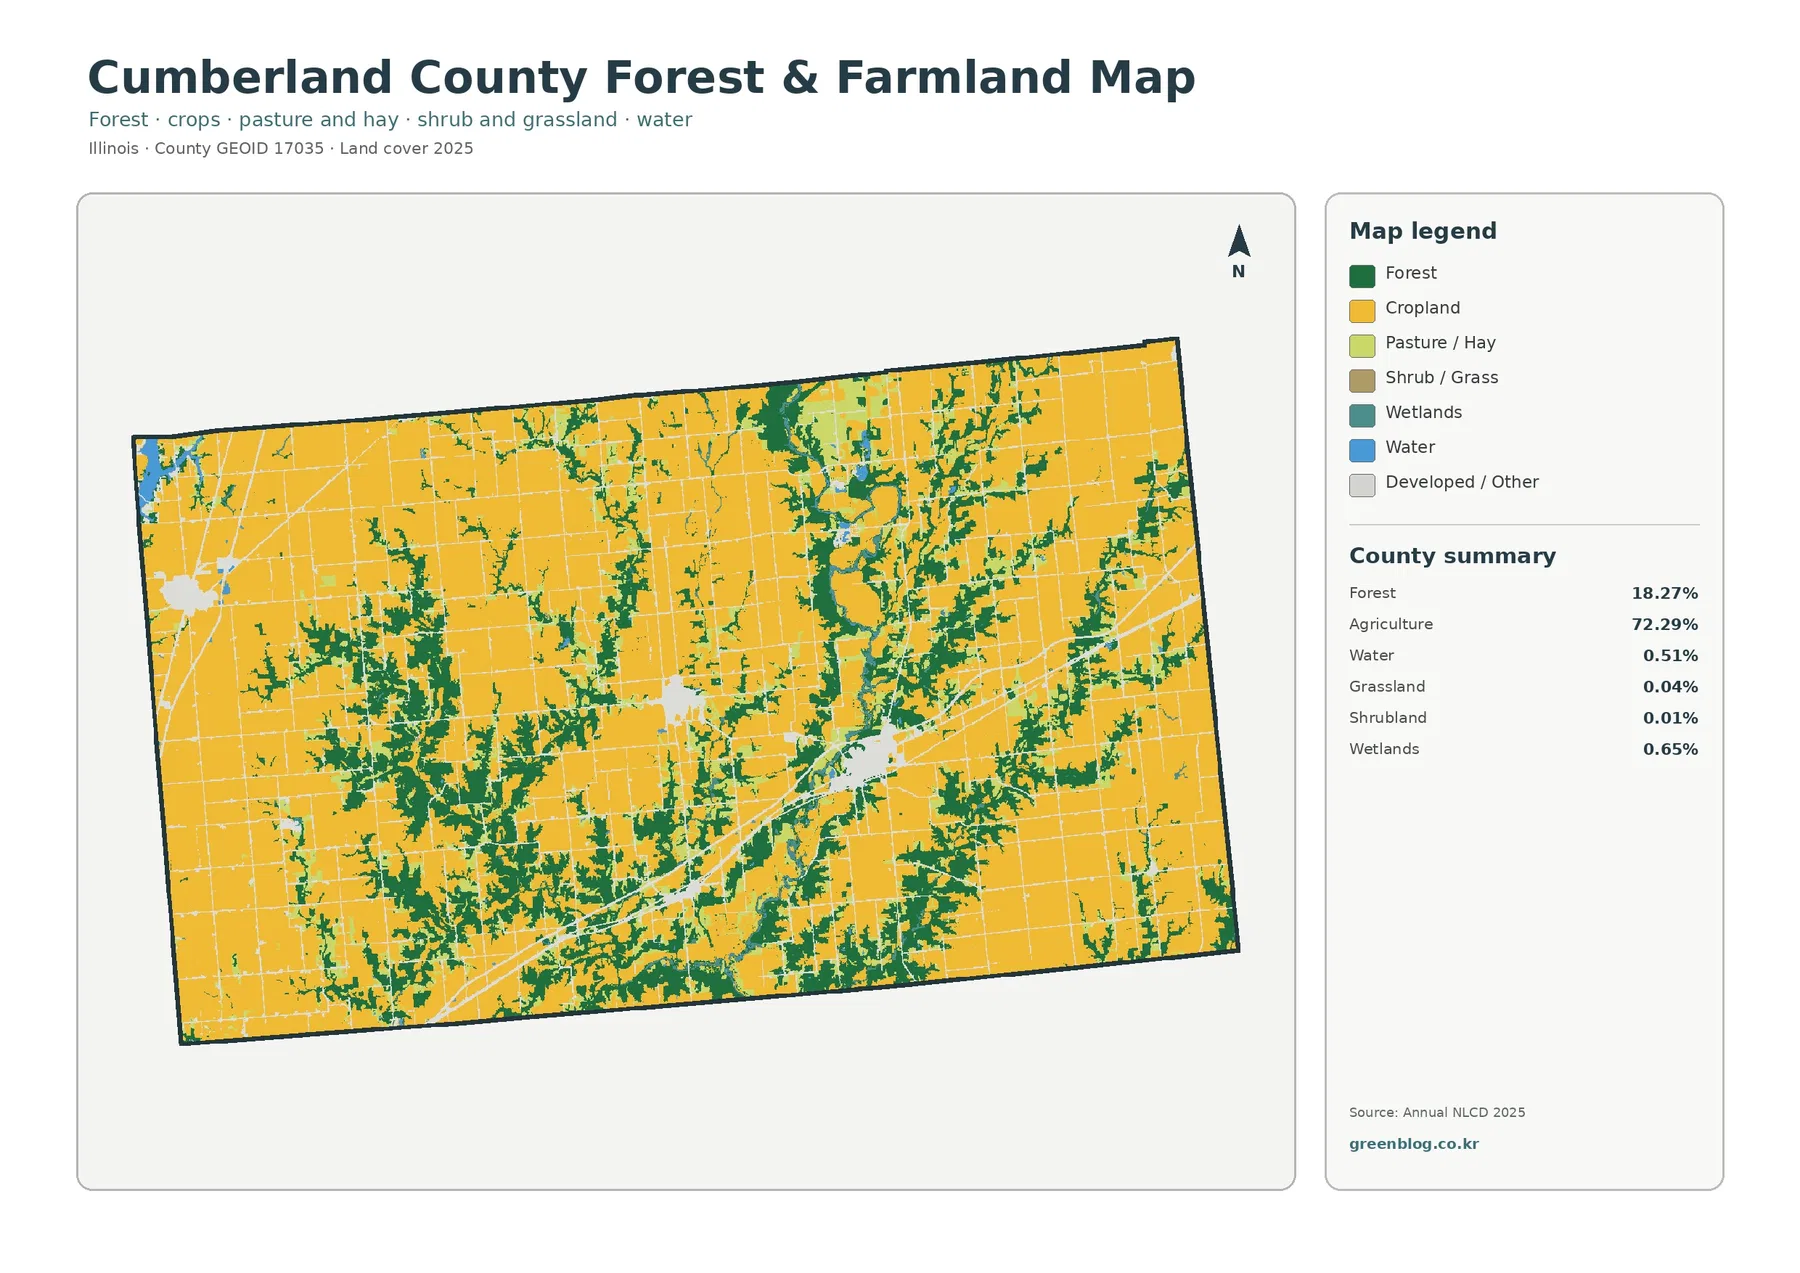
The forest-and-farmland view is useful when the developed colors in the general map distract from the rural pattern. Cropland forms broad yellow areas with long straight edges, especially across the north and east. Forest is more irregular. It widens in parts of the south and southwest, then narrows into finger-like bands that extend between fields. The map does not supply property lines, so a straight agricultural edge should not be treated as a surveyed field boundary. It is a classified 30-meter raster representation of surface cover.
Water and wetlands occupy small shares of the county, yet their locations provide useful context. Open water is 0.51% and wetlands are 0.65%. Blue and teal cells appear in small pockets and along selected drainage features rather than as large lakes. The USGS maintains an Embarras River monitoring location near Greenup in Cumberland County, and the Village of Greenup notes the Embarras River just east of town. That verified river context is helpful for interpreting the eastern side, but the map does not identify every blue or teal cell by stream name, nor does it define regulatory wetlands or floodplain limits.
A map like this is especially useful for showing why “mostly agricultural” does not mean “uniformly agricultural.” The wooded belts separate some field blocks, broaden near parts of the southern county, and create contact zones where farming and natural cover meet repeatedly. For an environmental lesson, those edges can be discussed as places where different surface types occur close together. For an agriculture presentation, the same image can show that a countywide farm statistic still exists within a landscape of woods, drainage features, roads, and towns.
Neoga, Toledo, and Greenup stand out most clearly in the impervious view
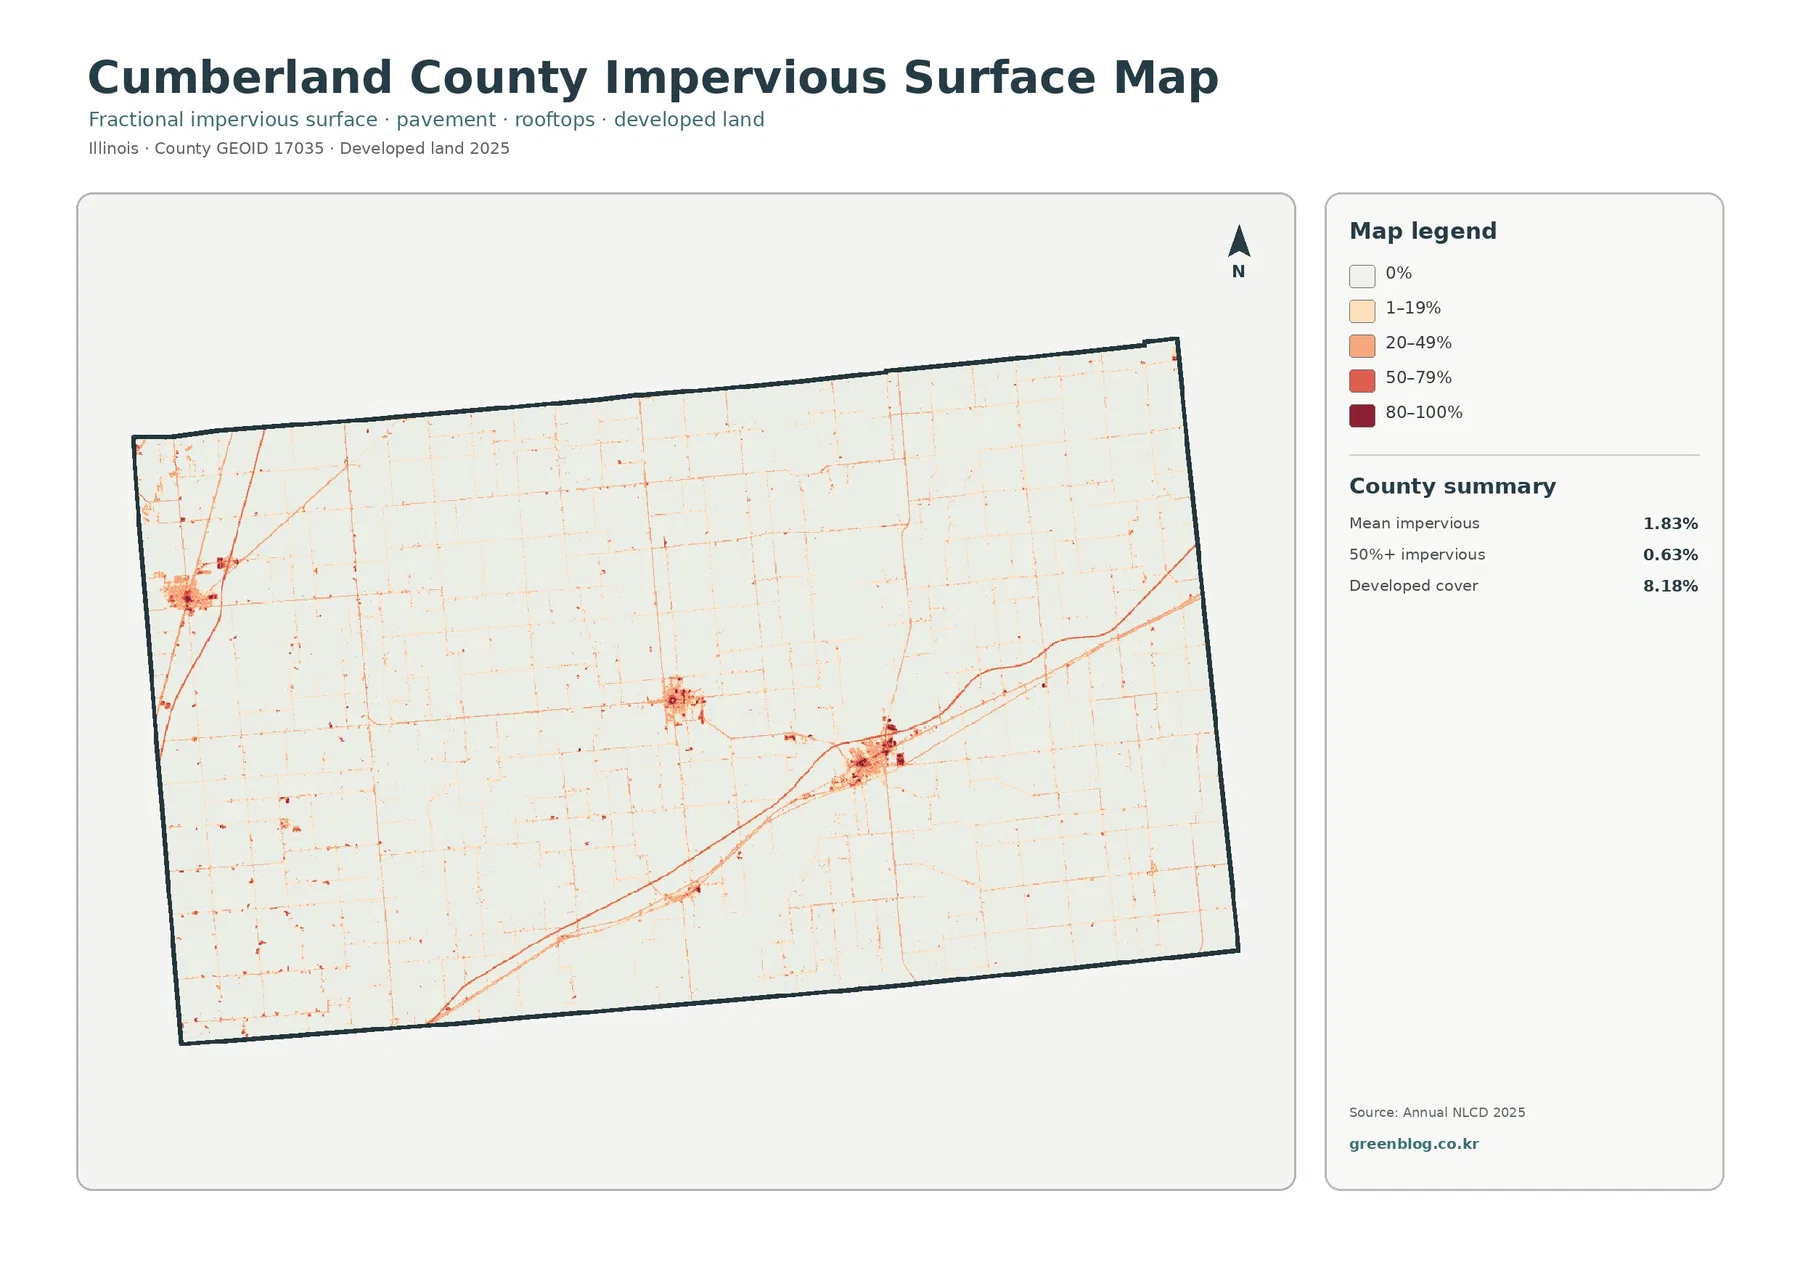
Impervious surface means roofs, pavement, parking areas, and similar hard materials that do not absorb rainfall readily. Cumberland County has a mean impervious value of 1.83%, while only 0.63% of the county is mapped at 50% impervious or higher. Those values are much lower than the 8.18% developed-land share because a developed class can contain lawns, trees, bare ground, and other permeable surfaces around buildings and roads. The two measurements should therefore be read separately rather than treated as competing estimates of the same thing.
Once the agricultural and forest colors are removed, the settlement pattern is unusually easy to see. Neoga forms a compact hard-surface cluster near the western edge. Toledo appears as a smaller central concentration. Greenup is larger and is tied into a prominent linear corridor on the eastern side. Thin lines connect and extend beyond these places across otherwise pale rural areas. The county comprehensive plan identifies I-57, I-70, U.S. 40, Illinois 121, and Illinois 130 as major parts of the transportation network, giving a verified geographic frame for those line-like developed patterns.
The impervious map is useful for discussions of development intensity because it separates rural settlement from large farm acreage. Most of the county remains very light, showing that the countywide average is pulled down by extensive areas with little hard surface. Darker values occur in small, concentrated places. This makes the map a better choice than the general land-cover image when the question is where pavement and buildings are concentrated. It can inform runoff discussions, but it is not a flood-risk map; rainfall, soil, slope, drainage infrastructure, and stream conditions are also needed.
The 8.47% endpoint difference is driven more by “other” changes than by development
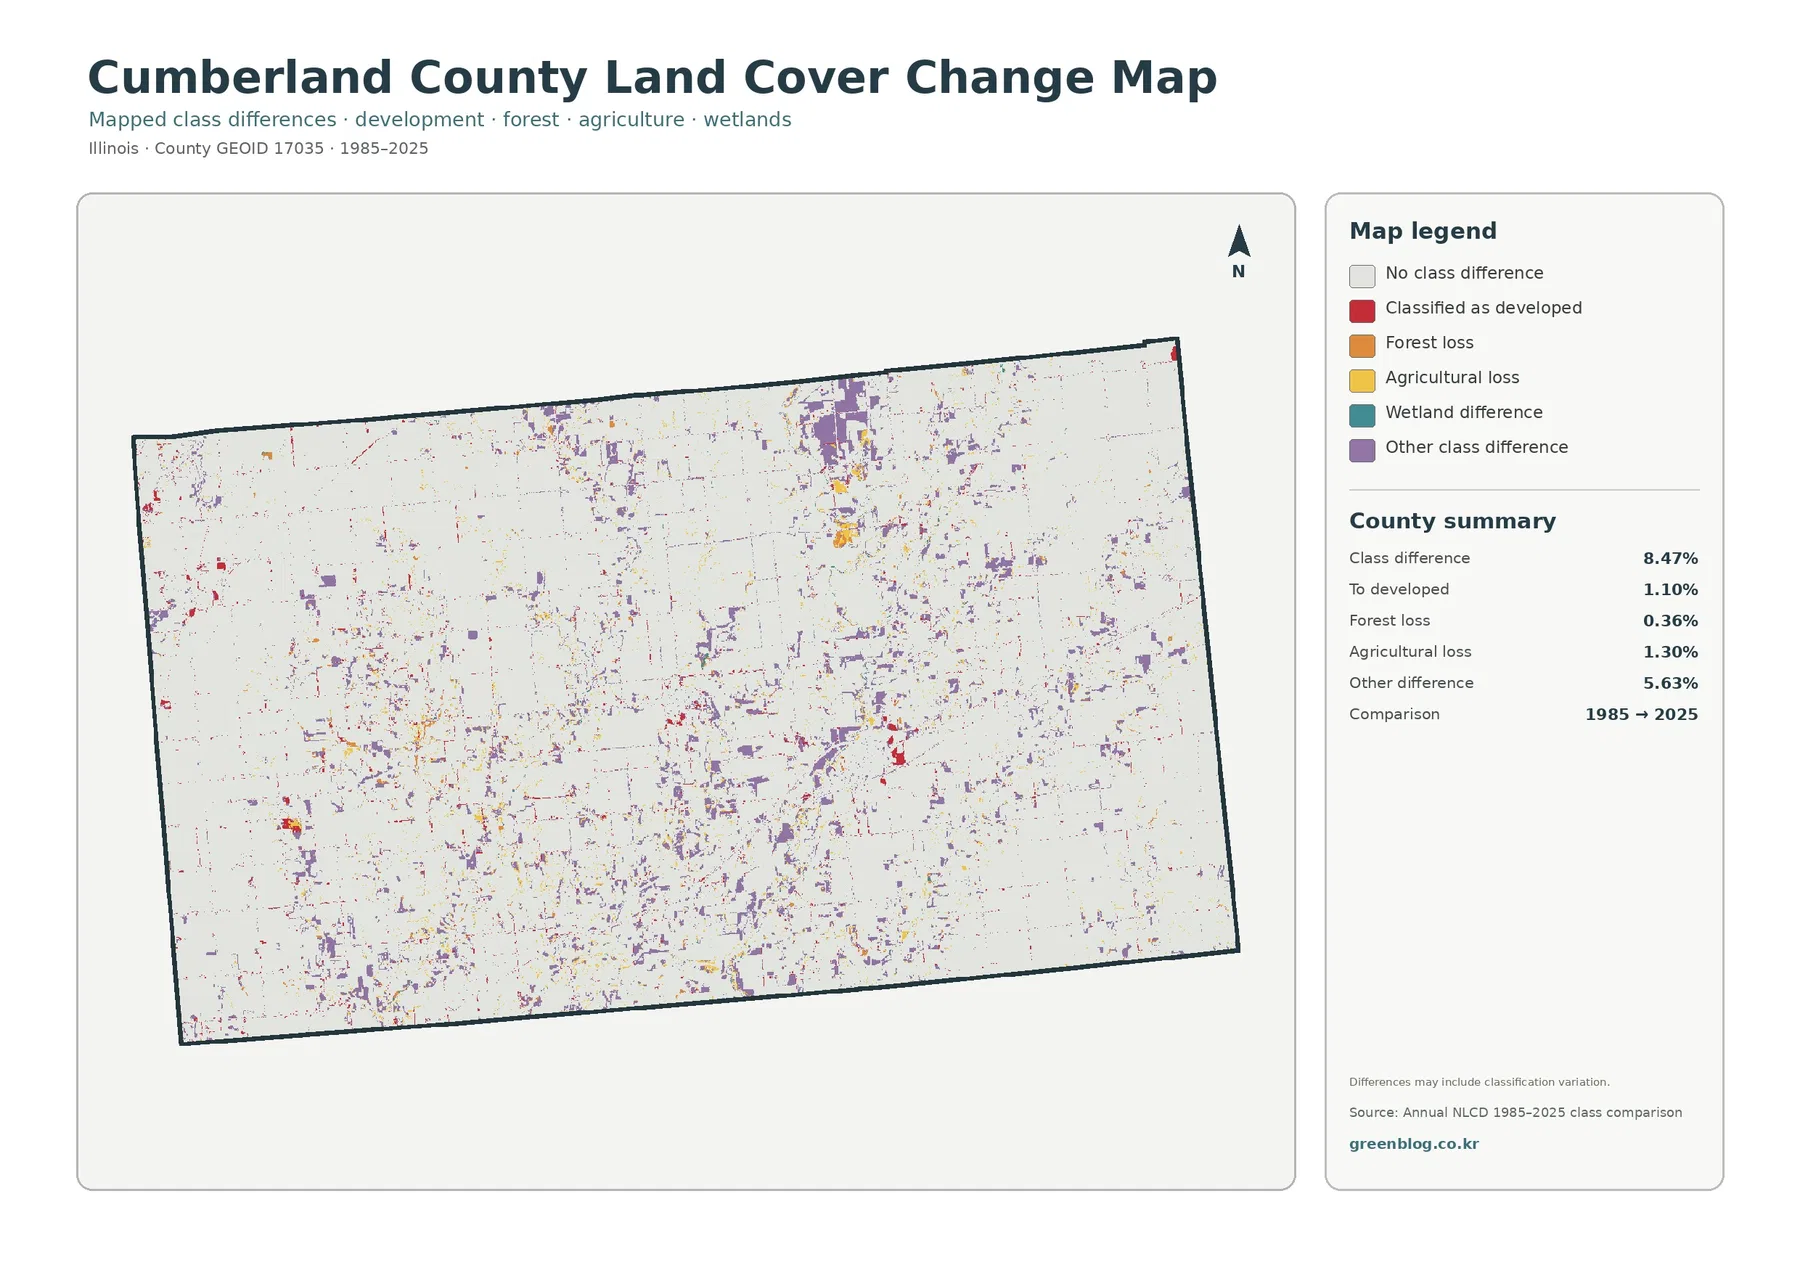
The change map compares the 1985 and 2025 endpoints rather than showing a continuous forty-year timeline. Overall class difference is 8.47%. Within that total, 1.10% is mapped as conversion to developed, 0.36% as forest loss, 1.30% as agricultural loss, and 5.63% as other class difference. Because the “other” category is by far the largest listed component, it would be misleading to describe the entire 8.47% as urban expansion, farm loss, or deforestation.
Purple other-difference cells are spread across many parts of the county and form some larger patches in the north and center. Agricultural-loss and forest-loss colors appear in smaller pieces, while red developed-conversion cells are more localized around settlement areas and selected linear features. The pattern is therefore dispersed rather than concentrated in one growth front. A reader interested in a specific site would need annual or intermediate-year imagery to learn when a class changed and whether the difference persisted.
“Loss” is a classification outcome, not a diagnosis of cause. A cell classified as forest in 1985 and something else in 2025 could reflect clearing, agricultural conversion, construction, vegetation change, disturbance, or classification variation. Annual NLCD is produced as a 30-meter raster, so mixed pixels and changes near class boundaries can matter. The comparison image itself warns that differences may include classification variation. That is why the change map works best as a screening graphic that identifies areas to investigate, not as proof of a specific land-use event.
The Embarras River and highway network help place the separate town clusters
Cumberland County’s official planning material gives useful names to the otherwise unlabeled clusters. Neoga lies in the northwest part of the county near I-57. Toledo is the county seat near the center. Greenup lies farther east along the I-70/U.S. 40 corridor and near Illinois 130 and 121. The same plan describes the county as strongly rural and notes the importance of these transportation links. Reading the land-cover map with that background makes the three developed concentrations easier to understand without pretending the colored cells are municipal boundaries.
The Embarras River adds another local reference point. USGS identifies the Embarras River near Greenup monitoring site as being in Cumberland County, and county planning history also discusses settlement along the river. On the maps, forest, wetland, and water cells form irregular patterns near drainage areas, especially in the eastern and central portions. Those surface classes can provide watershed context, but they do not replace official hydrography, floodplain maps, or wetland determinations. A dark green or teal raster cell is a land-cover classification, not a legal buffer or jurisdictional line.
Choose the map that matches the question instead of stacking all four at once
For a county profile, begin with the 2025 overview because it shows the dominant 72.29% agricultural cover, the 18.27% forest network, the 8.18% developed share, and the small water and wetland components together. Switch to the forest-and-farmland image when the subject is the edge between cultivated land and natural cover. Use the impervious layer for towns, roads, roofs, and pavement. Reserve the 1985–2025 comparison for a section that is explicitly about endpoint differences so its red, orange, yellow, teal, and purple categories are not mistaken for current land cover.
Pairs of maps can also answer clear teaching questions. The general land-cover view beside the impervious view demonstrates why “developed” and “impervious” are not interchangeable. The forest-and-farmland view beside the change map separates current vegetation from cells that changed classification between two dates. For local agriculture context, Illinois Extension serves Cumberland County from its Toledo office and can supply information beyond what a national land-cover product contains. Combining a countywide raster image with local subject-matter sources gives a more useful explanation than trying to make one map answer every question.
What a 30-meter land-cover cell can and cannot tell you
Annual NLCD is raster based and uses 30-meter spatial resolution. In practical terms, each square cell receives one predominant class even when a field edge, tree row, driveway, ditch, roof, and grass all occur within that area. Zooming the JPG does not create new parcel detail. Thin streams may be simplified, narrow woodland strips can be absorbed into neighboring classes, and developed edges can contain both hard and soft surfaces. The maps are therefore well suited to county patterns, but not to surveying a lot or measuring a field boundary.
The current views represent the supplied 2025 classification year. Construction, harvesting, vegetation growth, drainage changes, or other events after that observation period may not appear. The 1985–2025 comparison has an additional limitation: a different endpoint class does not identify the year of change or its cause. For property decisions, zoning, wetland regulation, engineering, or legal boundaries, use current county GIS, official parcel records, high-resolution imagery, and the appropriate regulatory source rather than relying on these reference graphics alone.
What is included in the four-JPG download
The download contains one original JPG for each view: 2025 land cover, forest and farmland, impervious surface and developed land, and 1985–2025 land-cover change. Every file measures 2480 × 1754 pixels. The asset manifest does not mark these files as meeting an A3 high-resolution reference, so anyone preparing a large-format print should test the intended size first and confirm that labels and legend text remain readable.
Frequently Asked Questions
Does 72.29% agriculture mean almost every parcel in Cumberland County is farmland?
No. The figure is the share of the 2025 Annual NLCD land-cover classification grouped as agriculture. It is not a parcel inventory, ownership record, or legal land-use total. Forest, developed land, water, wetlands, and other classes remain visible throughout the county, and the map generalizes the surface into 30-meter cells.
Can the three developed clusters be used as the exact boundaries of Neoga, Toledo, and Greenup?
No. Their locations correspond broadly with the three communities when checked against county planning information, but the land-cover maps do not draw municipal boundaries. Use Cumberland County GIS or Census boundary data for an official boundary question. The red and darker impervious cells show classified surface conditions, not jurisdiction lines.
Is the 8.47% class difference the amount of land developed between 1985 and 2025?
No. Only 1.10% is listed as classified to developed in the comparison. The total also includes 1.30% agricultural loss, 0.36% forest loss, and 5.63% other class difference. The map compares two endpoints and does not establish the exact year or cause of each change.
Sources and Reference Data
- MRLC Annual NLCD Data – official access to Annual NLCD land-cover and change products
- USGS Annual NLCD Collection 1.2 – official description of the 30-meter Annual NLCD product suite extended through 2025
- U.S. Census Bureau TIGER/Line Shapefiles – official county and municipal boundary reference data
- Cumberland County Comprehensive Plan – county-specific context for Neoga, Toledo, Greenup, I-57, I-70, U.S. 40, and local development geography
- Illinois Extension – Coles, Cumberland, Douglas, Moultrie and Shelby Counties – local agriculture and natural-resource education, including the Cumberland County office in Toledo
- USGS Water Data – Embarras River near Greenup – official monitoring-location reference for the Embarras River in Cumberland County
Map File Information
The ZIP contains four original JPG maps for comparing Cumberland County agriculture, forest and drainage patterns, town-centered hard surfaces, and 1985–2025 class differences.
- Included Files: Use only the versions confirmed in the article and supplied images
- File Type: Use the confirmed download contents
- Intended Use: Printing, education, presentations, and map-based projects
Related Maps
- Adams County Illinois Land Cover Map
- Alexander County Illinois Land Cover Map
- Bond County Illinois Land Cover Map
Green Map creates custom-edited map images using open geographic data sources such as geoBoundaries, Natural Earth, OpenStreetMap, and government open data.
These maps are edited visual materials, not raw data files, and are provided for education, documents, presentations, and graphic reference.