Wetlands are the largest mapped surface in Wayne County in the supplied 2025 summary, covering 38.95% of the county. Forest follows at 26.85%, while agriculture accounts for 10.53%, developed land 8.50%, grassland 7.62%, shrubland 6.22%, and open water 0.81%. The Wayne County Georgia Land Cover Map is especially useful because those categories do not form an even patchwork: wet ground dominates much of the east and south, agricultural openings are more common in the west, and one strong developed center stands out in the north-central part of the county.
This page pairs four views of the same county: 2025 land cover, forest and farmland, fractional impervious surface, and a 1985–2025 class-difference map. The WebP versions can be compared in the article, and the four original 2480 × 1754-pixel JPG maps are bundled in one ZIP download below. Use the broad land-cover view for the countywide mix, the vegetation view for working land and natural cover, the impervious map for the built core, and the final map for two-date classification differences.
Table of Contents
Wetlands shape the eastern half while one built center breaks the countywide pattern
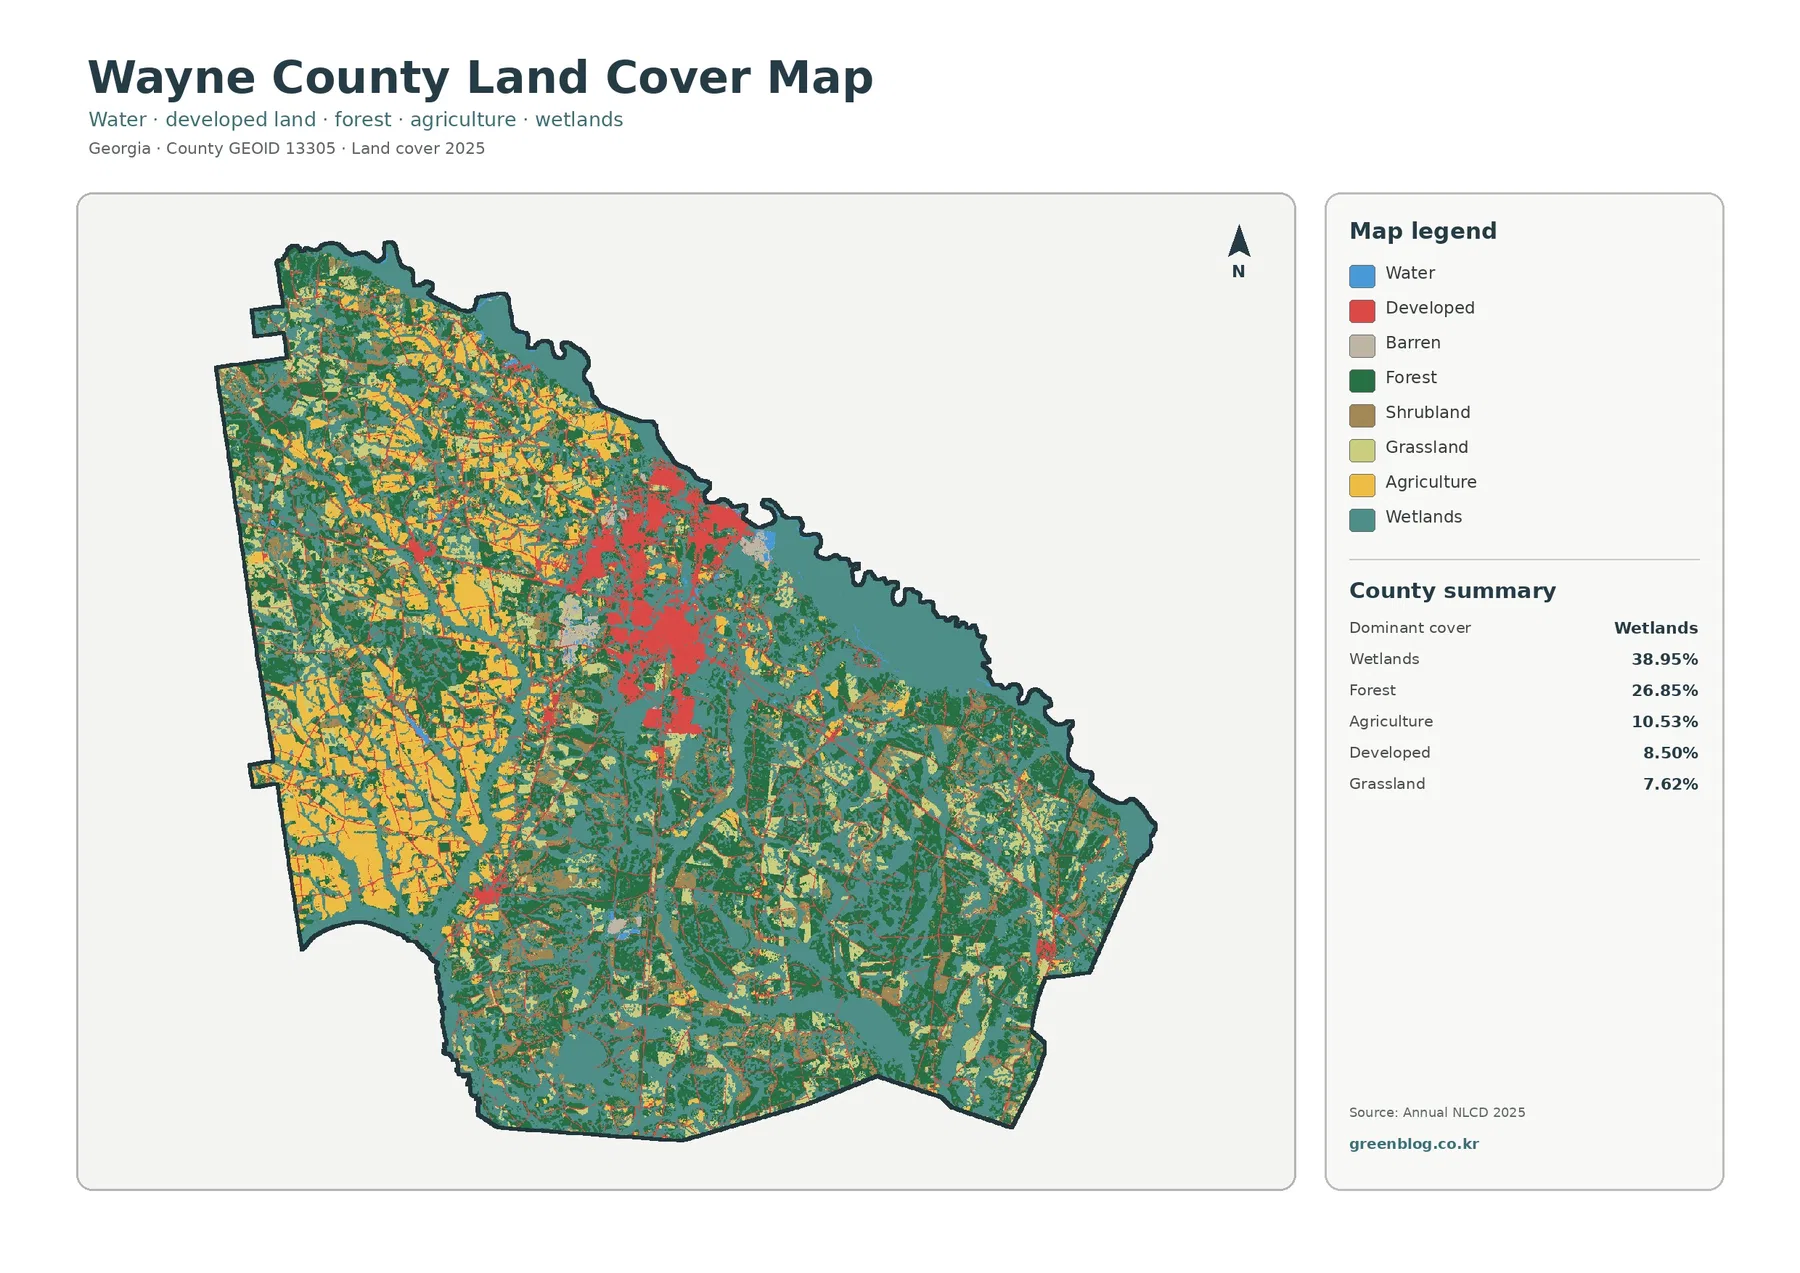
The first impression is the broad teal wetland cover. Large wet areas occupy much of the eastern and southeastern part of the county, continue along the irregular northeastern boundary, and branch into central sections. That 38.95% share should not be read as open water. Wetland classes can include vegetated and seasonally saturated ground, while the blue open-water class represents only 0.81%. The difference between those two numbers explains why the map can look strongly water-influenced without being dominated by lakes or wide open channels.
Forest is the second-largest class at 26.85%. Dark green blocks are more prominent in the western, northwestern, and southern parts of Wayne County, but they are repeatedly interrupted by agriculture, grassland, shrubland, and wet areas. The county therefore does not have one continuous forest belt. Western sections look more like a forest-and-farmland mosaic, while the southeast is much more heavily mixed with wetlands. This directional contrast is one of the clearest county-specific features in the four-map set.
A large red developed cluster appears north of the county’s midpoint. Wayne County’s official joint comprehensive plan identifies Jesup as the county seat and describes it as the governmental, commercial, service, industrial, and healthcare center of the county. The same document places Jesup near the east-west center of Wayne County at the intersection of U.S. 341, U.S. 84, and U.S. 301. The land-cover image itself does not label a city boundary, but the dominant north-central developed concentration broadly matches that Jesup-centered setting.
Thin red lines extend away from the main built concentration, and smaller developed patches appear elsewhere in the county. They are useful for seeing where built surfaces connect across a mostly rural landscape, but they should not be assigned to named highways from this image alone. The map has no road labels, and a land-cover raster does not trace engineering-grade road edges. Official transportation data can identify routes; the land-cover map is better used to show the contrast between a concentrated urban surface and the surrounding wetland, forest, and agricultural cover.
The irregular northern and northeastern edge adds another important piece of local context. Wayne County planning material notes the nearby Altamaha River and treats it as a major natural feature of the area. The supplied map shows extensive wetland cover and some open water along that side of the county, which fits the broader river-influenced landscape. It would still be a mistake to treat every teal cell as the river itself or as a legally delineated wetland boundary. The image classifies surface cover; it does not provide a surveyed hydrographic or regulatory line.
The forest-and-farmland view separates a western working-land mosaic from wetter eastern ground
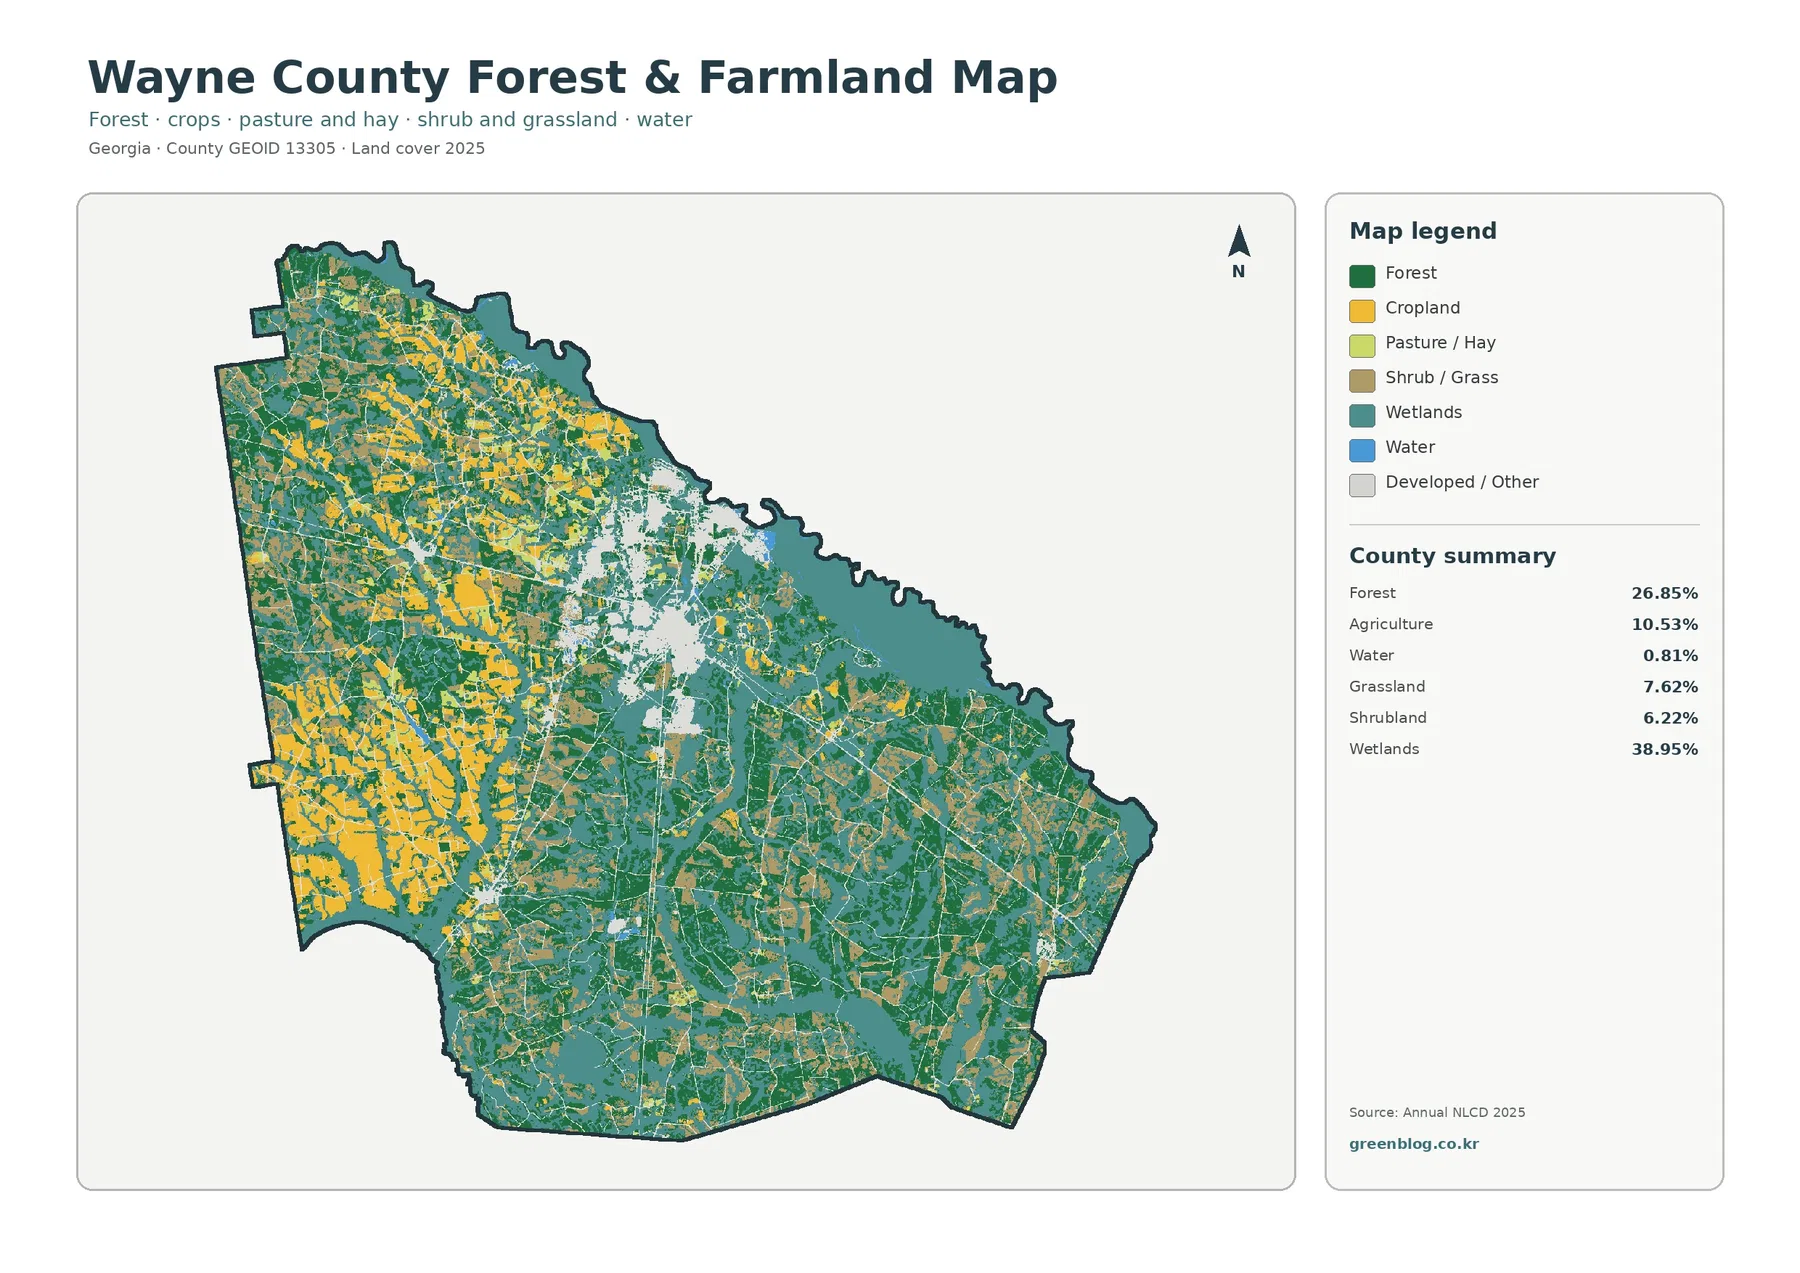
Removing most of the developed-class detail makes the west-east contrast easier to see. Cropland appears in many yellow blocks through the western half, especially toward the southwest and northwest, while forest remains between those openings. The east and southeast contain far more wetland color and fewer large agricultural patches. A reader trying to explain Wayne County’s rural land should therefore avoid describing agriculture as one continuous belt; it is a repeated set of openings embedded in a larger mixture of forest, wet ground, and other vegetation.
Agriculture accounts for 10.53% in the county summary, but that number does not include every open-looking surface. Grassland is 7.62% and shrubland is 6.22%, and the forest-and-farmland image separates cropland from pasture or hay and from shrub or grass cover. A yellow field, a pale-green pasture, and a brownish shrub or grass patch are not interchangeable categories. Keeping them separate is useful when the map is used in a classroom, county profile, or environmental presentation because the visible landscape is more varied than a simple forest-versus-farm split.
The north-central developed area becomes light gray on this view, creating a useful reference point between the western agricultural mosaic and the wetter eastern side. That gray area includes developed and other classes, not just rooftops and pavement. Trees, lawns, bare ground, drainage areas, and small patches of vegetation can still occur inside a developed landscape. This is why the next impervious-surface map adds information that the land-cover classification cannot provide by itself.
Wetlands remain the dominant single category even after the map is simplified. Their 38.95% share is more than three times the agriculture share and well above the forest share. Yet the map also makes clear that the county’s wet areas are interwoven with forest and other vegetation rather than forming a single unbroken block. Broad county patterns can be described confidently from this scale; exact wetland limits, ownership, drainage easements, or agricultural parcels require separate local and regulatory records.
A 1.85% mean impervious value hides a sharply concentrated Jesup-area hard-surface core
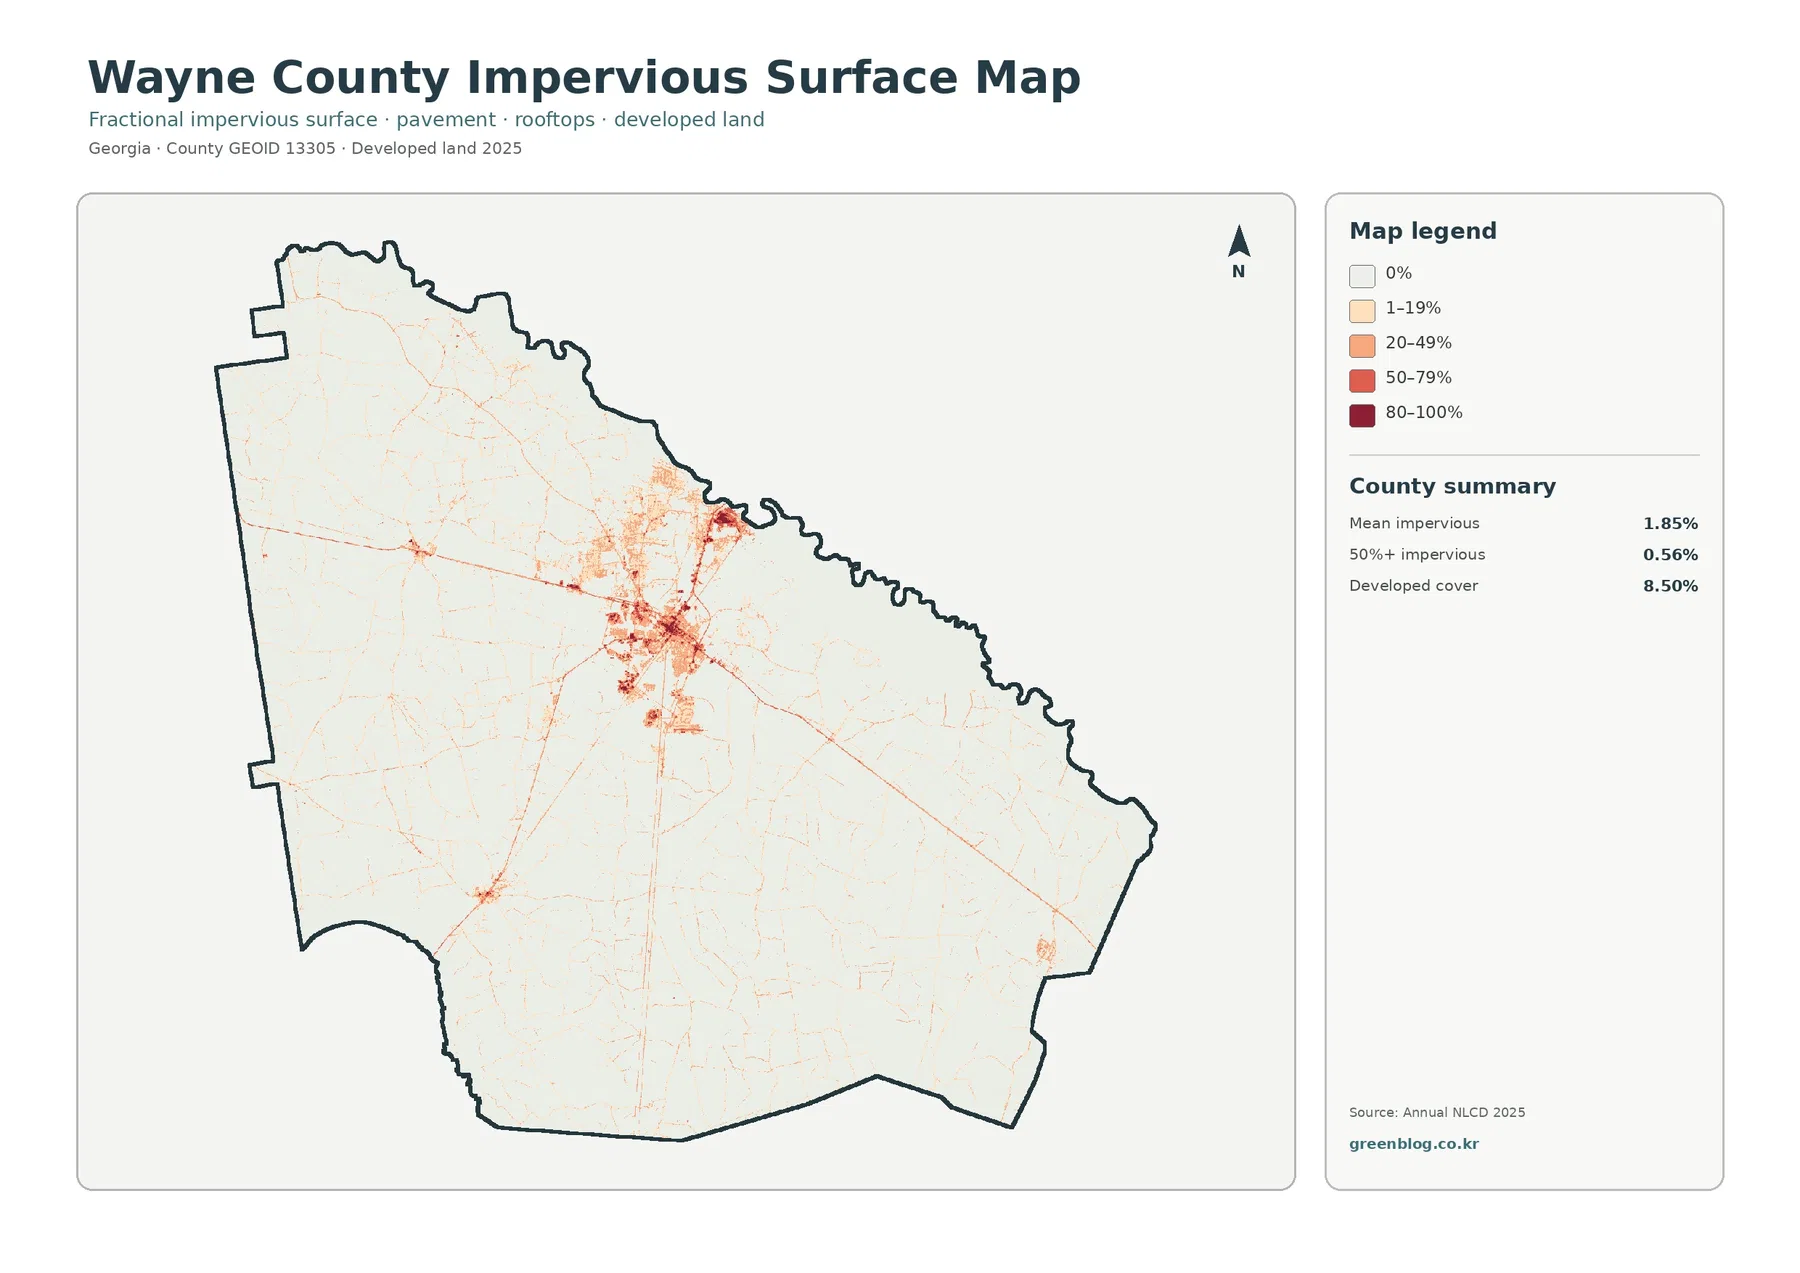
Impervious surface means hard ground where water does not readily soak in, such as roofs, paved roads, and parking areas. Wayne County’s mean impervious value is 1.85%, and only 0.56% of the county is in cells with more than 50% impervious cover. Those values are much lower than the 8.50% developed-land share because a developed land-cover class can also contain lawns, trees, open soil, and other permeable surfaces around buildings and streets.
The map is visually sparse across most of the county, but the north-central core is an exception. High and moderate impervious values form a dense cluster there, surrounded by lower-intensity developed cells. This is the clearest way to see how a countywide average can conceal a strong local concentration. Most rural and wetland areas contribute very little hard surface, while the principal built center contributes much more within a relatively small footprint.
Several thin corridors extend outward from the main cluster. They are consistent with the kind of pattern created by roads and roadside development, and Wayne County’s official plan confirms that major U.S. routes intersect in Jesup. The raster itself does not name those lines, however, so it should not be used to identify a specific highway segment or measure road width. A 30-meter cell can contain pavement, shoulder, vegetation, and nearby structures at the same time.
Small hard-surface concentrations also appear in the southwest and southeast, but they remain minor compared with the north-central cluster. The contrast is useful for a county profile: developed land is not spread evenly across Wayne County. Built and paved surfaces are strongly concentrated around the main population and service center, while the broad wetland and forest areas stay mostly in the 0% or 1–19% impervious classes.
The 1985–2025 comparison is driven more by forest loss than by new developed classification
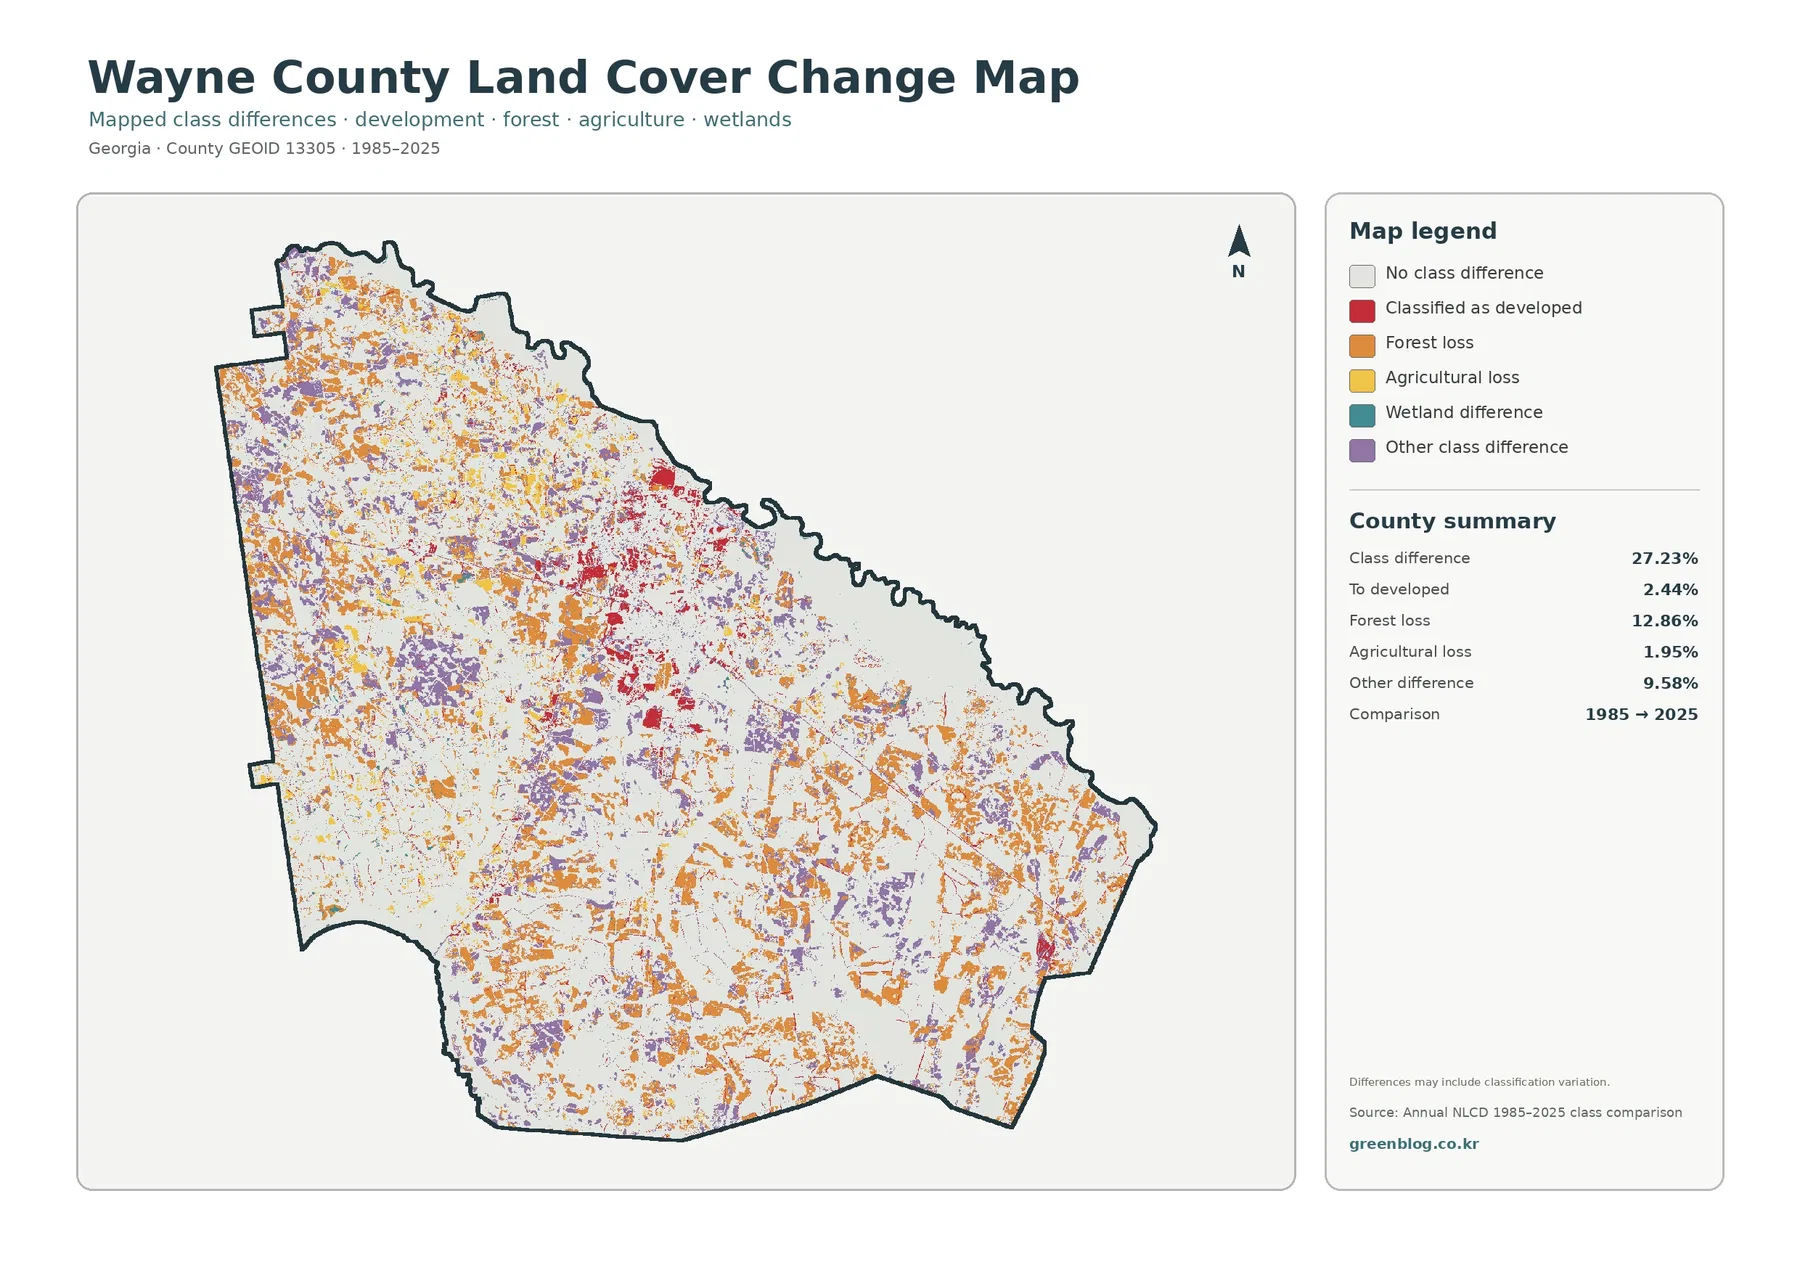
The endpoint comparison reports class differences across 27.23% of Wayne County. Forest loss is the largest named category at 12.86%, followed by other class differences at 9.58%, cells classified as developed at the 2025 endpoint at 2.44%, and agricultural loss at 1.95%. These categories show that the total difference cannot be treated as a development statistic. Most of the changed-class share falls outside the red developed category.
Orange forest-loss patches are scattered through the western, southern, and southeastern portions of the county and also appear in the northwest. Their wide distribution matters because current forest still covers 26.85%. A place can remain broadly forested at the county scale while many individual cells have a different endpoint classification than they did in 1985. Timber harvest, regrowth, conversion to another vegetation class, agriculture, disturbance, or classification variation could all contribute; this two-date map does not establish a single cause.
Red cells associated with the developed endpoint are most visible around the same north-central area that dominates the 2025 developed and impervious maps. That geographic agreement makes the map useful for locating areas worth a closer look. It does not provide the year when a building, road, or subdivision appeared. Establishing timing would require intermediate annual land-cover data, historical aerial images, permits, or other local records.
Purple other-difference cells form another substantial part of the comparison. The map itself warns that class differences may include classification variation. This is particularly relevant where forest, wetlands, shrubland, and grassland meet in small patches. Seasonal conditions, vegetation stage, and the dominant class assigned to a mixed 30-meter cell can affect the endpoint label. Use the change view to identify broad areas of difference, then bring in additional evidence before making a claim about what physically happened at one site.
Land cover describes the surface, not zoning, ownership, or wetland jurisdiction
Land cover is a classification of what is physically visible at the surface: forest, crops, wetland vegetation, open water, developed ground, grass, shrubland, and similar classes. It is not a map of legal land use. A red developed cell does not tell the reader whether the parcel is zoned residential or commercial, and a teal wetland cell does not by itself establish a regulatory wetland boundary. Property ownership, building rights, flood designations, and environmental permitting all require separate authoritative sources.
Annual NLCD is commonly produced on 30-meter raster cells. Each cell receives a dominant classification even if trees, grass, pavement, a ditch, and part of a building occur within the same square. Enlarging the JPG can make the legend and broad pattern easier to read, but it cannot create parcel detail that was never present in the source grid. These maps are strongest for countywide comparison, environmental education, regional profiles, and selecting locations for deeper investigation.
The 2025 maps represent the supplied observation year. Construction, timber harvest, vegetation recovery, agricultural changes, storms, flooding, or water-level changes after that observation may not appear. The 1985–2025 layer is also a two-date comparison rather than a year-by-year history. A cell could change several times in four decades and still end in a class similar to its starting class, so an endpoint map can never tell the complete sequence by itself.
This caution is especially useful near the Altamaha-influenced side of Wayne County, where water and vegetation can create complicated boundaries. The land-cover maps are appropriate for explaining that wetland classes are extensive and that open water is comparatively limited. They are not substitutes for current flood maps, surveyed streams, delineated jurisdictional wetlands, or site inspection. Keeping those purposes separate makes the maps more useful rather than less useful.
Choose one of the four JPGs as the main graphic, then add a second view for comparison
The download contains the four original JPG maps used in this article: 2025 land cover, forest and farmland, impervious surface and developed land, and 1985–2025 land-cover change. Each image measures 2480 × 1754 pixels. The supplied asset manifest does not mark these files as meeting an A3 high-resolution reference, so large-format printing should be tested before committing to a poster or display where small legend text and narrow lines must remain sharp.
For a general Wayne County profile, start with the 2025 map because it immediately shows the wetland-dominant east, the forest-and-farm mixture in the west, and the strong north-central developed cluster. Use the forest-and-farmland view when the discussion centers on agriculture, open vegetation, and natural cover. The impervious map is the best companion for explaining how concentrated the Jesup-area built surface is compared with the rest of the county.
The change image works best after the current-condition maps. Its orange and red colors represent endpoint differences, not today’s forest and developed classes. Showing it first can cause viewers to mistake a change category for current land cover. In a lesson or presentation, one large base map plus one targeted comparison map usually communicates more than shrinking all four into a single crowded panel. The ZIP keeps every original JPG together so the sequence can be adapted to the question being asked.
Frequently Asked Questions
What is the largest land-cover class in Wayne County?
Wetlands are the largest class in the supplied 2025 summary at 38.95%, followed by forest at 26.85%. Agriculture accounts for 10.53%, developed land 8.50%, grassland 7.62%, shrubland 6.22%, and water 0.81%. The map places many of the broadest wetland areas in the eastern and southern parts of the county.
Why is developed land 8.50% when mean impervious cover is only 1.85%?
Developed land and impervious surface measure different things. A developed class can include lawns, trees, soil, and other permeable ground around homes, businesses, and roads. Impervious cover isolates hard surfaces such as roofs, pavement, and parking areas, so the countywide average can be much lower than the developed-land share.
Does the 27.23% class difference mean that 27.23% of Wayne County was developed?
No. The 27.23% value combines all cells with different endpoint classifications in 1985 and 2025. Only 2.44% is listed as classified to developed at the 2025 endpoint. Forest loss accounts for 12.86%, agricultural loss 1.95%, and other class differences 9.58%. Timing and cause require intermediate imagery or local records.
Sources and Reference Data
- MRLC Annual NLCD Data – official access point for the 2025 land-cover and 1985–2025 comparison products used for this map set.
- USGS Annual NLCD Land Cover Classification – definitions for forest, developed land, agriculture, wetlands, and other Annual NLCD classes.
- Wayne County Joint Comprehensive Plan – official local context for Jesup, major transportation routes, and the nearby Altamaha River.
- U.S. Census Bureau TIGER/Line Shapefiles – official county-boundary and administrative geography source.
Map File Information
The ZIP contains four original JPG maps for comparing Wayne County's wetlands, forest and farmland, Jesup-area hard surfaces, and 1985–2025 class differences.
- Included Files: Use only the versions confirmed in the article and supplied images
- File Type: Use the confirmed download contents
- Intended Use: Printing, education, presentations, and map-based projects
Related Maps
- Appling County Georgia Land Cover Map
- Atkinson County Georgia Land Cover Map
- Bacon County Georgia Land Cover Map
Green Map creates custom-edited map images using open geographic data sources such as geoBoundaries, Natural Earth, OpenStreetMap, and government open data.
These maps are edited visual materials, not raw data files, and are provided for education, documents, presentations, and graphic reference.