Washington County in east-central Georgia has a mixed 2025 surface rather than one land-cover type overwhelming nearly everything else. The supplied Washington County Georgia Land Cover Map summary places forest first at 40.44%, followed by wetlands at 16.62%, agriculture at 15.21%, grassland at 10.75%, shrubland at 7.55%, developed land at 6.33%, and water at 1.03%. A strong developed concentration sits near the center of the county, while forest, farm fields, open vegetation, and wet areas alternate across the surrounding rural landscape.
This page pairs four views of the same county: 2025 land cover, forest and farmland, impervious surface and developed land, and a 1985–2025 class-difference map. The WebP images can be compared in the article, and the four original 2480 × 1754-pixel JPG maps are available together in one ZIP below. Use the general image for overall composition, the vegetation view for forest and working-land patterns, the impervious map for the Sandersville-area hard-surface concentration, and the change image for endpoint differences.
Table of Contents
The county center stands out inside a landscape divided among forest, wetlands, farms, and open vegetation
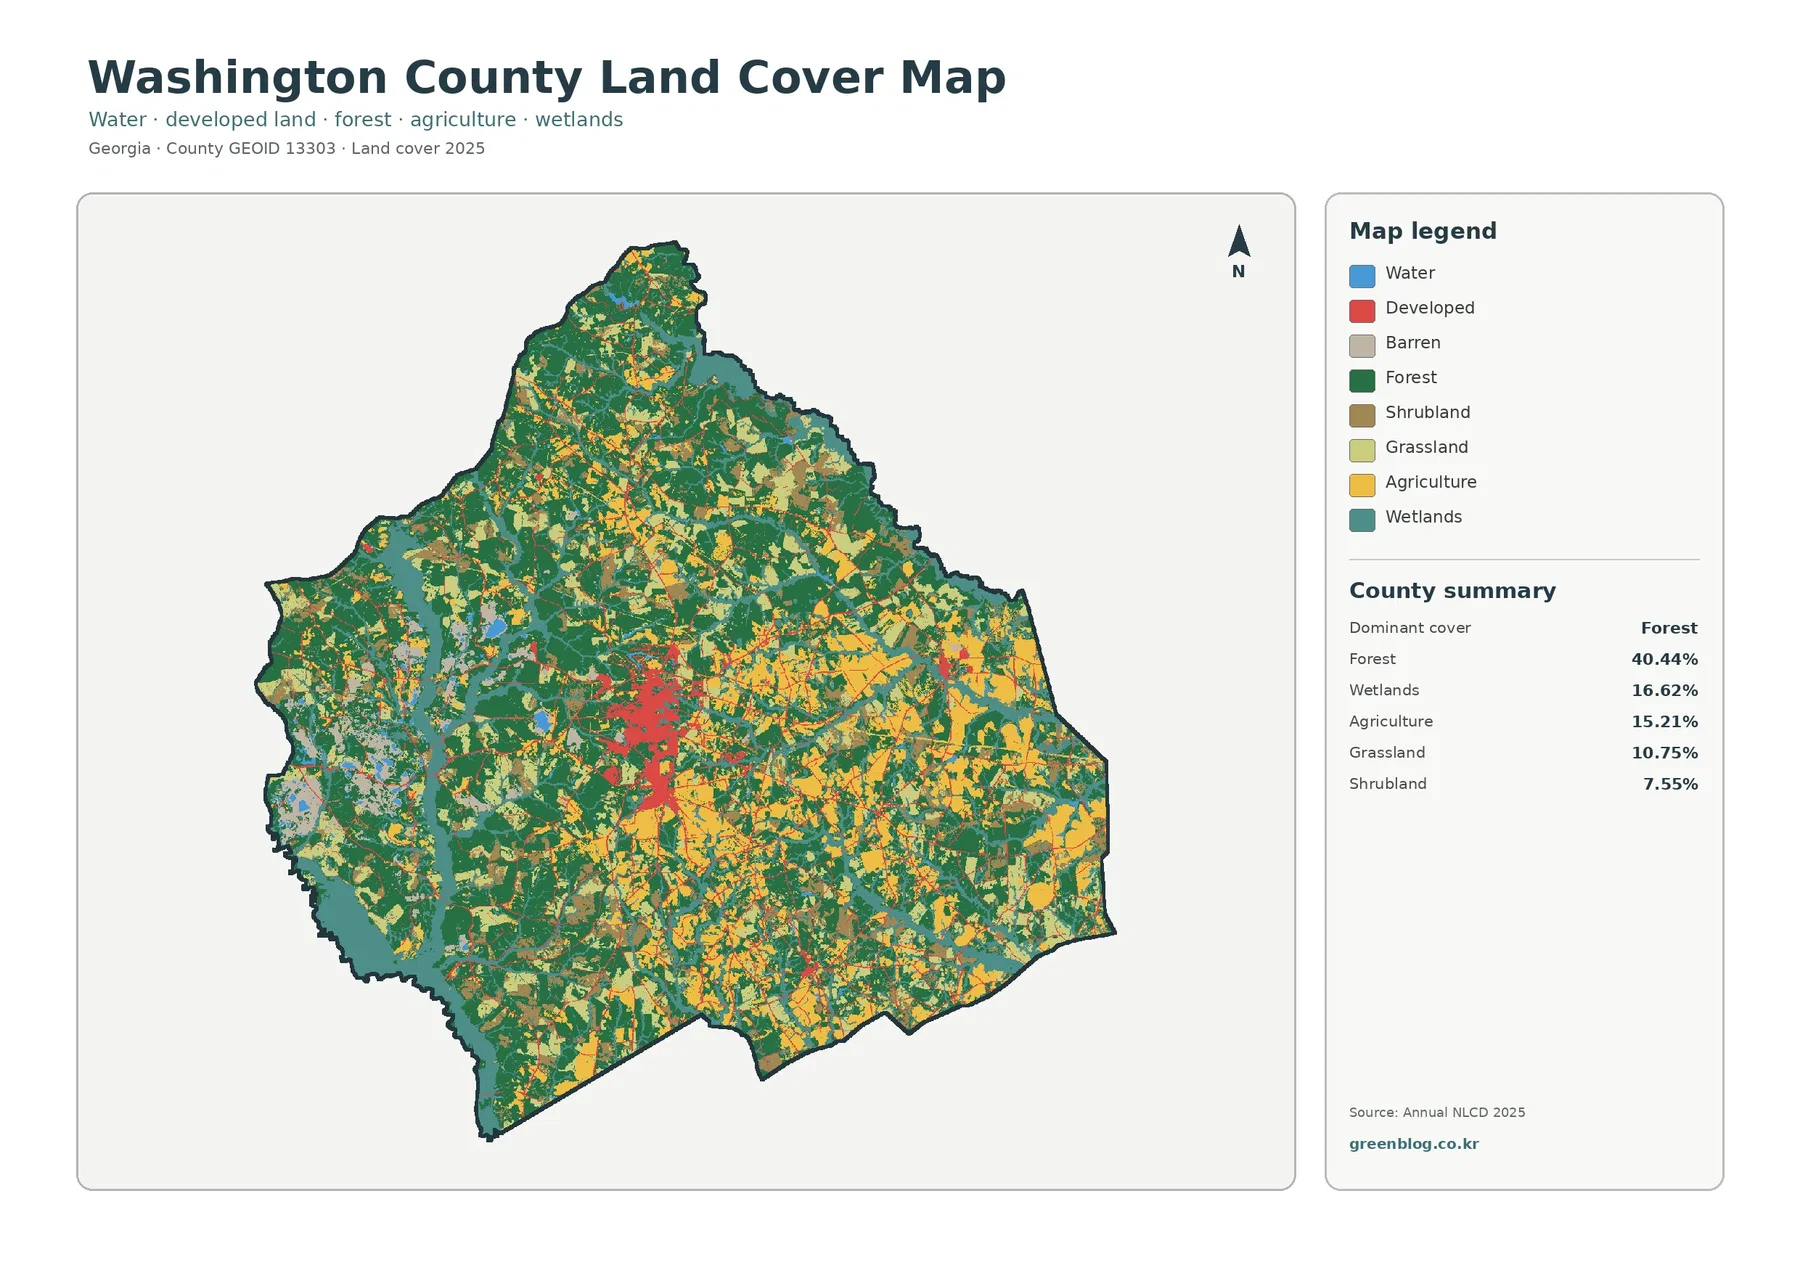
Forest is the largest class, but the map does not look like one uninterrupted green block. Larger wooded tracts appear in the north, west, and southwest, while the center, east, and southeast contain more frequent breaks of agriculture, grassland, shrubland, wetlands, and developed cover. That arrangement matters when reading the 40.44% forest figure. The percentage describes the county total, whereas the image shows that forest continuity changes markedly from one part of Washington County to another.
The strongest red cluster occupies the central part of the county. Washington County’s official history identifies Sandersville as the county seat, and the same local history describes it as the county’s largest town. The map itself does not label municipal limits, so the entire red area should not be treated as the legal Sandersville boundary. It is still useful at county scale because it shows where developed cover is most concentrated compared with the much more dispersed rural development outside the center.
Smaller developed patches continue south of the central cluster and appear at scattered points elsewhere. Washington County also includes Tennille and several other communities, but the image does not provide town labels or a place layer. A viewer can therefore discuss a central Sandersville-area concentration and smaller outlying clusters without assigning every red patch to a named municipality. Exact city limits and road identities require separate boundary and transportation data.
Wetlands account for 16.62%, slightly more than agriculture at 15.21%. Teal areas form irregular bands and patches along several county edges and through interior low-lying corridors. Open water is only 1.03%, shown in blue, which is a useful reminder that wetlands and visible water are not the same class. Wetland cover can include vegetated or seasonally saturated ground, so a county may have extensive wet environments without a similarly large share of open water.
The western side includes several pale or highly mixed surfaces that contrast with nearby forest and wetlands. Regional references describe Washington County as an important center of Georgia’s kaolin industry, with mining and processing associated with the Sandersville area. The land-cover image does not draw mine permits, company property, or extraction boundaries, however. Pale patches should therefore be described as mapped surface differences rather than automatically labeled as individual kaolin mines.
Farm blocks become more obvious toward the east and south when developed colors are simplified
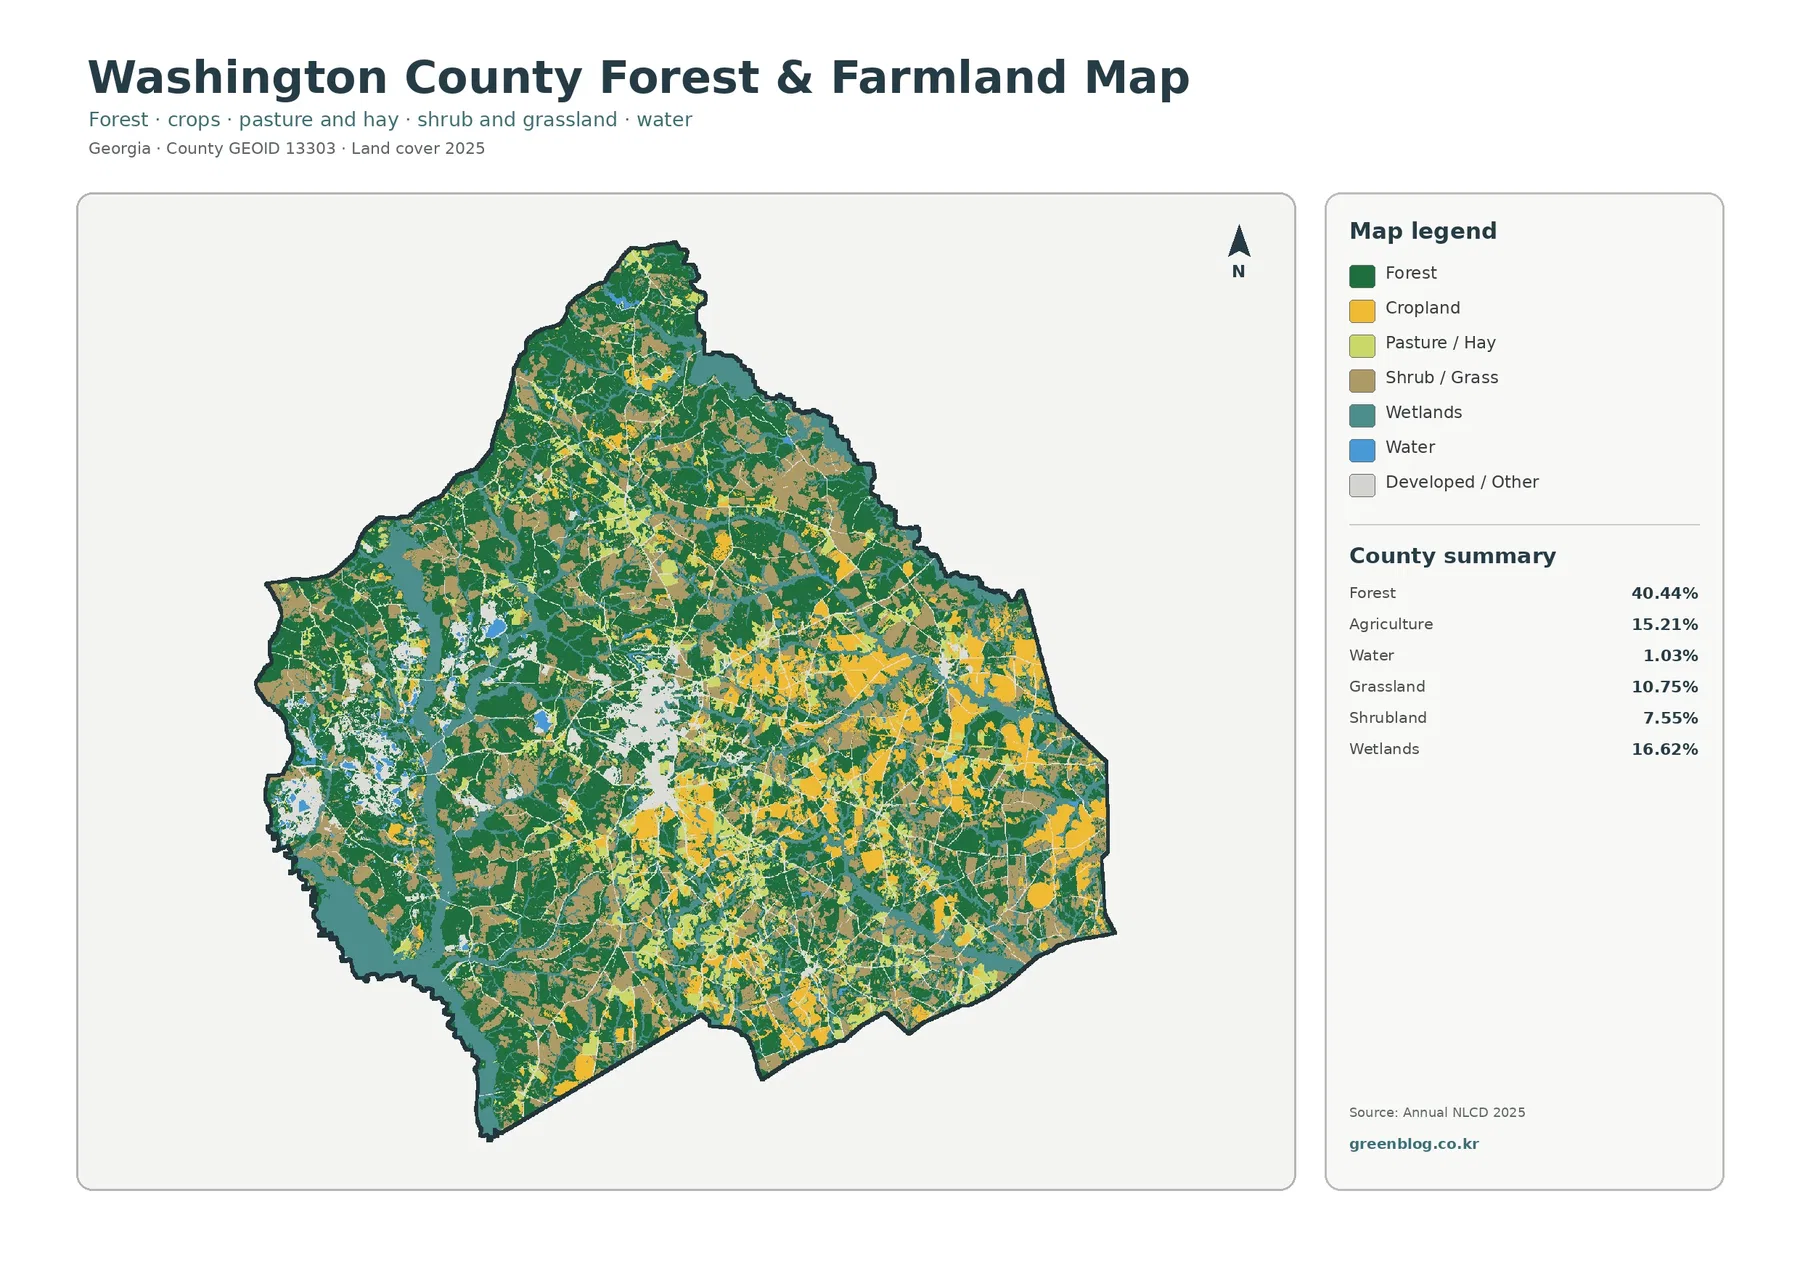
The forest-and-farmland view removes much of the detail from developed classes, making the rural mosaic easier to follow. Dark green remains extensive in the north and southwest, but cropland becomes especially visible east and southeast of the county center. Yellow fields occur as both larger blocks and smaller openings. They are repeatedly separated by forest, pasture or hay, shrub and grass cover, and wetland strips rather than forming one continuous agricultural plain.
Agriculture is reported at 15.21%, yet the simplified legend distinguishes cropland from pasture and hay. That distinction is important because “agriculture” in a summary should not be read as a map of every farm parcel or every field in production. Grassland is another 10.75% of the general cover summary, and shrubland is 7.55%. Some open areas may visually resemble agricultural ground at this scale while belonging to a different land-cover class.
Local historical sources provide useful context without changing what the pixels mean. The New Georgia Encyclopedia describes agriculture as a long-standing part of Washington County and also notes a healthy timber industry and major kaolin activity. Those facts help explain why a reader may want to compare forest, farms, open ground, and developed surfaces here. They do not prove the cause of a specific yellow, green, gray, or teal patch on the 2025 image.
Wetlands remain prominent in the vegetation view and frequently interrupt forest or agricultural blocks. This makes the map useful for a county profile that needs to discuss natural cover alongside working land instead of treating the landscape as only forest and farms. The teal class should not be used as a legal wetland boundary. Regulatory wetlands, drainage decisions, and site-specific environmental reviews require dedicated official data and often field verification.
A 1.27% mean impervious share hides a very distinct Sandersville-area concentration
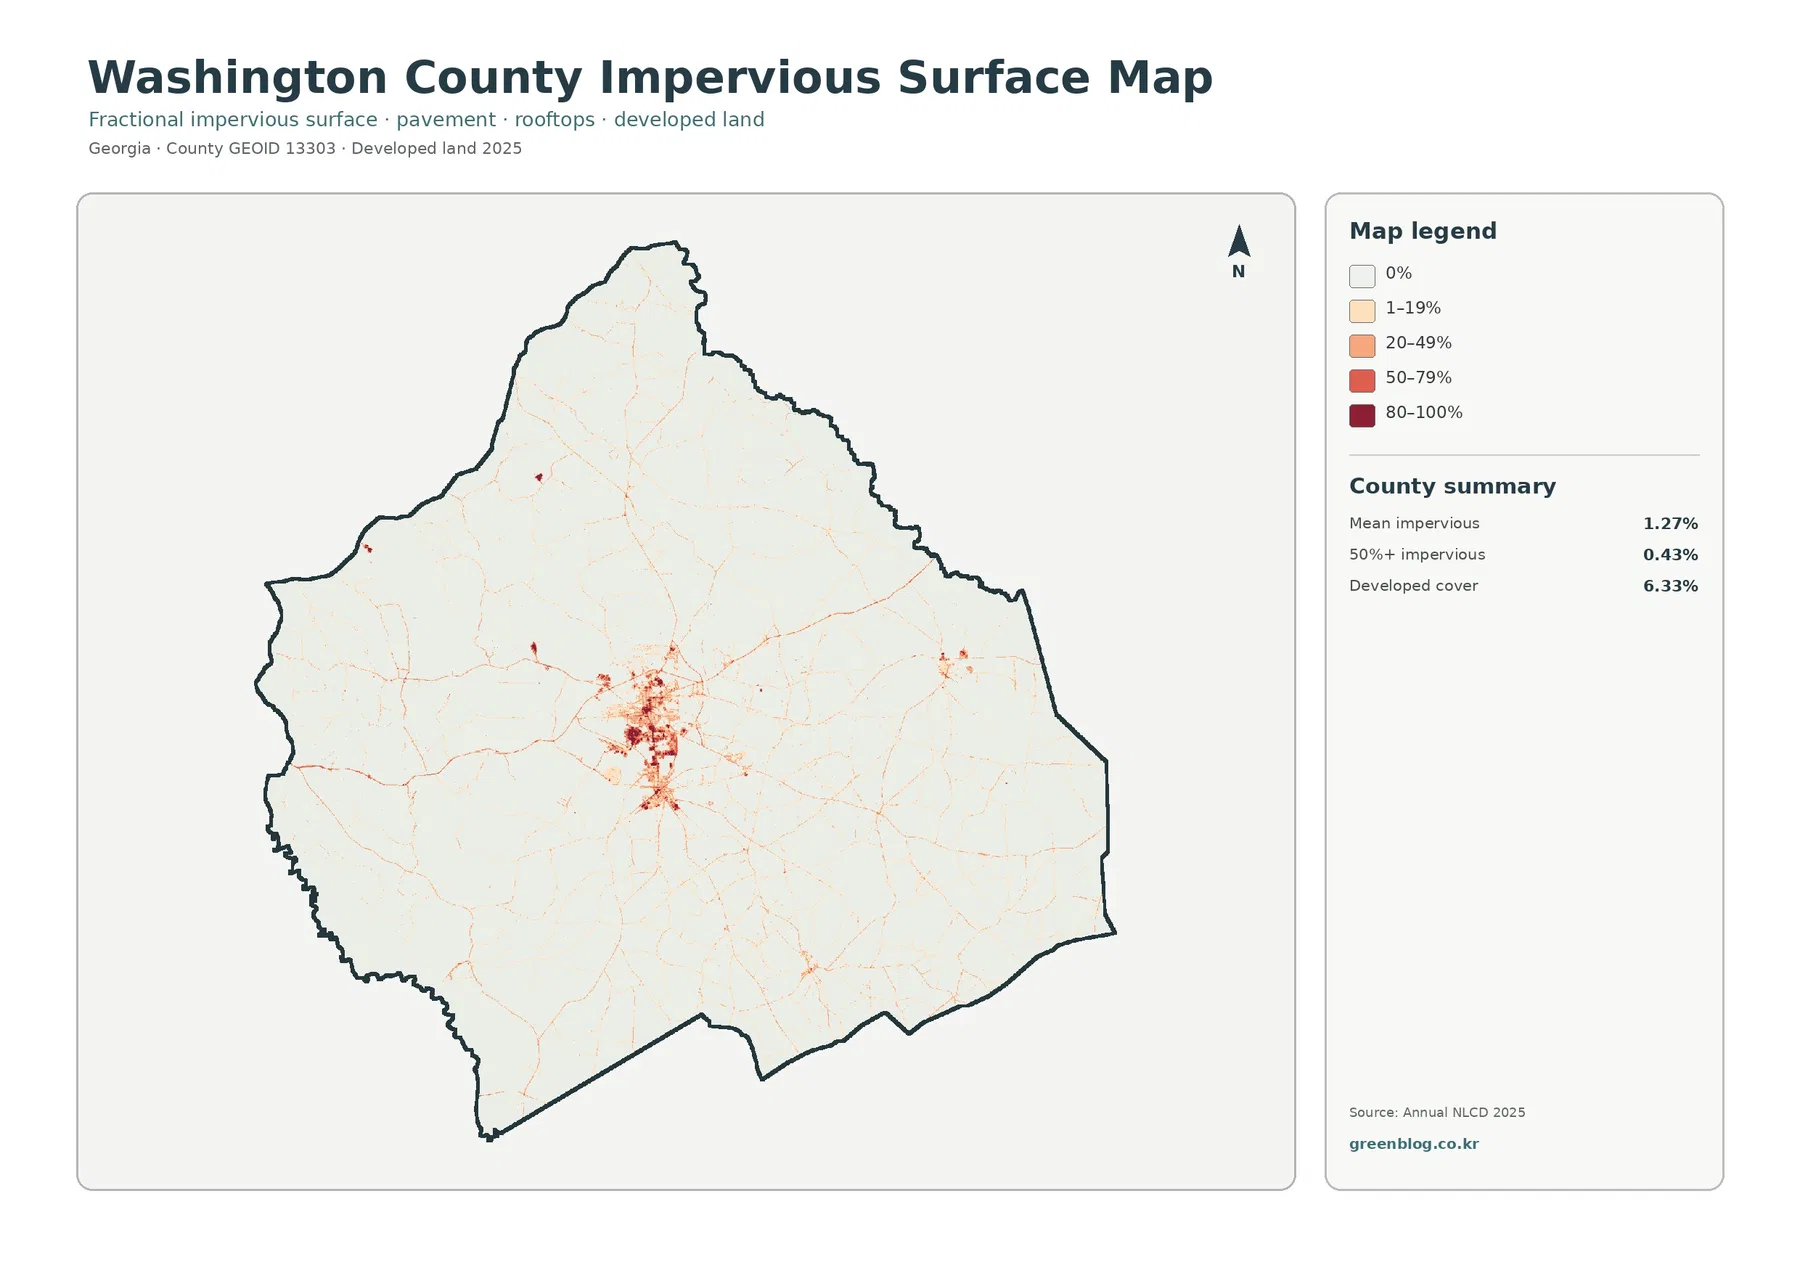
Impervious surface means ground covered by materials such as rooftops, pavement, and parking areas that do not readily absorb rainfall. Washington County has a mean impervious value of 1.27%, and only 0.43% of the county is mapped at 50% impervious or higher. Those numbers are far below the 6.33% developed-cover share because developed land can include lawns, trees, bare soil, and other permeable surfaces around buildings and roads.
The low countywide average does not mean hard surface is evenly sparse. Orange and red values gather sharply in the central Sandersville-area cluster, producing the strongest concentration on the map. Thin traces extend outward in several directions, and smaller clusters occur south, east, and west of the center. Large northern and southwestern rural areas remain mostly in the zero or low-impervious categories.
Several thin lines resemble a road network, but the map contains no road names. A 30-meter raster cell can hold pavement, a shoulder, grass, trees, and a ditch at the same time, so a line may not match the physical width of a road. The image is appropriate for showing where hard surfaces concentrate at county scale. It is not a roadway engineering layer, a parcel map, or a substitute for current transportation data.
Sandersville’s role as the county seat and largest town provides a reasonable geographic reference for the central concentration, but the impervious map should not be turned into a municipal boundary map. Some hard-surface cells can lie outside city limits along roads, industrial properties, or scattered development, while wooded and grassy cells can occur inside a city. Pairing the impervious view with the general land-cover image helps separate “developed class” from “hard-surface percentage.”
The 1985–2025 endpoint comparison is widespread: 43.42% of cells carry a different class
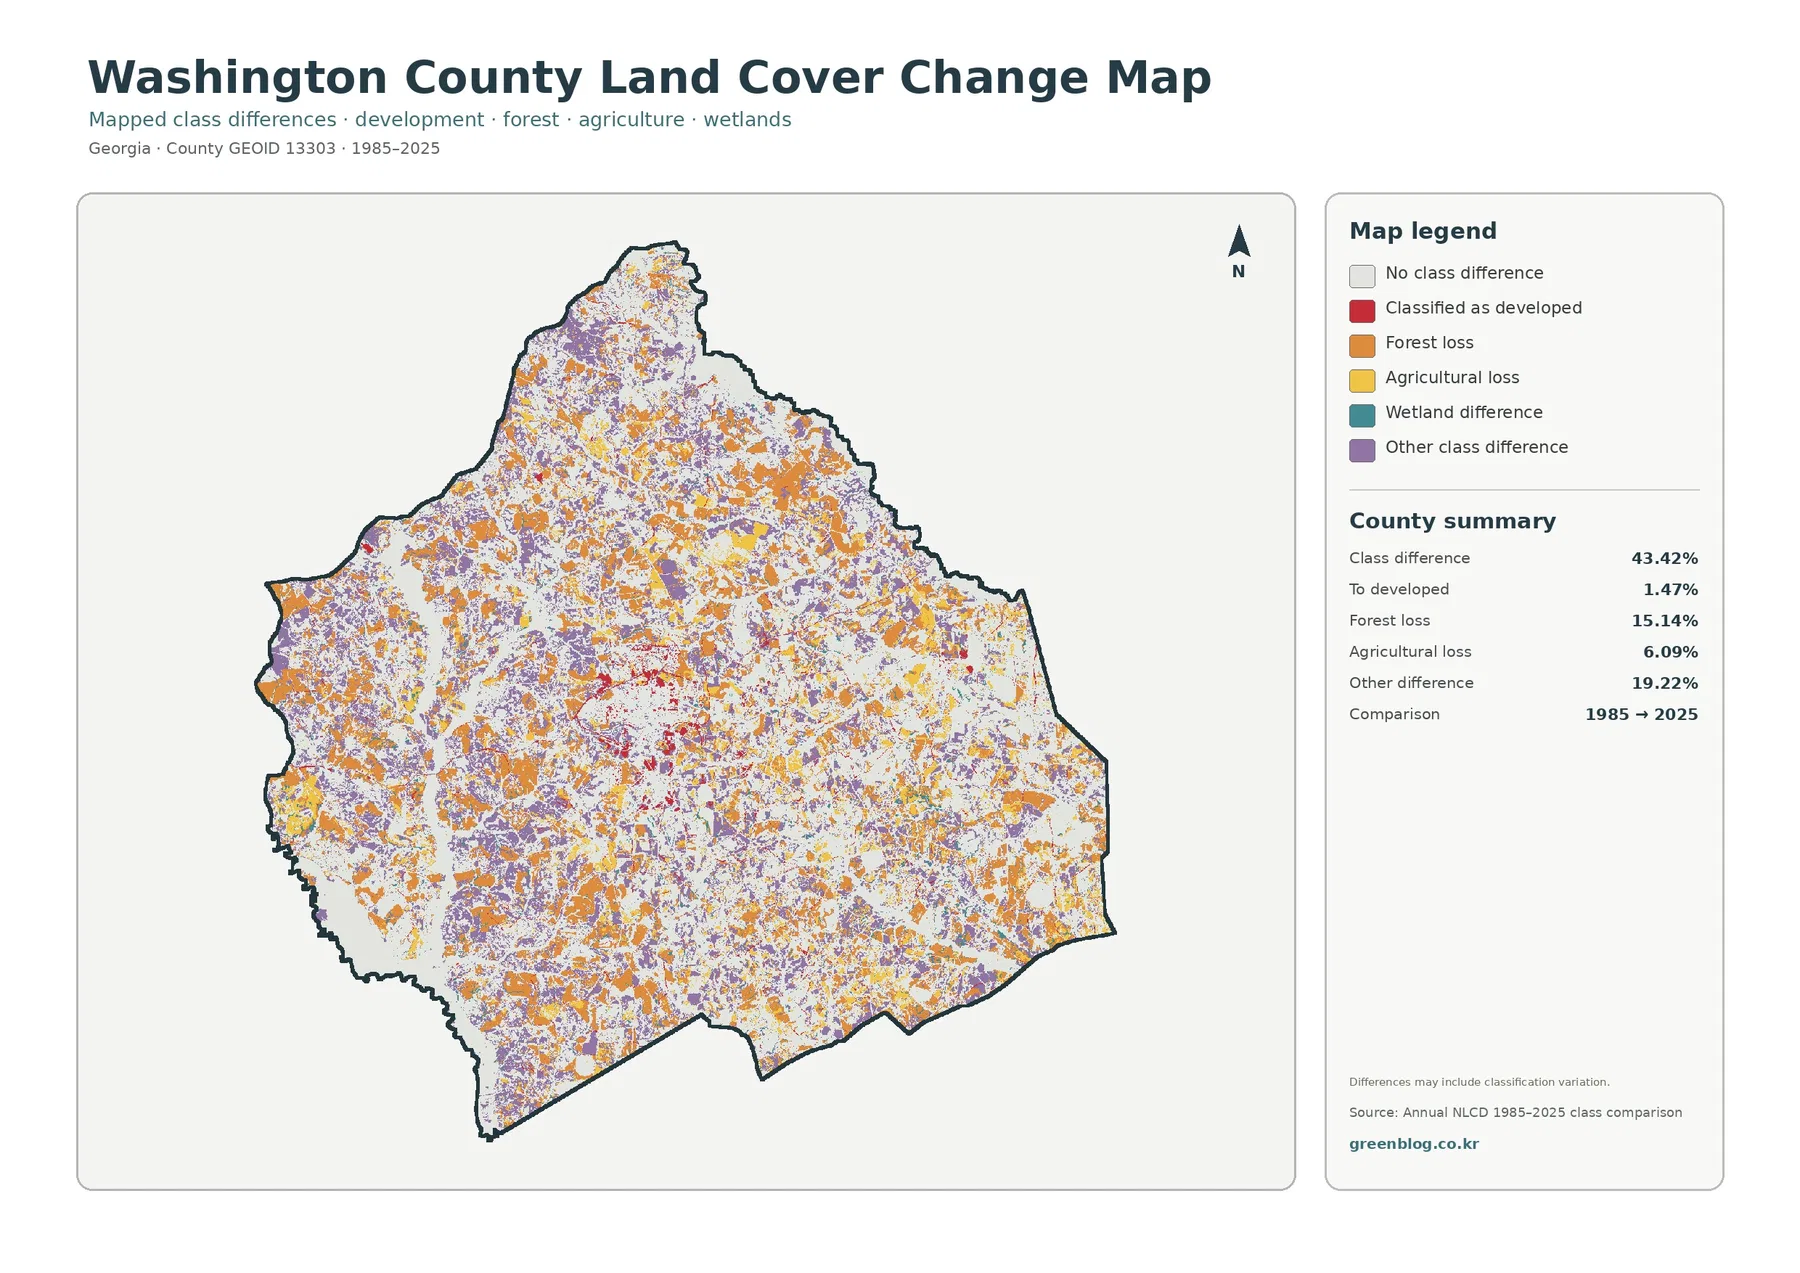
The change image is much busier than the current-cover maps. The supplied summary reports a 43.42% class difference between 1985 and 2025. It separately lists 15.14% forest loss, 1.47% classified to developed, 6.09% agricultural loss, and 19.22% other difference, with wetland-related differences also represented in the legend. The total means that the representative land-cover label differs between the two endpoints for a large share of mapped cells; it does not mean that 43.42% of the county was urbanized.
Orange forest-loss cells are scattered across nearly every part of Washington County. Many sit inside areas that remain strongly forested on the 2025 map. Those two observations can be true at the same time: forest can still be the county’s largest current class at 40.44% while numerous cells have a different forest classification than they had at the 1985 endpoint. The current map answers “what is mapped now,” while the change image asks whether the endpoint labels match.
Red developed-class differences are most noticeable around the central developed area and along some smaller corridors, yet the reported developed component is only 1.47%. The largest listed component is other difference at 19.22%. This makes it especially important not to explain the 43.42% figure solely as Sandersville growth. Changes among shrub, grass, wetland, forest, agriculture, and other classes can contribute, and classification variation may also be present.
Agricultural loss is listed at 6.09%, but that value does not say every affected cell became developed land. A cell may be forest, shrubland, grassland, wetland, or another category at the 2025 endpoint. The two-date comparison also does not reveal how many times a location changed between 1985 and 2025. Intermediate imagery and local records are needed to reconstruct the timing and cause of a specific transition.
The map itself warns that mapped differences may include classification variation. Seasonal vegetation, moisture conditions, mixed land-cover cells, sensor characteristics, and classification methods can affect how a location is labeled. The safest use is to treat the change layer as a screening map: find the parts of Washington County with many endpoint differences, then investigate those locations with annual imagery, forestry or agricultural records, mine and land-use information, or field evidence as appropriate.
Kaolin, timber, and agriculture add local context, but the map is not an industry or ownership layer
Washington County has a distinctive economic background that makes the mixed surface pattern worth examining. The New Georgia Encyclopedia describes a long agricultural history, a healthy timber business, and major kaolin mining and refining activity. It also lists Sandersville, Tennille, Davisboro, Deepstep, Harrison, Oconee, Riddleville, and Warthen among county communities. Those facts provide place context for a reader, but the supplied maps do not label individual mines, farms, timber tracts, or municipal boundaries.
Land cover describes what physically covers the surface—forest, crops, grass, wetland, water, developed cover, and related classes. It does not establish zoning, ownership, mineral rights, mine permits, agricultural tax status, or construction eligibility. A pale patch near a known mining region cannot be assigned to a particular company from this image alone, just as a yellow cropland patch cannot be treated as a legal farm parcel boundary.
This distinction also clarifies why the developed and impervious maps should be read together but not treated as identical. A developed cell can contain houses, lawns, trees, soil, and streets. The impervious percentage isolates the hard-surface component within the landscape more directly. Washington County’s 6.33% developed cover and 1.27% mean impervious share therefore describe related but different properties of the county surface.
Thirty-meter cells are designed for county patterns, not parcel or site decisions
Annual NLCD generally represents land cover with 30-meter raster cells. A single square can include trees, a small building, lawn, pavement, soil, and drainage features, yet one predominant class is assigned for the land-cover product. Impervious data report the hard-surface fraction at that same broad scale. Enlarging the JPG can make existing pixels easier to see, but it cannot recover parcel detail that was never present in the source.
The maps are therefore well suited to questions such as where forest is most continuous, where agriculture and wetlands intermingle, how strongly the Sandersville-area hard surfaces stand out, and where endpoint class differences are concentrated. They are not suitable for property surveys, wetland jurisdiction, mine-permit boundaries, drainage design, road engineering, or a decision about one tract of land. Those tasks need newer and more specialized records.
The current maps correspond to the supplied 2025 observation year. Construction, timber harvest, regrowth, crop changes, mining reclamation, flooding, or water-level changes after that observation may not appear. The 1985–2025 change layer is an endpoint comparison rather than a continuous forty-year history. A place could change several times and return to a similar class by 2025, leaving little or no endpoint difference even though substantial intermediate change occurred.
Download the four JPGs and choose the view that matches the question
The ZIP contains the four original JPG maps used in this article: 2025 land cover, forest and farmland, impervious surface and developed land, and 1985–2025 land-cover change. Each image measures 2480 × 1754 pixels. The supplied manifest does not mark those dimensions as meeting an A3 high-resolution reference, so a proof print is a sensible step before using the maps for a large poster or display.
For a county overview, begin with the general image because it places forest, wetlands, agriculture, open vegetation, and the central developed cluster on one page. The forest-and-farmland view is better when a lesson or report needs to compare wooded tracts with cropland and pasture. Use the impervious image when rooftops and pavement around the county center are the main subject. Save the change map for a discussion of endpoint differences so its orange, red, yellow, teal, and purple colors are not mistaken for current land-cover classes.
A presentation is usually clearer when one map is shown at a readable size and a second map is added for comparison. For example, a slide can establish the 40.44% forest share with the general map, then use the vegetation map to show how farm blocks interrupt the wooded pattern east and south of the center. A development-focused profile can start with the impervious image and then return to the general map to show how small the built concentration is relative to the entire county.
Frequently Asked Questions
What is the largest land-cover class in Washington County?
Forest is the largest 2025 class at 40.44%. Wetlands follow at 16.62%, agriculture at 15.21%, grassland at 10.75%, shrubland at 7.55%, developed land at 6.33%, and water at 1.03%. Forest leads, but Washington County is more mixed than a county where one class covers most of the land.
Why is developed cover 6.33% while mean impervious cover is only 1.27%?
The two measures describe different things. Developed land-cover classes can include lawns, trees, bare soil, and other permeable ground around buildings and roads. Impervious percentage focuses on hard surfaces such as rooftops and pavement, so the countywide mean can be much lower than the total developed-class area.
Does the 43.42% class difference mean that 43.42% of Washington County became developed?
No. Only 1.47% is listed as classified to developed in the endpoint comparison. The 43.42% total also includes 15.14% forest loss, 6.09% agricultural loss, 19.22% other difference, wetland-related differences, and possible classification variation. It identifies cells with different endpoint labels rather than one type of land-use change.
Sources and Reference Data
- MRLC Annual NLCD Data – official access point for the annual land-cover and comparison products used for the mapped classes.
- USGS Annual NLCD Land Cover Classification – definitions and background for forest, agriculture, developed land, wetlands, and other Annual NLCD classes.
- Washington County Official Website – Our History – county-provided context for Sandersville as the county seat and largest town.
- New Georgia Encyclopedia – Washington County – local context for county communities, agriculture, timber, and the kaolin industry.
- U.S. Census Bureau TIGER/Line Shapefiles – official geographic boundary reference for U.S. counties and related features.
Map File Information
The ZIP contains the four original Washington County JPG maps for comparing 2025 cover, forest and farmland, hard surfaces, and 1985–2025 class differences.
- Included Files: Use only the versions confirmed in the article and supplied images
- File Type: Use the confirmed download contents
- Intended Use: Printing, education, presentations, and map-based projects
Related Maps
- Appling County Georgia Land Cover Map
- Atkinson County Georgia Land Cover Map
- Bacon County Georgia Land Cover Map
Green Map creates custom-edited map images using open geographic data sources such as geoBoundaries, Natural Earth, OpenStreetMap, and government open data.
These maps are edited visual materials, not raw data files, and are provided for education, documents, presentations, and graphic reference.