Forest is the defining surface in the supplied 2025 Union County Georgia Land Cover Map. It covers 79.15% of the county summary, while agriculture accounts for 9.42%, developed land 8.66%, open water 1.75%, and grassland 0.49%. Lake Nottely breaks up the wooded northwest, and the strongest developed cluster sits in the central part of the county around the Blairsville area.
This page pairs that countywide view with a forest-and-farmland map, an impervious-surface map, and a 1985–2025 class-difference map. The WebP versions are shown with the explanation below. The four original 2480 × 1754-pixel JPG maps are also grouped in one ZIP so the same county can be used in a report, lesson, presentation, or regional comparison without rebuilding the graphics.
Table of Contents
A mountain county where the 2025 surface is overwhelmingly wooded
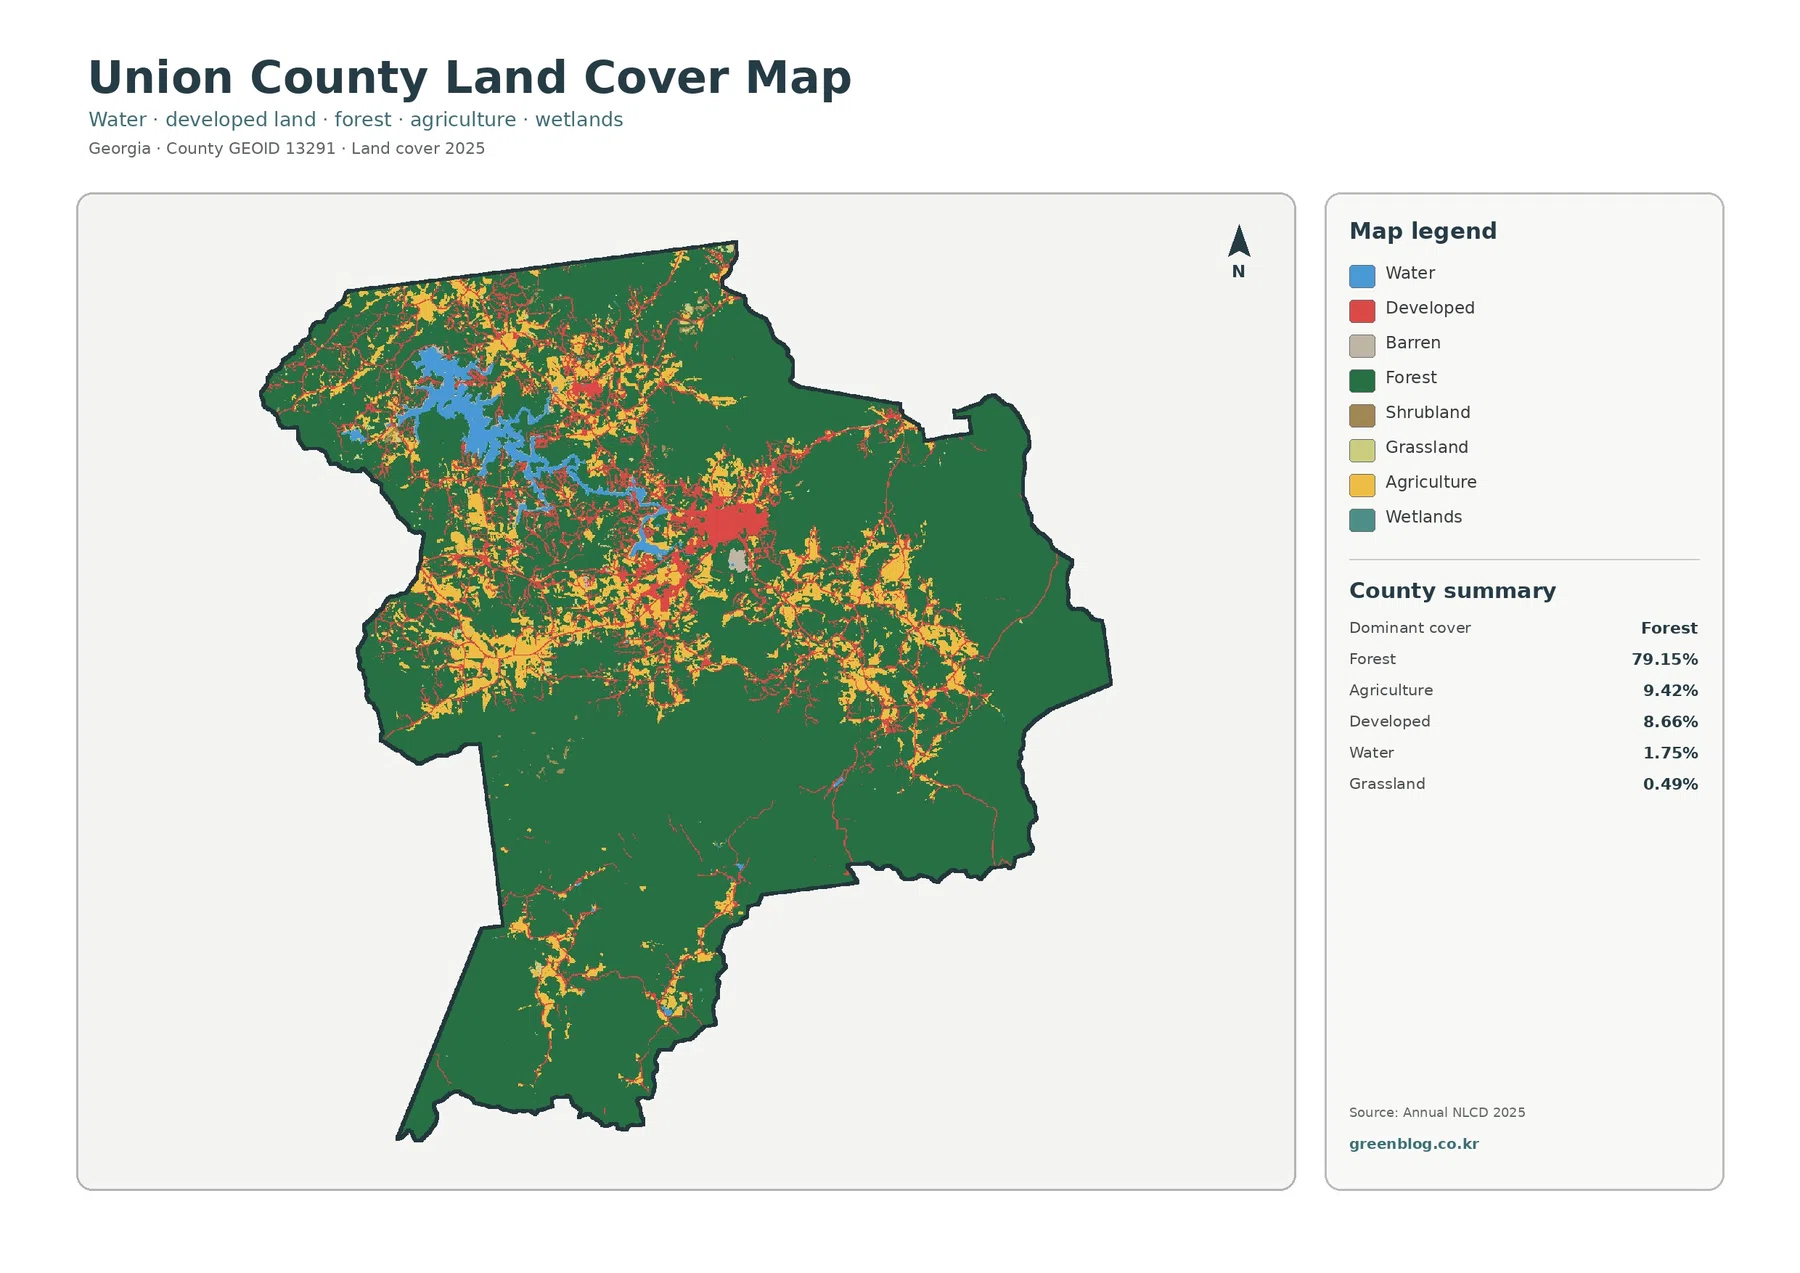
Dark green covers most of the county outline, especially across the south and east. The more complex mix lies across the northwest and central portion, where yellow agricultural areas, red developed land, and blue water interrupt the forest. Instead of broad rectangular farm blocks, open land appears in smaller patches and narrow connected areas. That pattern gives the map a distinctly different look from flatter agricultural counties farther south in Georgia.
The 79.15% forest share is not just a number in the legend; it is visible as the continuous background across most of the map. Union County’s official visitor information places the county in the North Georgia mountains and highlights forested recreation areas such as Vogel State Park and the Chattahoochee National Forest. The land-cover image does not draw park or federal ownership boundaries, so the green class should be read as forest cover rather than public land.
Open water is only 1.75% of the supplied land-cover summary, yet Lake Nottely is one of the most recognizable features in the map. The reservoir creates a large blue shape in the northwest, with forest, open land, and developed surfaces close to its shoreline. Its visual importance is therefore much greater than the small countywide percentage might suggest.
Working land appears as openings within a much larger forest matrix
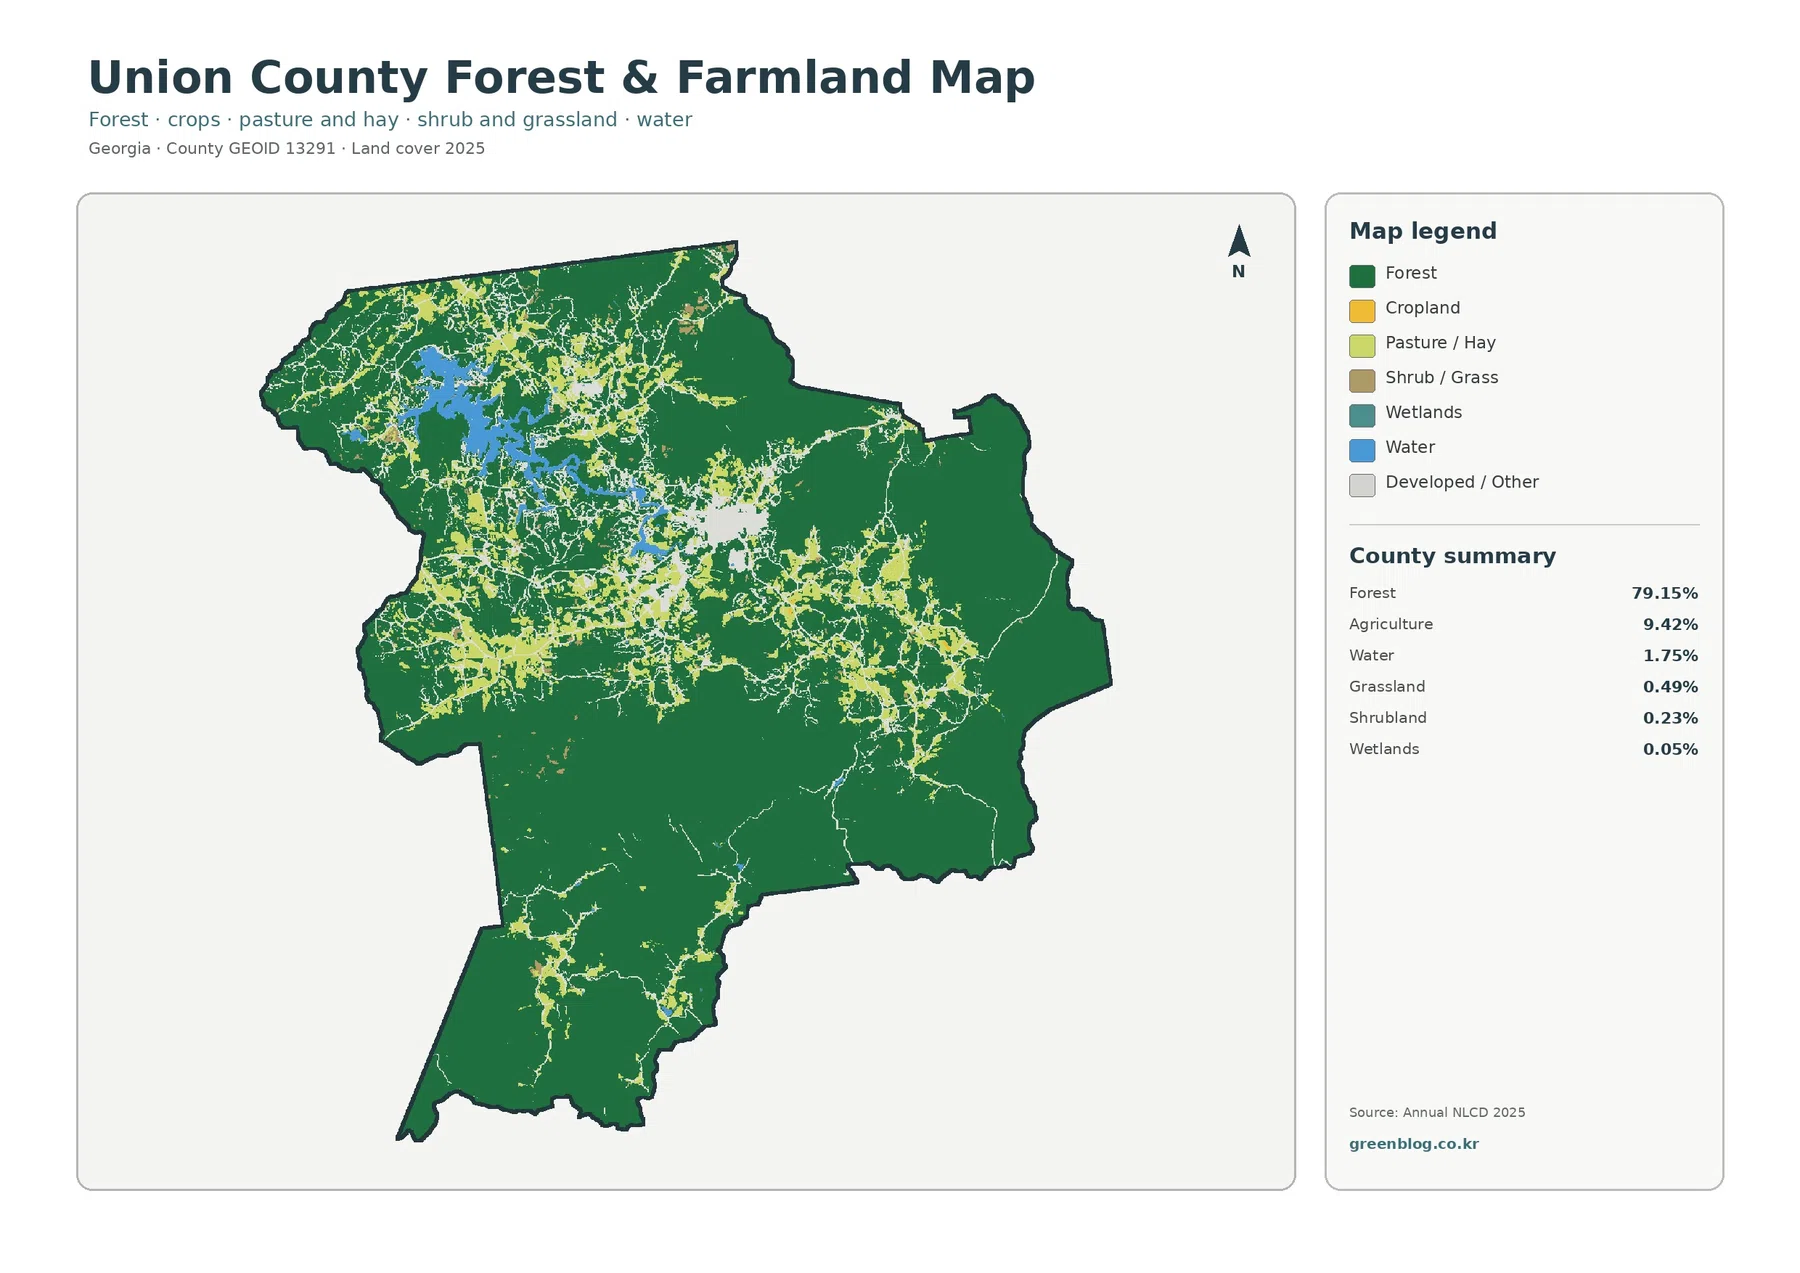
The forest-and-farmland view removes some of the visual competition from the general map. Forest remains the dominant 79.15%, while agriculture is 9.42%, water 1.75%, grassland 0.49%, shrubland 0.23%, and wetlands 0.05% in the supplied summary. With fewer categories competing for attention, the open areas in the northwest and central county are easier to follow from one patch to the next.
Pasture, hay, and crop-related colors do not form one large agricultural belt. They appear as irregular openings between wooded slopes and other surfaces, with far fewer large patches in the long southern part of the county. That makes this map useful when the question is not simply “how much agriculture is there?” but “where does working or open land break the forest pattern?” The answer is much more spatial than a single percentage.
Around Lake Nottely, water and agricultural or pasture colors come close together, but substantial forest remains at many shoreline locations. A presentation about the reservoir should therefore avoid describing its surroundings as uniformly developed or uniformly agricultural. The map supports a more careful description: the lake sits within a mixed northwest landscape where forest is still the dominant cover, while open and built surfaces are more frequent than in much of the south and east.
Hard surfaces make the central settlement pattern easier to see
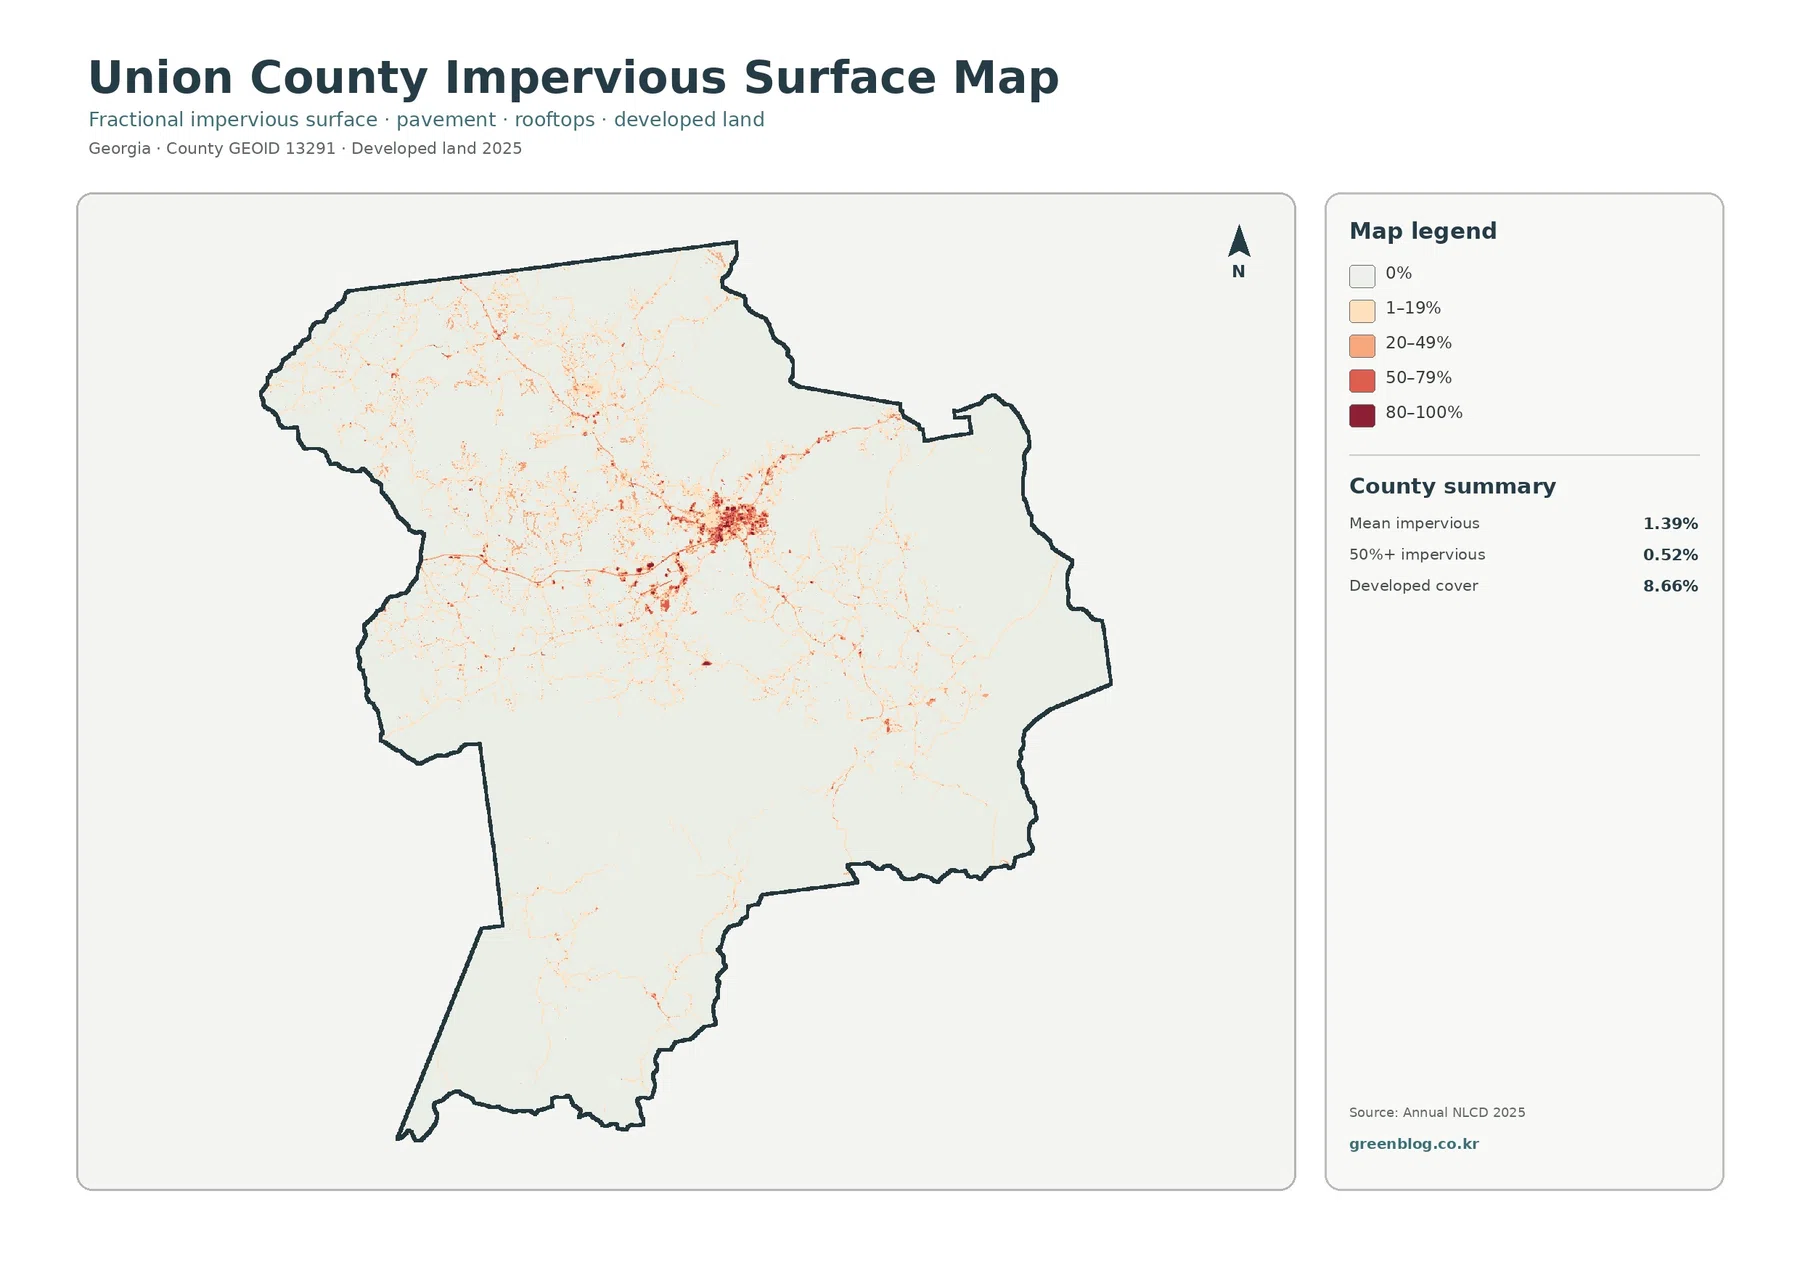
The countywide mean impervious value is 1.39%, and only 0.52% of the mapped area is listed at 50% impervious or greater. Those figures are much lower than the 8.66% developed-cover share because a developed land-cover class can contain plenty of permeable ground. Yards, trees, roadside vegetation, and open soil may sit beside buildings and pavement inside the same developed landscape.
The map’s strongest cluster is in the central county, where darker cells gather tightly and several linear traces extend away from the core. This is the clearest of the four maps for seeing the concentration of hard surfaces associated with the Blairsville area and connected road corridors. Smaller traces appear around Lake Nottely and elsewhere, but the large forested portions of the county remain mostly in the zero or low-impervious classes.
The 1985–2025 comparison is densest in the more settled half of the county
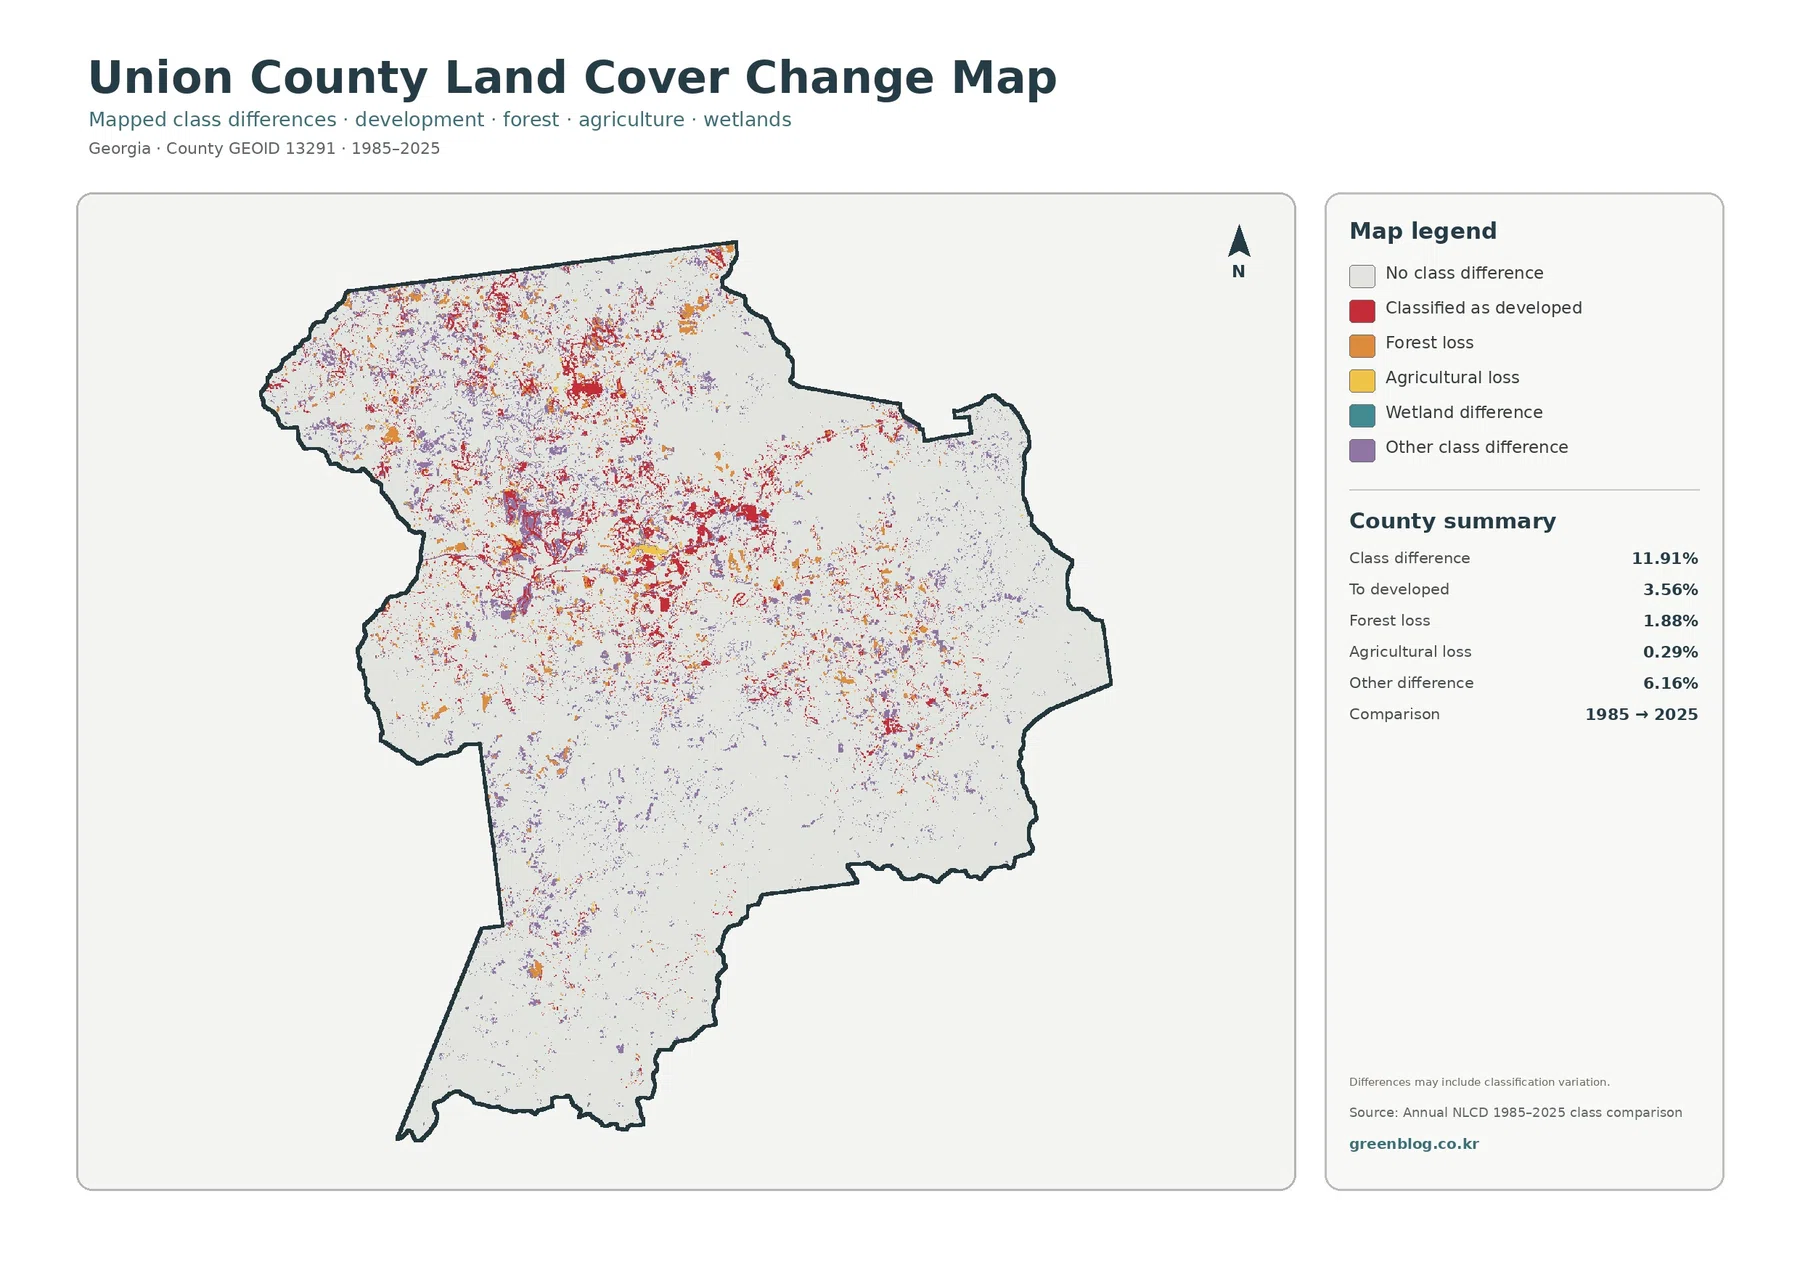
The change map should be read as an endpoint comparison, not as a continuous history. The supplied summary lists 11.91% of the county as a class difference between 1985 and 2025. Within that total, 3.56% is classified as a change to developed, 1.88% as forest loss, 0.29% as agricultural loss, and 6.16% as other difference. The map also warns that some differences may include classification variation.
Red cells are most frequent across the northwest and central portion of Union County, broadly where current open and developed surfaces are also more common. The long southern section and much of the east contain larger areas with no mapped class difference. This uneven distribution is more informative than treating 11.91% as if it were spread evenly across every part of the county.
Thirty-meter cells set the scale for every interpretation
Annual NLCD uses a raster grid with 30-meter cells. Each cell receives a predominant classification even when a small area contains several real surfaces, such as trees, a house, a driveway, grass, and a drainage channel. The result is consistent for county-scale comparison, but it cannot preserve every edge visible in high-resolution aerial photography.
The download contains the four original JPG map views
The ZIP includes one original JPG for each map discussed on this page: 2025 land cover, forest and farmland, impervious surface and developed land, and the 1985–2025 class-difference comparison. Each file measures 2480 × 1754 pixels. The set is designed for county-level reference graphics rather than parcel, survey, engineering, flood, zoning, or regulatory decisions.
Start with the file that directly supports the subject. Use the land-cover map for composition, the forest-and-farmland map for wooded versus open surfaces, the impervious map for hard-surface concentration, and the change map for two-date screening. Keeping the files separate makes it easier to place a readable legend in a report or slide without shrinking four different classifications into one crowded image.
Frequently Asked Questions
What is the dominant land-cover class in Union County?
Forest is the dominant 2025 class at 79.15% in the supplied summary. Agriculture follows at 9.42%, developed land at 8.66%, and open water at 1.75%. The map also makes the distribution clear: forest occupies most of the south and east, while the northwest and central county contain a more complicated mix of water, open land, and development.
Why is developed cover 8.66% when mean impervious cover is only 1.39%?
The two measures describe different things. A developed land-cover class can include lawns, trees, bare soil, and other permeable surfaces around buildings and roads. Impervious percentage isolates hard surfaces such as rooftops, pavement, and parking areas. That is why a visibly developed center can exist even though the countywide impervious mean remains low.
Does the 11.91% class difference mean that 11.91% of Union County was developed?
No. The 11.91% value is the total share of cells classified differently at the 1985 and 2025 endpoints. The supplied categories include 3.56% classified to developed, 1.88% forest loss, 0.29% agricultural loss, and 6.16% other difference. The map notes that classification variation may be included, and it does not show the timing or cause of every change.
Sources and Reference Data
- MRLC Annual NLCD Data – official access point for the annual land-cover products used for the 2025 and two-date map views.
- USGS Annual NLCD Land Cover Classification – official guidance for interpreting forest, developed, agriculture, water, wetland, and related land-cover classes.
- U.S. Census Bureau TIGER/Line Shapefiles – official geographic boundary data used for county mapping and reference.
- Union County – About Union County – county information on location, area, Blairsville, and the North Georgia mountain setting.
- Union County – Outdoor Recreation – official county information about Lake Nottely, Vogel State Park, and other local natural features.
Map File Information
The ZIP contains four original JPG maps for comparing Union County's forest-dominant 2025 cover, Lake Nottely, Blairsville-area hard surfaces, working-land openings, and 1985–2025 class differences.
- Included Files: Use only the versions confirmed in the article and supplied images
- File Type: Use the confirmed download contents
- Intended Use: Printing, education, presentations, and map-based projects
Related Maps
- Appling County Georgia Land Cover Map
- Atkinson County Georgia Land Cover Map
- Bacon County Georgia Land Cover Map
Green Map creates custom-edited map images using open geographic data sources such as geoBoundaries, Natural Earth, OpenStreetMap, and government open data.
These maps are edited visual materials, not raw data files, and are provided for education, documents, presentations, and graphic reference.