Stephens County is predominantly forested, yet its maps also contain a compact developed center, a broad rural patchwork, and a water-rich eastern edge. The 2025 county summary puts forest at 62.35%, while developed land and agriculture each account for about fifteen percent. Four views on this page separate those features instead of treating the county as one uniform landscape.
The four original JPG maps are available together in one download, while WebP versions are displayed in the article for quick viewing. Use the general land-cover layer for the overall pattern, the forest-and-farmland layer for rural cover, the impervious map for the built surface around Toccoa, and the 1985–2025 layer when the question is long-term class difference rather than present-day cover.
Table of Contents
The county’s 62.35% forest share is concentrated most strongly north and west of Toccoa
Forest dominates the 2025 summary at 62.35%. Developed land is 15.67%, agriculture is 15.06%, water is 2.17%, and grassland is 1.77%. The percentages are useful, but the map adds an important distinction: the forest is not distributed evenly. Large, continuous green areas occupy much of the northwestern side, while the central, southern, and eastern portions contain a more fragmented mix of forest, fields, developed land, and water.
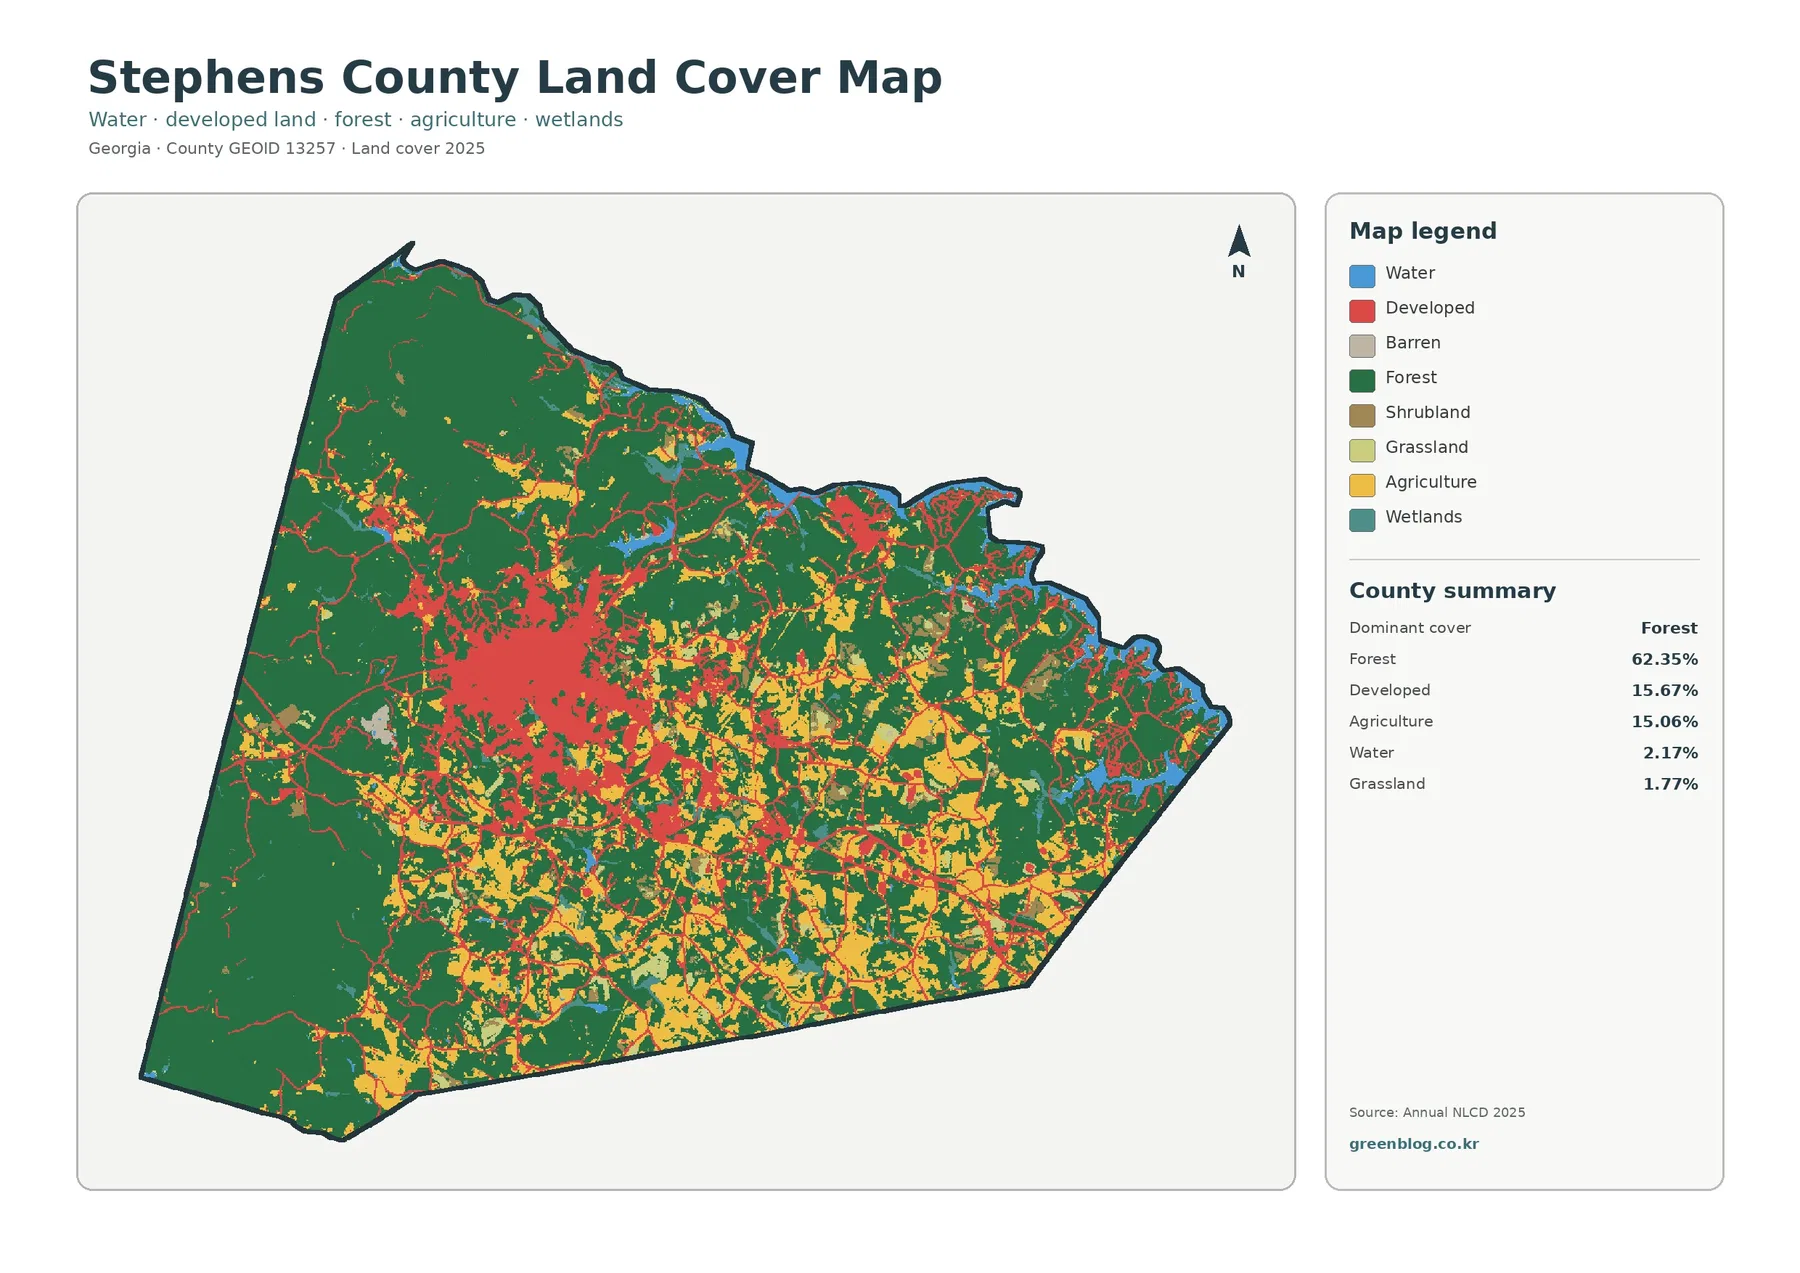
The largest connected developed patch appears in the central-western part of the county. Stephens County’s comprehensive plan describes local development as relatively tight and centered around Toccoa, which provides useful context for that concentration. Away from the main urban cluster, developed cells become thinner and more discontinuous. They often appear as narrow lines or small pieces among forest and agricultural cover rather than as a second large urban block.
Water is a small countywide percentage, but it has a recognizable geographic role. Blue and wetland-colored cells become more noticeable toward the northeastern and eastern boundary. The county’s official planning documents identify the Chattooga–Tugaloo river and reservoir system, including Lake Hartwell and Yonah Lake, as defining resources along this side of Stephens County. The land-cover image does not label individual water bodies, so those names should be used as regional context rather than assigned to every blue polygon.
| 2025 mapped cover | County summary |
|---|---|
| Forest | 62.35% |
| Developed | 15.67% |
| Agriculture | 15.06% |
| Water | 2.17% |
| Grassland | 1.77% |
Impervious surface narrows the urban pattern to a much denser core
Developed land and impervious surface are related, but they are not interchangeable. Impervious surface means constructed material such as pavement and rooftops that does not readily absorb water. The supplied map groups each cell by the estimated hard-surface fraction: 0%, 1–19%, 20–49%, 50–79%, or 80–100%. That approach makes it possible to distinguish a low-density developed setting with trees and lawns from a heavily paved commercial, industrial, or street environment.
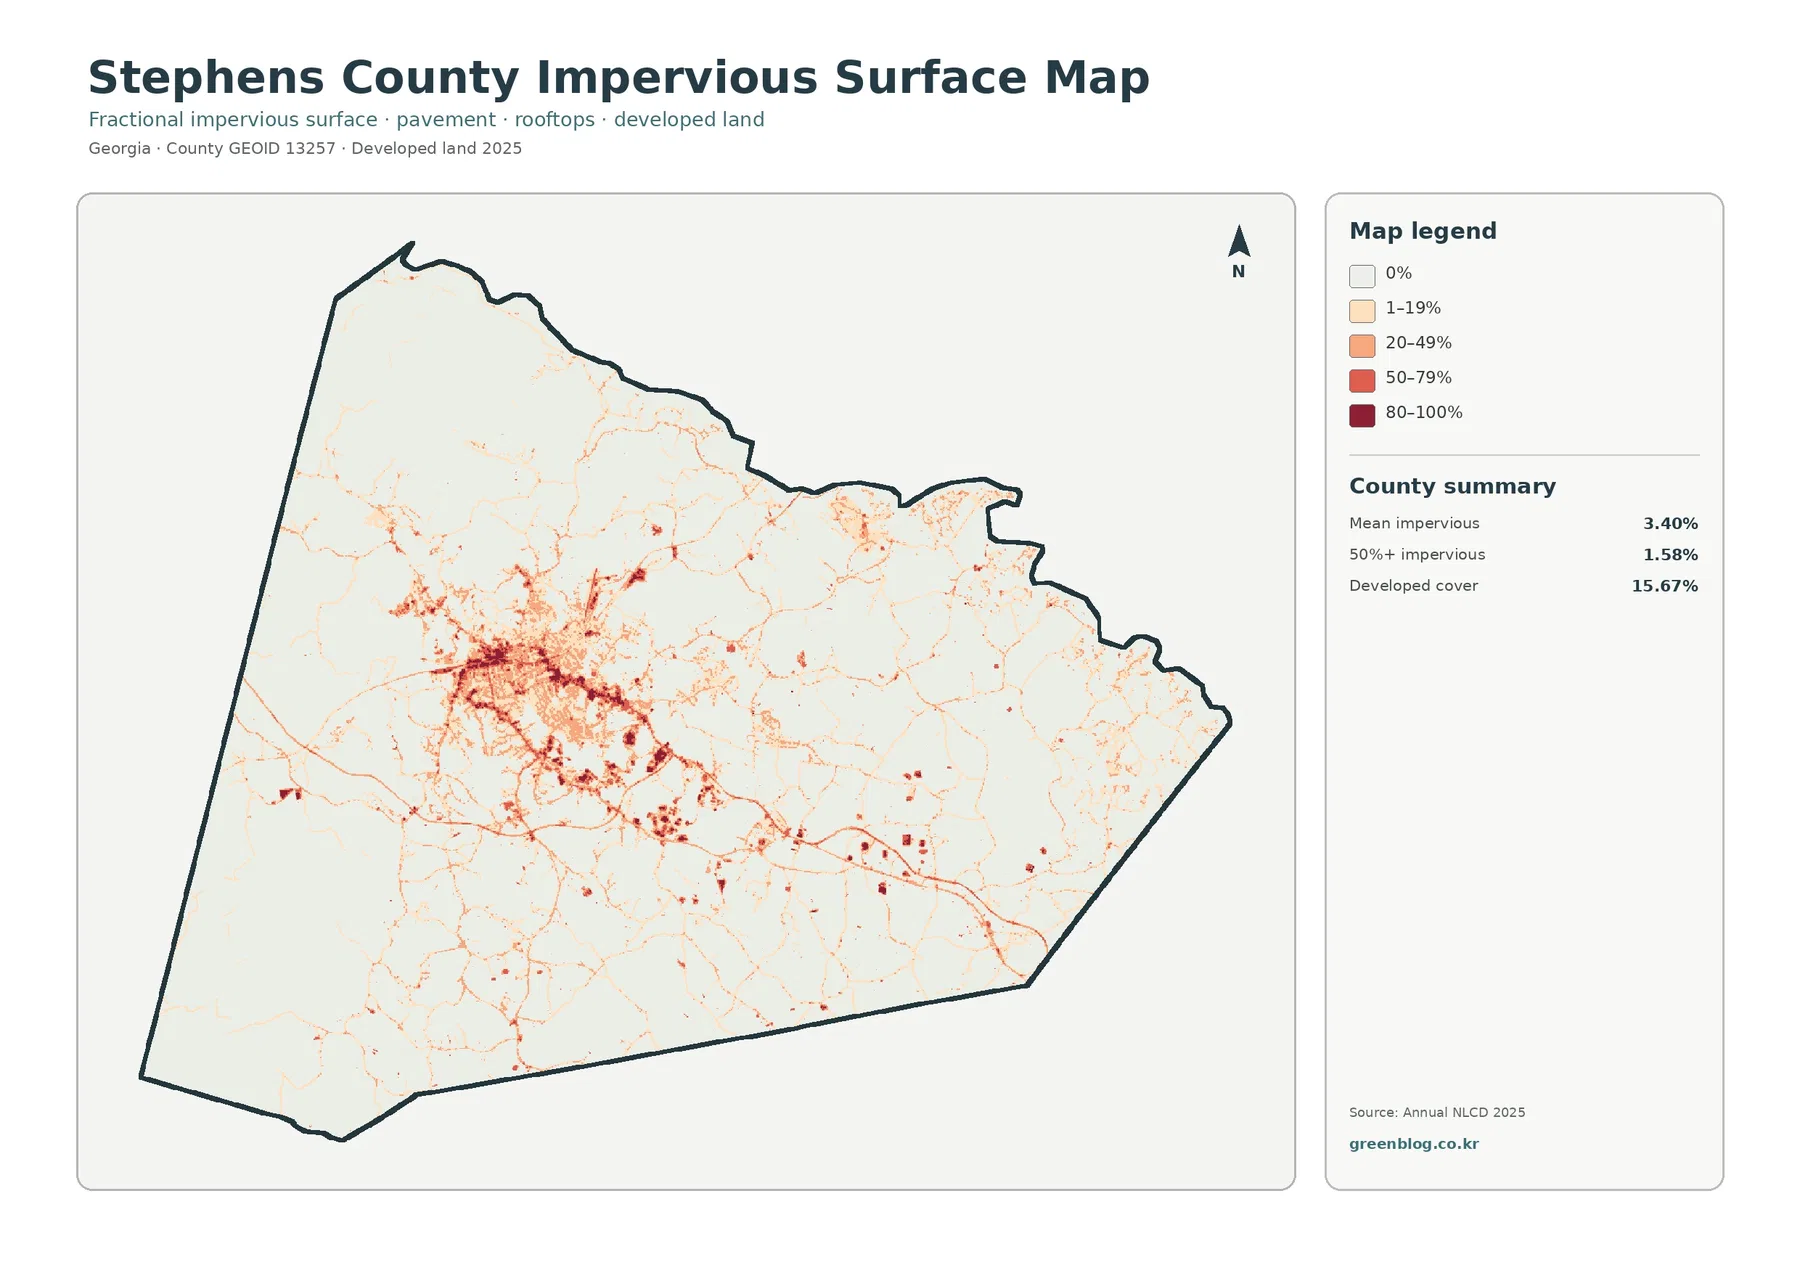
The darkest values form a compact cluster in the central-western urban area. From there, lighter and darker lines extend into nearby parts of the county, but broad outer areas remain near zero or in the lowest class. This pattern is much more concentrated than the red developed category on the general map. A neighborhood with yards, street trees, and scattered buildings may still be classified as developed even though only a portion of each 30-meter cell is actually covered by roofs or pavement.
The countywide mean impervious value is 3.40%, and only 1.58% of the mapped area is above 50% impervious. Those numbers are not in conflict with the 15.67% developed-cover figure because they measure different properties. One value describes land-cover classification; the other estimates the hard-surface fraction within cells. Treating the 3.40% mean as if it were simply the county’s “urban area” would understate lower-density developed places.
Local planning information also helps explain why narrow built patterns deserve attention. The 2021 joint comprehensive plan identifies SR 17 south of Toccoa as a major economic corridor and notes that stronger urban-scale development occurs along arterial roads and intersections where infrastructure is available. The impervious map does not label highways, so it should not be used to identify a particular line by name. It does, however, make corridor-shaped concentrations easy to compare with a separate road map.
Forest and farmland separate the mountain side of Stephens County from its broader rural interior
The forest-and-farmland map removes much of the visual emphasis from developed and miscellaneous cover. Forest, cropland, pasture or hay, shrub and grass, wetlands, and water remain prominent. As a result, the northwestern green block becomes even clearer, while agricultural colors are easier to trace across the center, south, and parts of the east. The map is especially useful for seeing that the county’s rural land is not simply one continuous forest.
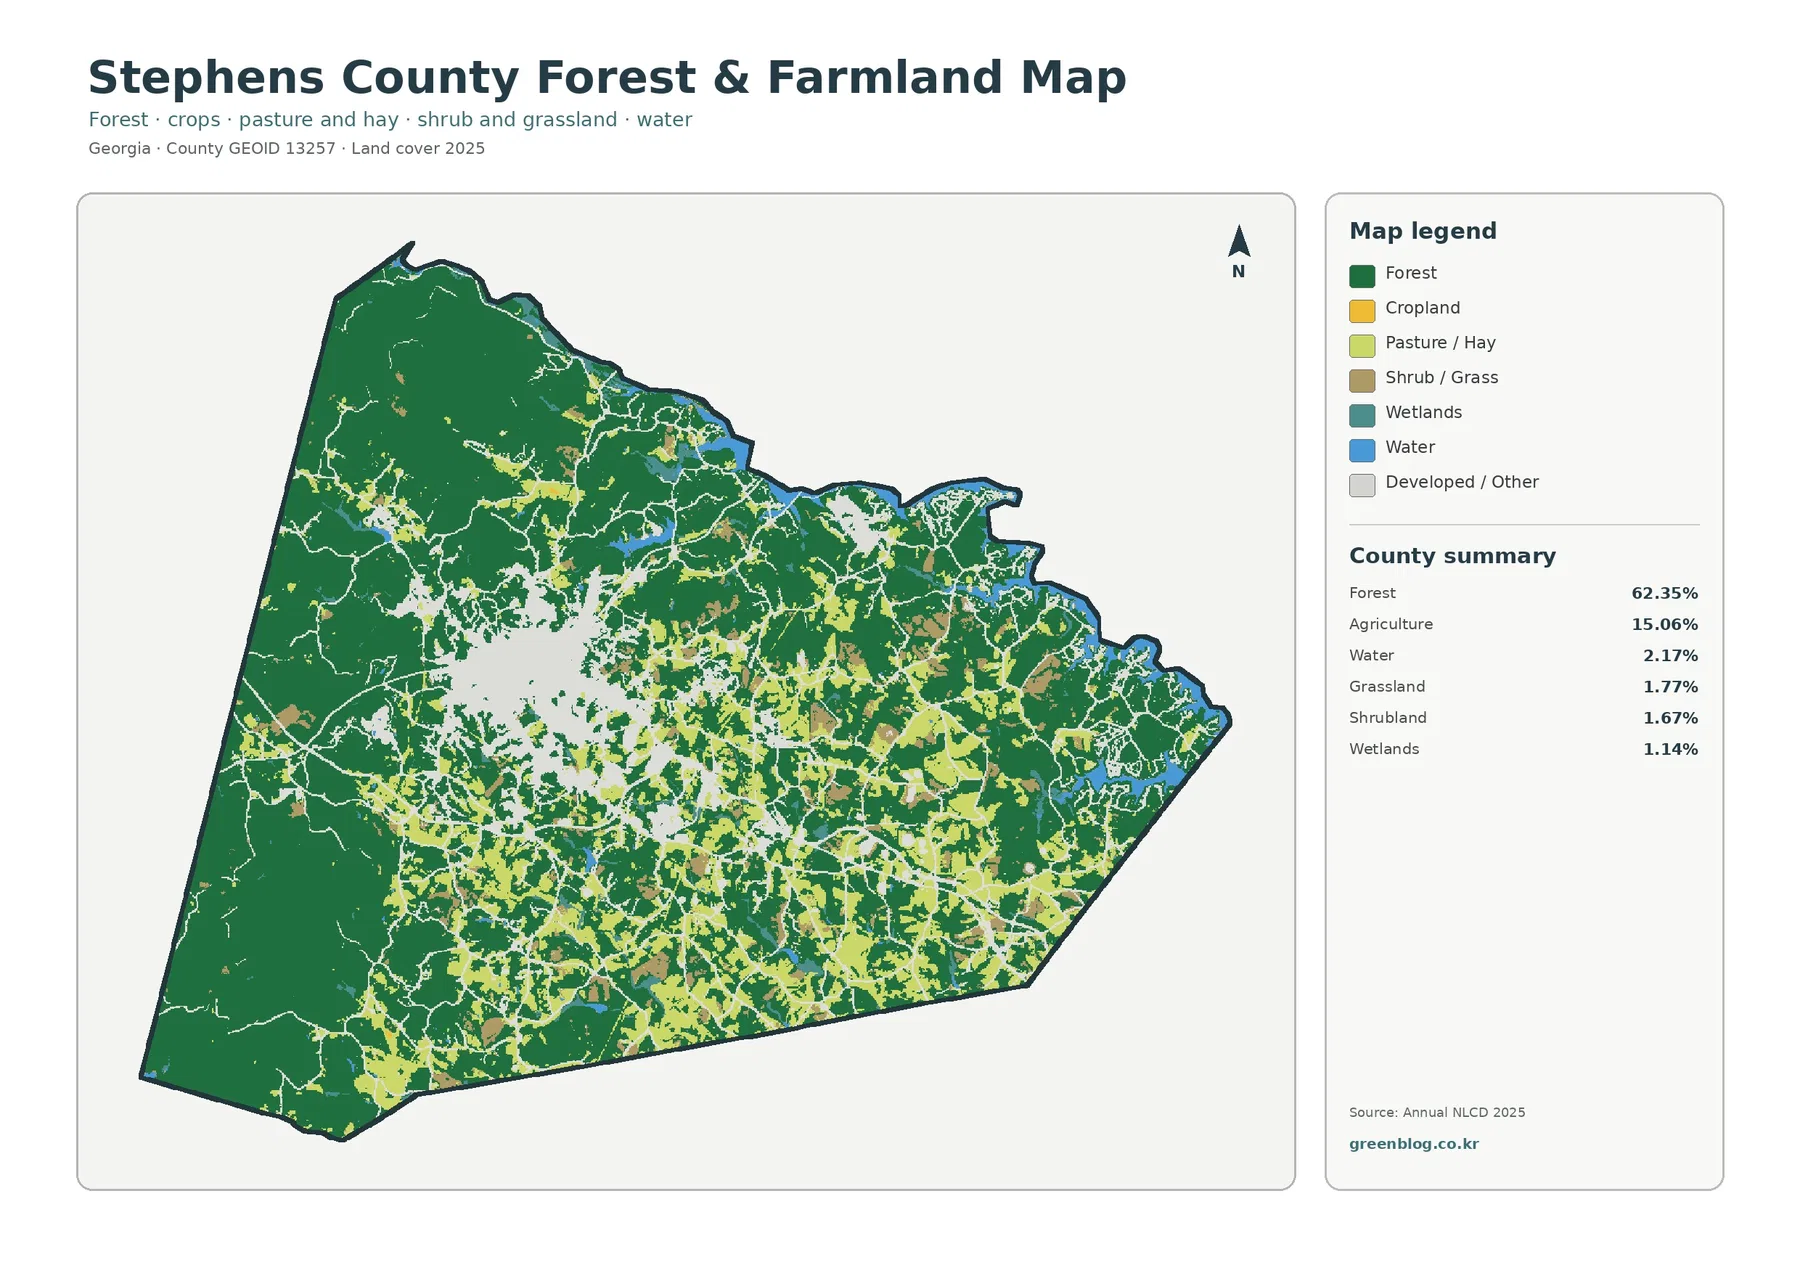
The official comprehensive plan gives the northwestern forest a useful geographic explanation. It states that about 24,000 acres, roughly 22% of county land, are in the Chattahoochee National Forest and that much of this protected or managed woodland lies on steeper slopes and ridgelines north and west of Toccoa. The Annual NLCD forest share is much larger than 22% because it counts forest across the entire county, not only federal forest land. Those two figures therefore describe different things and should not be combined.
Agriculture accounts for 15.06% of the 2025 land-cover summary. Yellow and light-green agricultural colors appear as many separate fields rather than one dominant block. The comprehensive plan notes that farming and pasture have historically favored gentler slopes and bottomlands, while steeper mountain land remained wooded or was used for timber. That source-backed description fits the broad contrast visible here without requiring the map to identify individual farms or parcel boundaries.
The focused map also lists shrubland at 1.67% and wetlands at 1.14%. These smaller categories matter when interpreting transitions between larger classes. A wetland is not the same as open water, and pasture or hay is not necessarily the same class as cropland. Keeping those legend categories separate is useful for habitat, watershed, and rural-landscape comparisons, even when their countywide percentages are modest.
The eastern river-and-reservoir edge adds a different landscape to the forested interior
Stephens County’s eastern side deserves a separate reading because water and adjacent forest recur along the boundary. The 2021 plan describes the eastern boundary as a river-and-reservoir landscape where the Chattooga River transitions through dams and smaller lakes toward the northern reaches of Lake Hartwell. It also identifies Lake Hartwell and Yonah Lake as reservoirs on the Tugaloo River system. Those official references explain why the county’s water features are not evenly scattered across the map.
Several creeks provide additional context. The planning document lists Toccoa Creek and Eastanollee Creek among streams connecting toward Lake Hartwell. The supplied land-cover maps do not display stream names, but they do show narrow water and wetland features in parts of the county. For watershed study, the land-cover layer can therefore act as a first background map, while a dedicated hydrography layer should be added when exact stream channels or named reservoirs are required.
The 1985–2025 layer records several kinds of class difference, not one development story
The change map compares the mapped class in 1985 with the class in 2025. Its summary reports class differences across 27.04% of Stephens County. Of the county area, 4.41% is categorized as changing to developed, 6.88% as forest loss, 0.94% as agricultural loss, and 14.66% as other class difference. Wetland difference is also a mapped legend category. The large “other difference” share is a strong reason to avoid describing all colored cells as urban expansion.
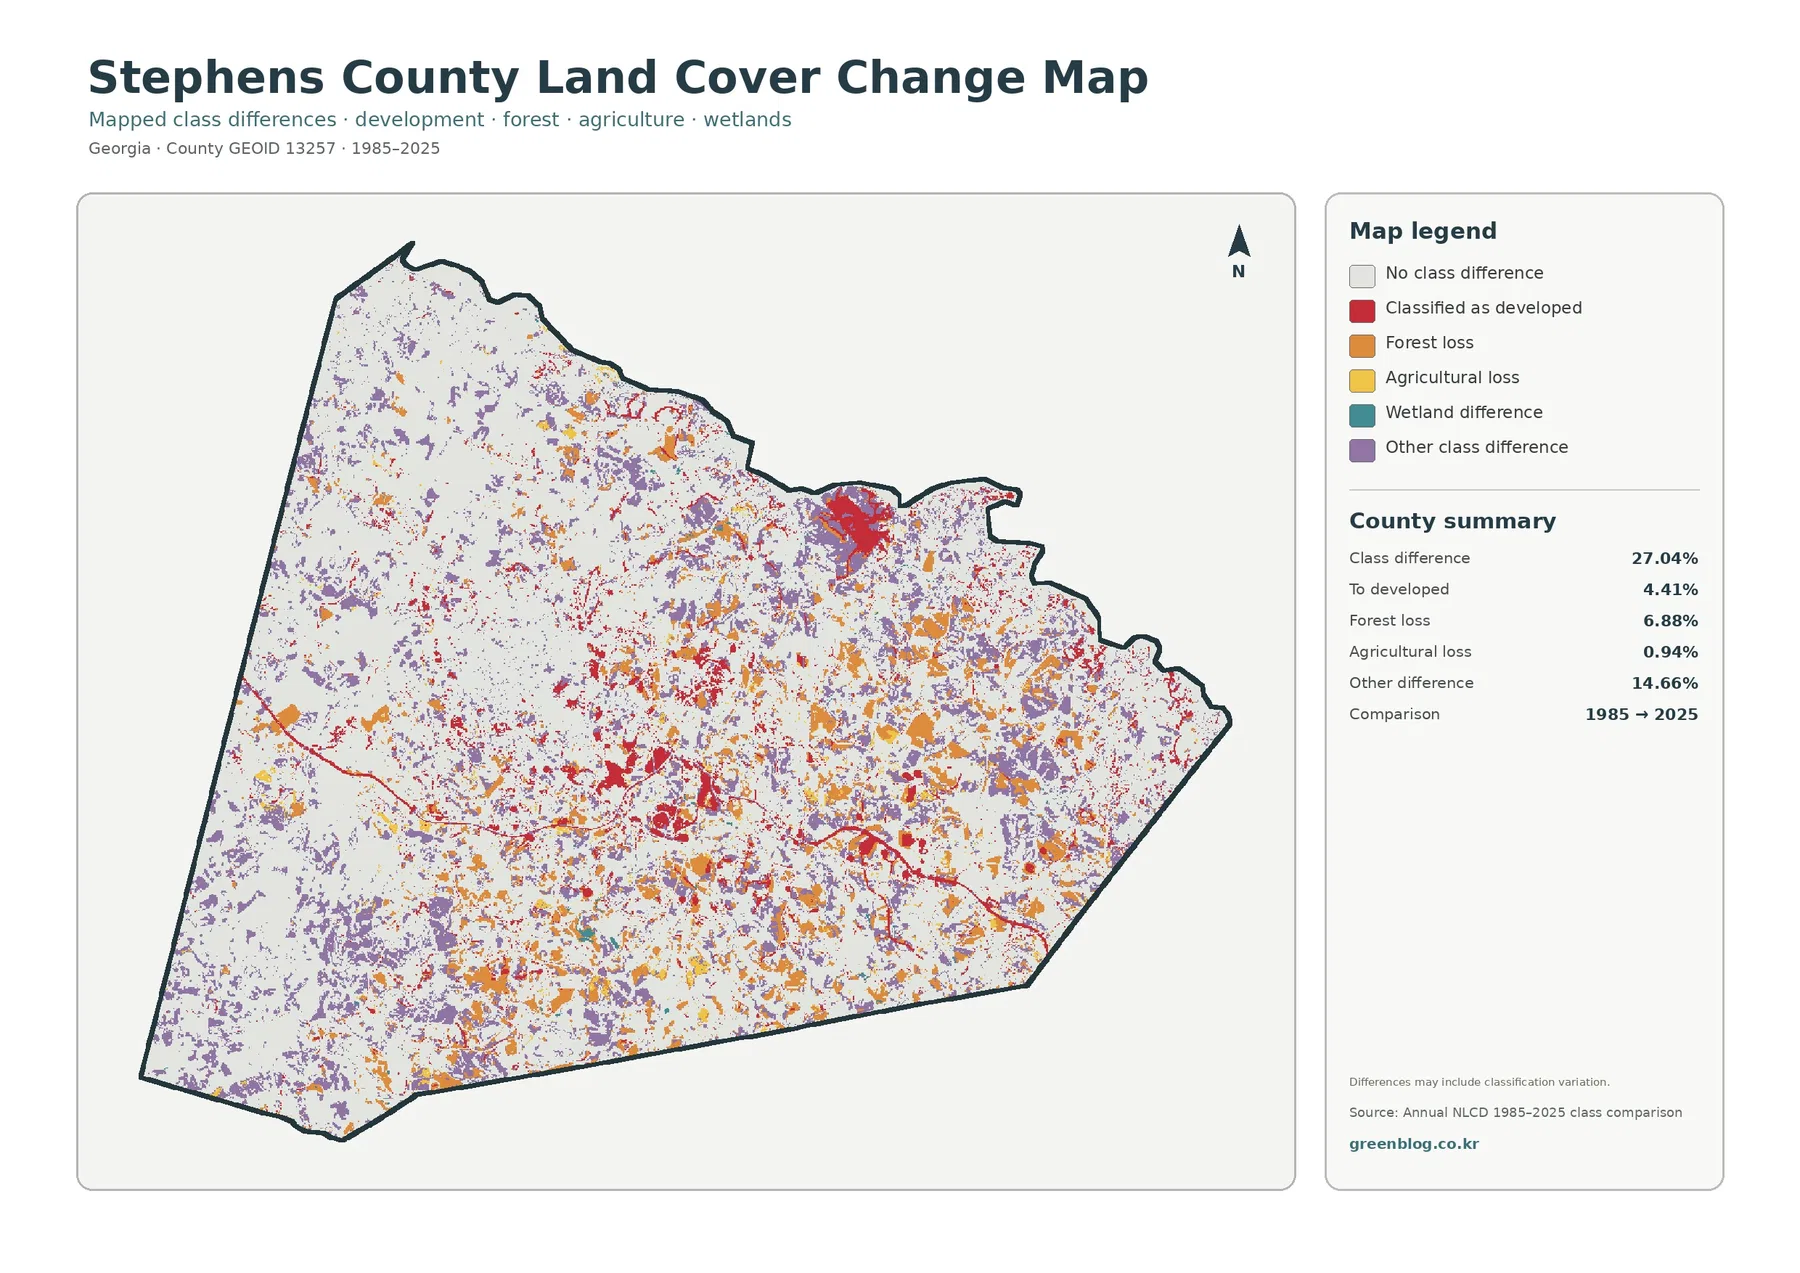
Red change-to-developed cells appear in several settings. Some lie in and around the existing Toccoa-centered built area, while another noticeable red patch appears farther north-central. Orange forest-loss cells are scattered much more widely, and purple other-difference cells occur throughout the map. Most of the county remains light, indicating no broad class difference under this comparison. The pattern is therefore a mosaic of changed and unchanged cells rather than a clean boundary advancing in one direction.
The map itself cautions that class differences may include classification variation. Annual NLCD is a raster product derived from satellite observations and models. A 30-meter cell can contain several surfaces at once, and a mixed cell near the edge of a forest, field, road, or water body can receive a different class in another year. The 27.04% figure should be read as “different mapped class between the two comparison years,” not as proof that 27.04% of the county experienced a complete physical conversion.
Choose the map by the question instead of treating all four layers as substitutes
For a quick county overview, start with the general 2025 layer. It is the only single view that puts forest, development, agriculture, water, wetlands, grassland, shrubland, and barren cover into one visual system. If the task is to compare the large northwestern woods with fields and pasture elsewhere, switch to the forest-and-farmland map. It removes much of the urban color competition and makes rural-cover boundaries easier to follow.
Use the impervious map when the question is about constructed surface intensity. It is better suited to comparing a dense built core with lower-density residential or rural development. Use the 1985–2025 map when the question explicitly involves change through time, but keep its classification warning in view. A current developed cell, a high-impervious cell, and a cell classified as “to developed” are three different observations and should not be described as though they were identical.
For classroom or presentation work, a useful sequence is to show the general map first, then select one supporting layer based on the discussion. The 62.35% forest figure can lead into the forest-and-farmland view. A discussion of Toccoa’s built footprint can move to the impervious surface map. A question about how the landscape differs from 1985 can move to the change layer. That sequence keeps each legend tied to a clear question rather than forcing the audience to interpret four different legends at once.
The downloadable JPGs are best for screen use, documents, and moderate-size printing
The article displays WebP previews, but the ZIP contains the four original JPG files: general land cover, forest and farmland, impervious/developed land, and 1985–2025 land-cover change. Because they use the same county boundary and page proportions, they are convenient for side-by-side comparison in a report or presentation. Keep the original map titles or captions visible, since the colors and summary values do not mean the same thing from one layer to another.
The asset manifest records each JPG at 2480×1754 pixels and marks the set as not meeting its A3 high-resolution reference. That does not make the files unusable, but it matters when choosing an output size. They should work well on screens and in ordinary documents; a large A3 enlargement may make small legend text and fine edges look softer. Test the actual print size before using the images for a large display.
Land cover is not zoning, ownership, or a parcel survey
Annual NLCD generalizes the ground into raster cells rather than tracing legal parcel boundaries. At roughly 30 meters per cell, one pixel may include a house, trees, lawn, and part of a road. The classification assigns a representative cover or an estimated fraction, so small ponds, narrow streams, individual buildings, and sharp forest edges can be simplified. These maps are appropriate for county-scale comparison, not for measuring a property line or determining the exact cover of a small lot.
Land cover also describes what is physically on the surface, not what local law allows. A forest-colored area is not automatically a protected zoning district, and a developed cell does not establish a right to build or expand. Stephens County Planning and Zoning maintains the county’s land-use regulations, rezoning process, conditional-use applications, and related official information. Legal or parcel-specific decisions should be checked there rather than inferred from these maps.
Finally, the observation year sets a time limit. The present-cover layers summarize 2025 conditions, while the change layer compares 1985 with 2025. Construction, clearing, regrowth, farming changes, or shoreline changes that occurred later will not appear. When a project depends on current conditions, pair this county-scale reference with newer aerial imagery, official local data, and field verification where appropriate.
Frequently Asked Questions
What is the largest land-cover class in Stephens County?
Forest is the largest 2025 class at 62.35%. The supplied map shows the strongest continuous forest concentration north and west of the Toccoa-centered urban area, with more agricultural and developed patches toward the center and south.
Which map is best for comparing development around Toccoa?
Use the general land-cover map to see the full developed category, then the impervious-surface map to see where pavement and rooftops are most concentrated. The two layers measure different things, so viewing them together is more informative than using either value alone.
Does the 27.04% change figure mean that much of the county was developed after 1985?
No. It is the share with a different mapped land-cover class between 1985 and 2025. The summary includes 4.41% to developed, 6.88% forest loss, 0.94% agricultural loss, 14.66% other differences, plus a wetland-difference category, and classification variation can contribute.
Map File Information
Download the four original Stephens County land-cover JPG maps in one ZIP: general land cover, forest and farmland, impervious/developed land, and 1985–2025 land-cover change.
- Printable Size: 2480×1754 pixels each
- Intended Use: screen reference, documents, classroom material, presentations, and map comparison
Related Maps
- Appling County Georgia Land Cover Map
- Atkinson County Georgia Land Cover Map
- Bacon County Georgia Land Cover Map
Sources and references
- MRLC Annual NLCD Data – official access point for Annual NLCD land-cover products and supporting data.
- USGS Annual NLCD Land Cover Classification – official explanation of the land-cover classification used for interpreting map classes.
- 2021 Stephens County Joint Comprehensive Plan – Georgia planning document covering the county’s forest land, farming settings, Toccoa-centered development, SR 17 corridor, and river-reservoir landscape.
- Stephens County Planning and Zoning – official county information for land-use regulations, rezoning, conditional use, and variance applications.
- UGA Extension – Stephens County – local public education and assistance in agriculture, horticulture, and related natural-resource topics.
Green Map creates custom-edited map images using open geographic data sources such as geoBoundaries, Natural Earth, OpenStreetMap, and government open data.
These maps are edited visual materials, not raw data files, and are provided for education, documents, presentations, and graphic reference.