Richmond County has one of the clearest urban-to-rural gradients in this Georgia map series. Developed land is the largest 2025 class at 34.84%, followed by forest at 29.68% and wetlands at 14.82%. Augusta’s dense urban surface dominates the north, wetland and water cover line the Savannah River side, and the southern half contains much more forest, grass, and agriculture. This Richmond County Georgia Land Cover Map shows those contrasts across the consolidated Augusta-Richmond County landscape.
The page includes four WebP views for land cover, vegetation, impervious surface, and the 1985–2025 endpoint comparison. Four original 2480 × 1754 JPG maps are available in one ZIP for urban-land studies, river context, lessons, and presentations.
Table of Contents
The impervious map makes Augusta’s urban footprint unmistakable
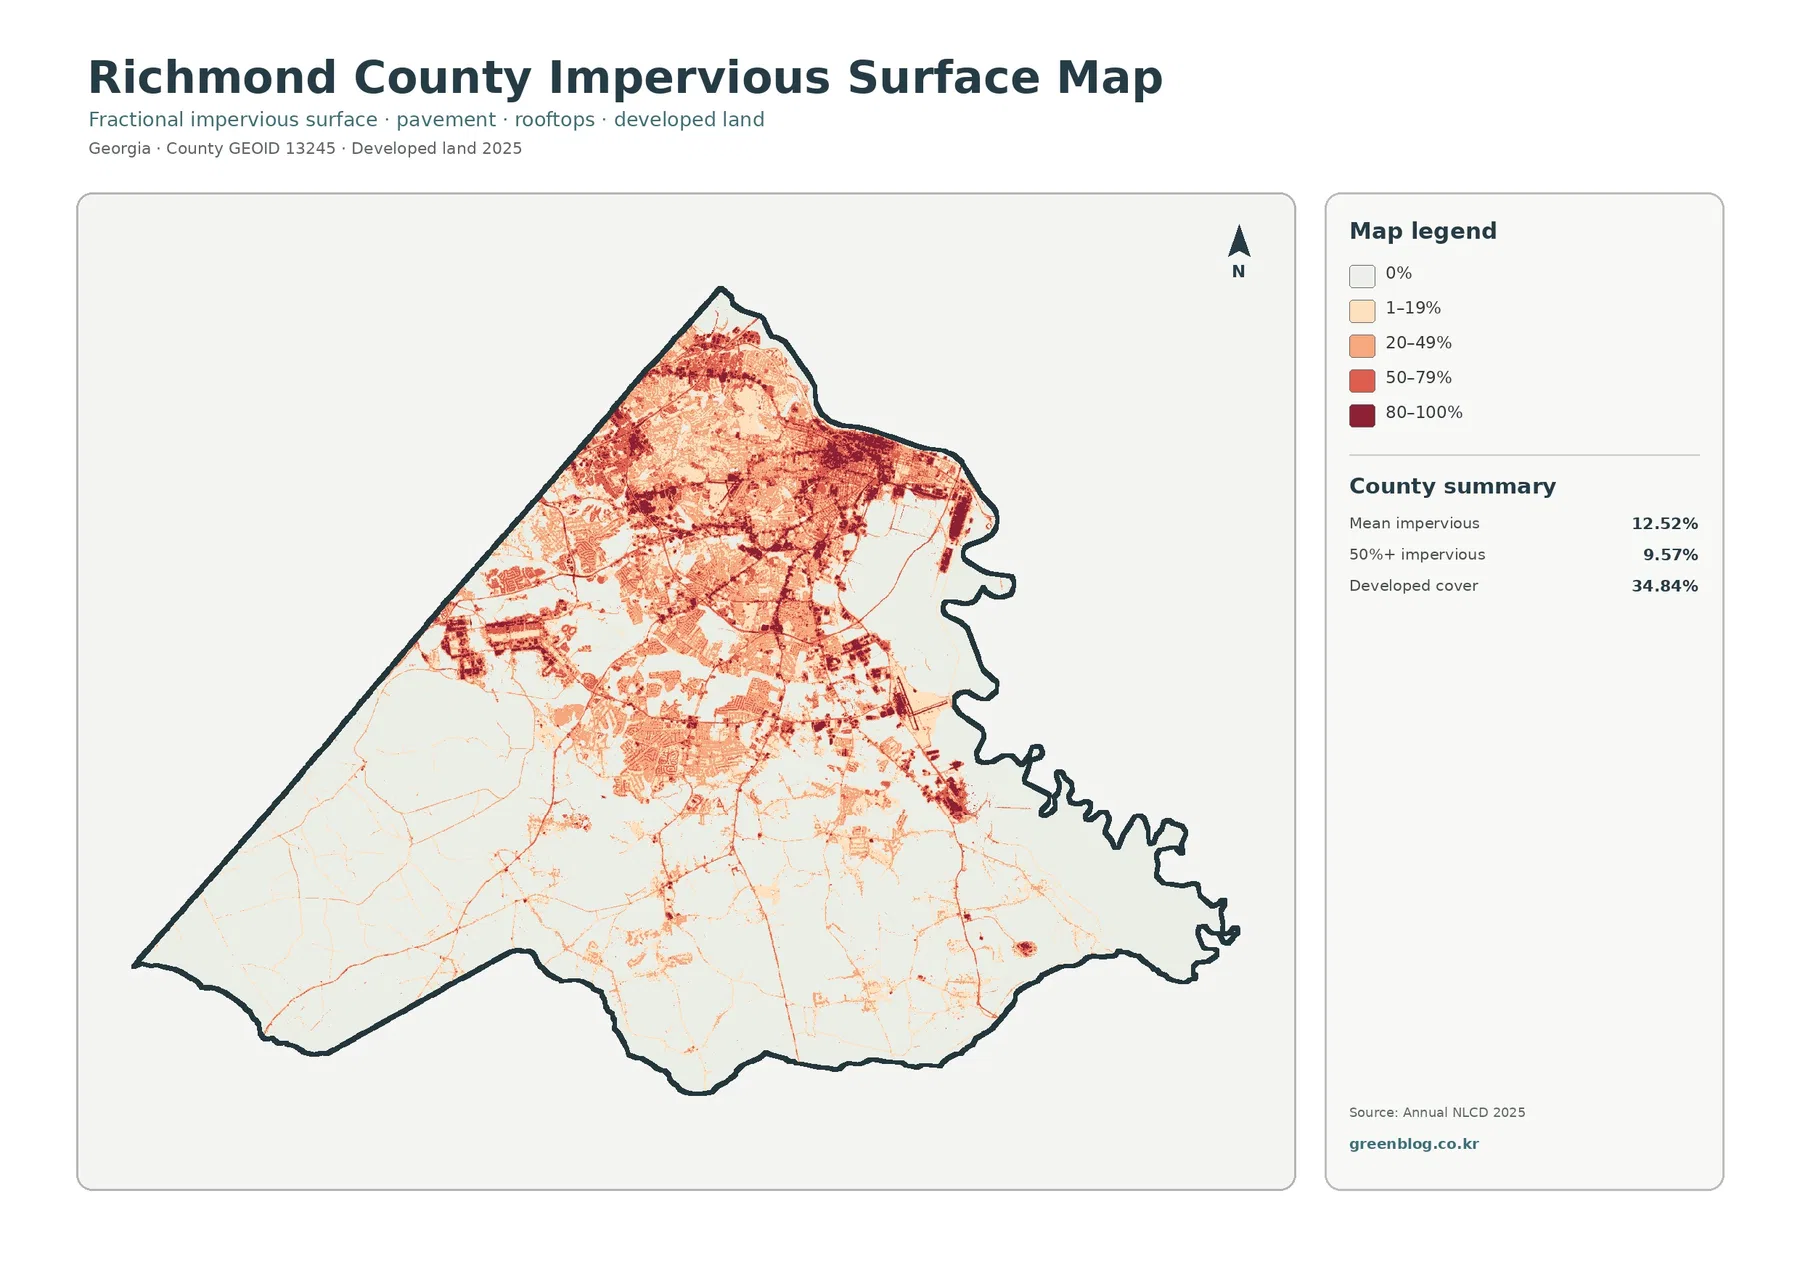
The northern third of the county contains an extensive web of medium and high impervious values. Cells in the 50–79% and 80–100% ranges occur across the main urban core rather than being confined to one small downtown. Roads, neighborhoods, commercial areas, institutions, and other built surfaces form a connected pattern that continues through much of northern Augusta.
Mean impervious cover is 12.52%, and 9.57% of Richmond County reaches 50% impervious surface or higher. Those values are high for a Georgia county with rural land. Developed land is broader still at 34.84% because developed classes can include yards, trees, grass, and exposed ground in addition to pavement and rooftops.
Augusta-Richmond County is a consolidated government, but the land-cover map is still a surface map
Augusta’s official history states that the City of Augusta and Richmond County consolidated in 1996. The current comprehensive plan therefore treats Augusta-Richmond County as one planning area for growth, transportation, land use, public facilities, and natural resources. That government structure helps explain why the map is best read as one countywide urban-rural system.
Augusta Planning and Zoning manages legal land use separately. A red raster cell identifies developed surface, not a residential, commercial, industrial, military, or other zoning category.
Developed land leads the 2025 county summary at 34.84%
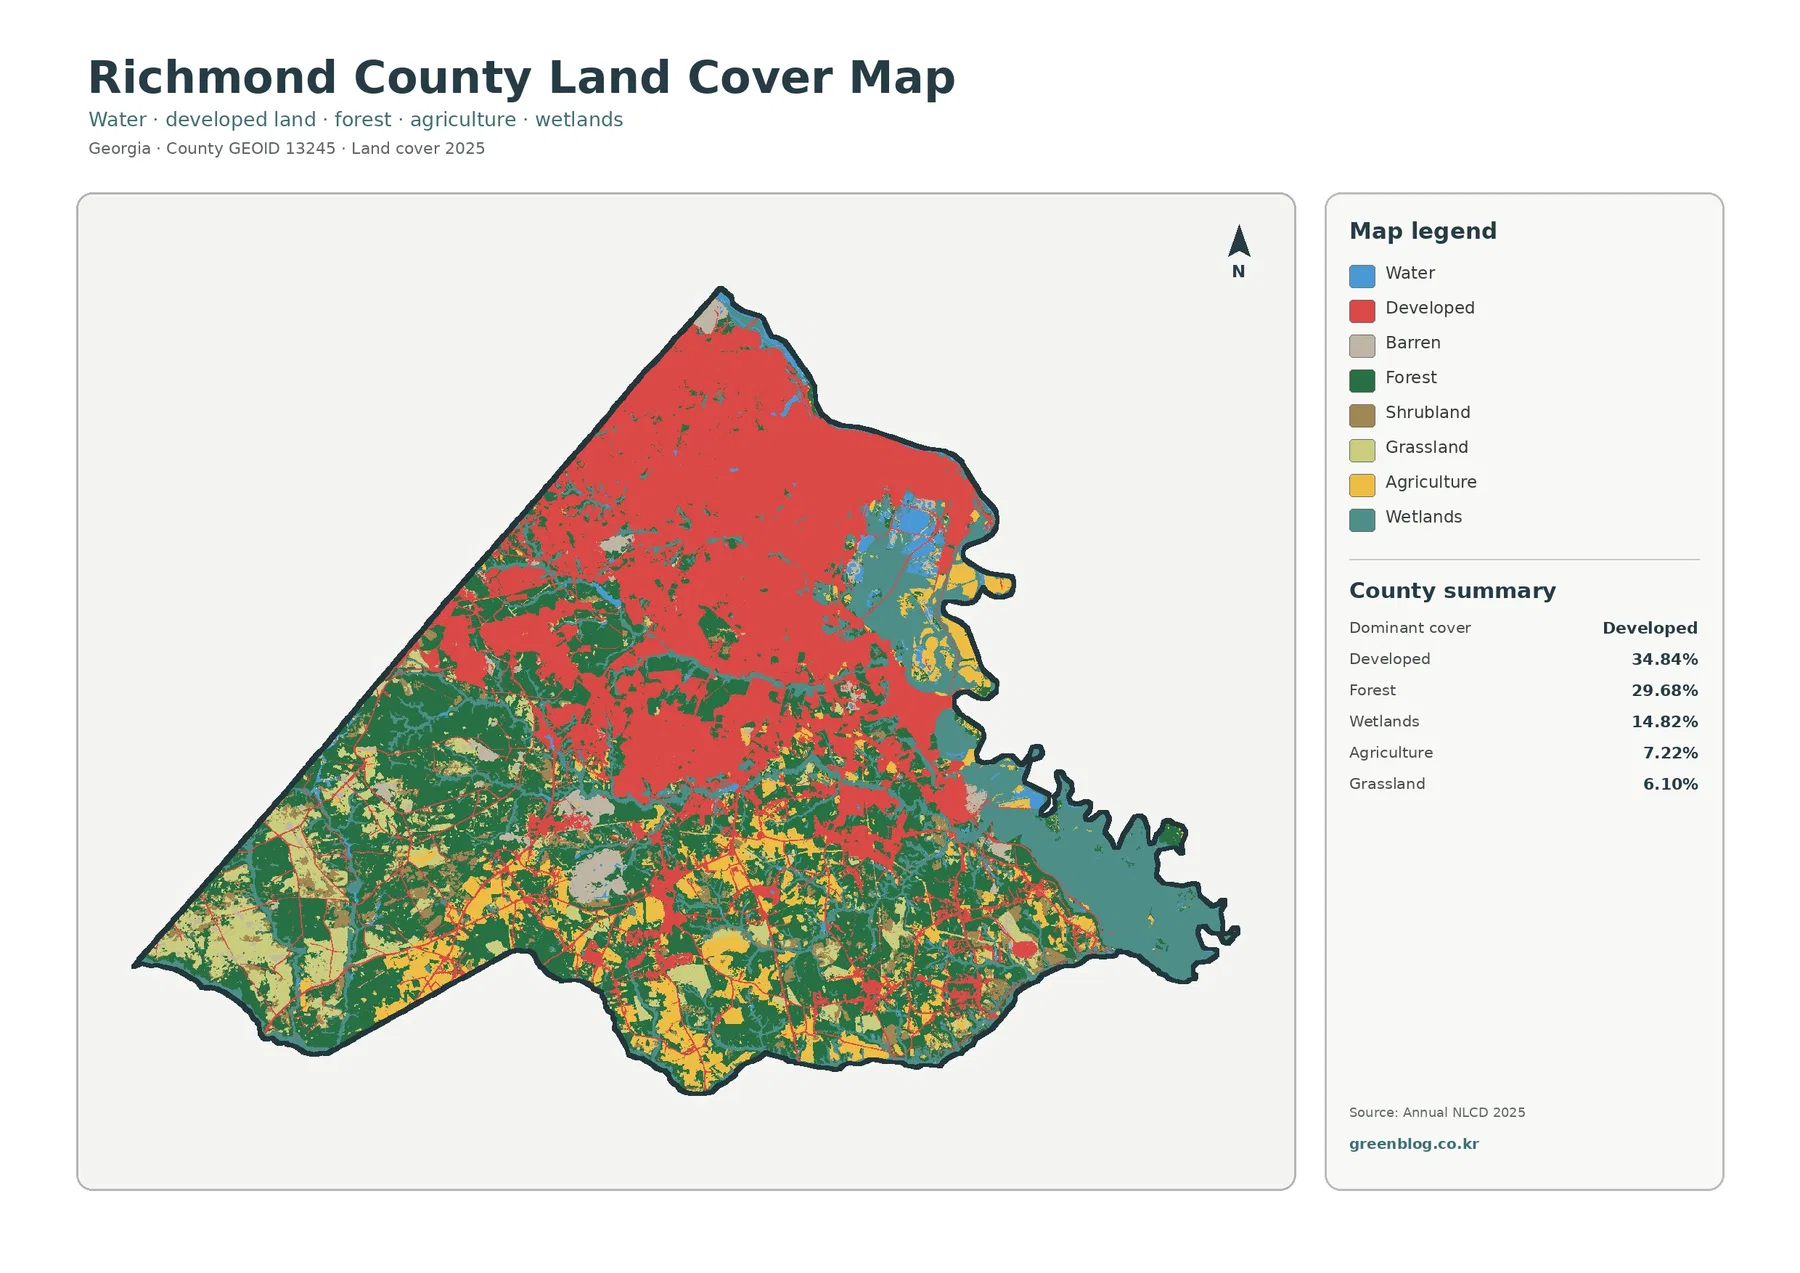
Red developed cover dominates the north and remains common through the center. The pattern is much more continuous than the small-town clusters seen in rural counties. Even so, development does not fill the county: broad green forest, teal wetlands, yellow agriculture, and light-green grass appear across the southern half and along the eastern edge.
Forest is the second-largest class at 29.68%. Larger wooded blocks occur in the southwest and west-central portions, with additional tree cover around roads and neighborhoods farther north. The county is therefore not simply urban in the north and empty in the south; forest remains an important surface throughout the transition zone.
Wetlands account for 14.82%, agriculture 7.22%, and grassland 6.10%. Shrubland adds 3.54% and open water 1.95%. Those proportions make Richmond County unusually mixed: a large urban footprint coexists with a sizeable river-wetland system and a southern landscape where forest and rural open cover remain common.
Savannah River wetlands form a broad natural edge beside the city
The eastern side of the county is visually different from both the Augusta core and the wooded southwest. Teal wetland cover follows the winding edge in broad bands, with blue water appearing along the same side. Augusta Water confirms the Savannah River as a major local water source, and official city materials place Augusta along the river.
Wetlands cover 14.82%. Broad teal areas occupy the east and southeast, and smaller wet features reach into developed parts of the northeast, placing hard surfaces close to river-edge natural cover.
Open water is only 1.95%, so teal should not be interpreted as exposed river surface. Wetlands can include saturated soils and vegetation. Exact river channels, floodplains, regulatory wetlands, and levee or shoreline limits require dedicated hydrography and legal data rather than this 30-meter land-cover raster.
The vegetation view reveals a much greener southern county
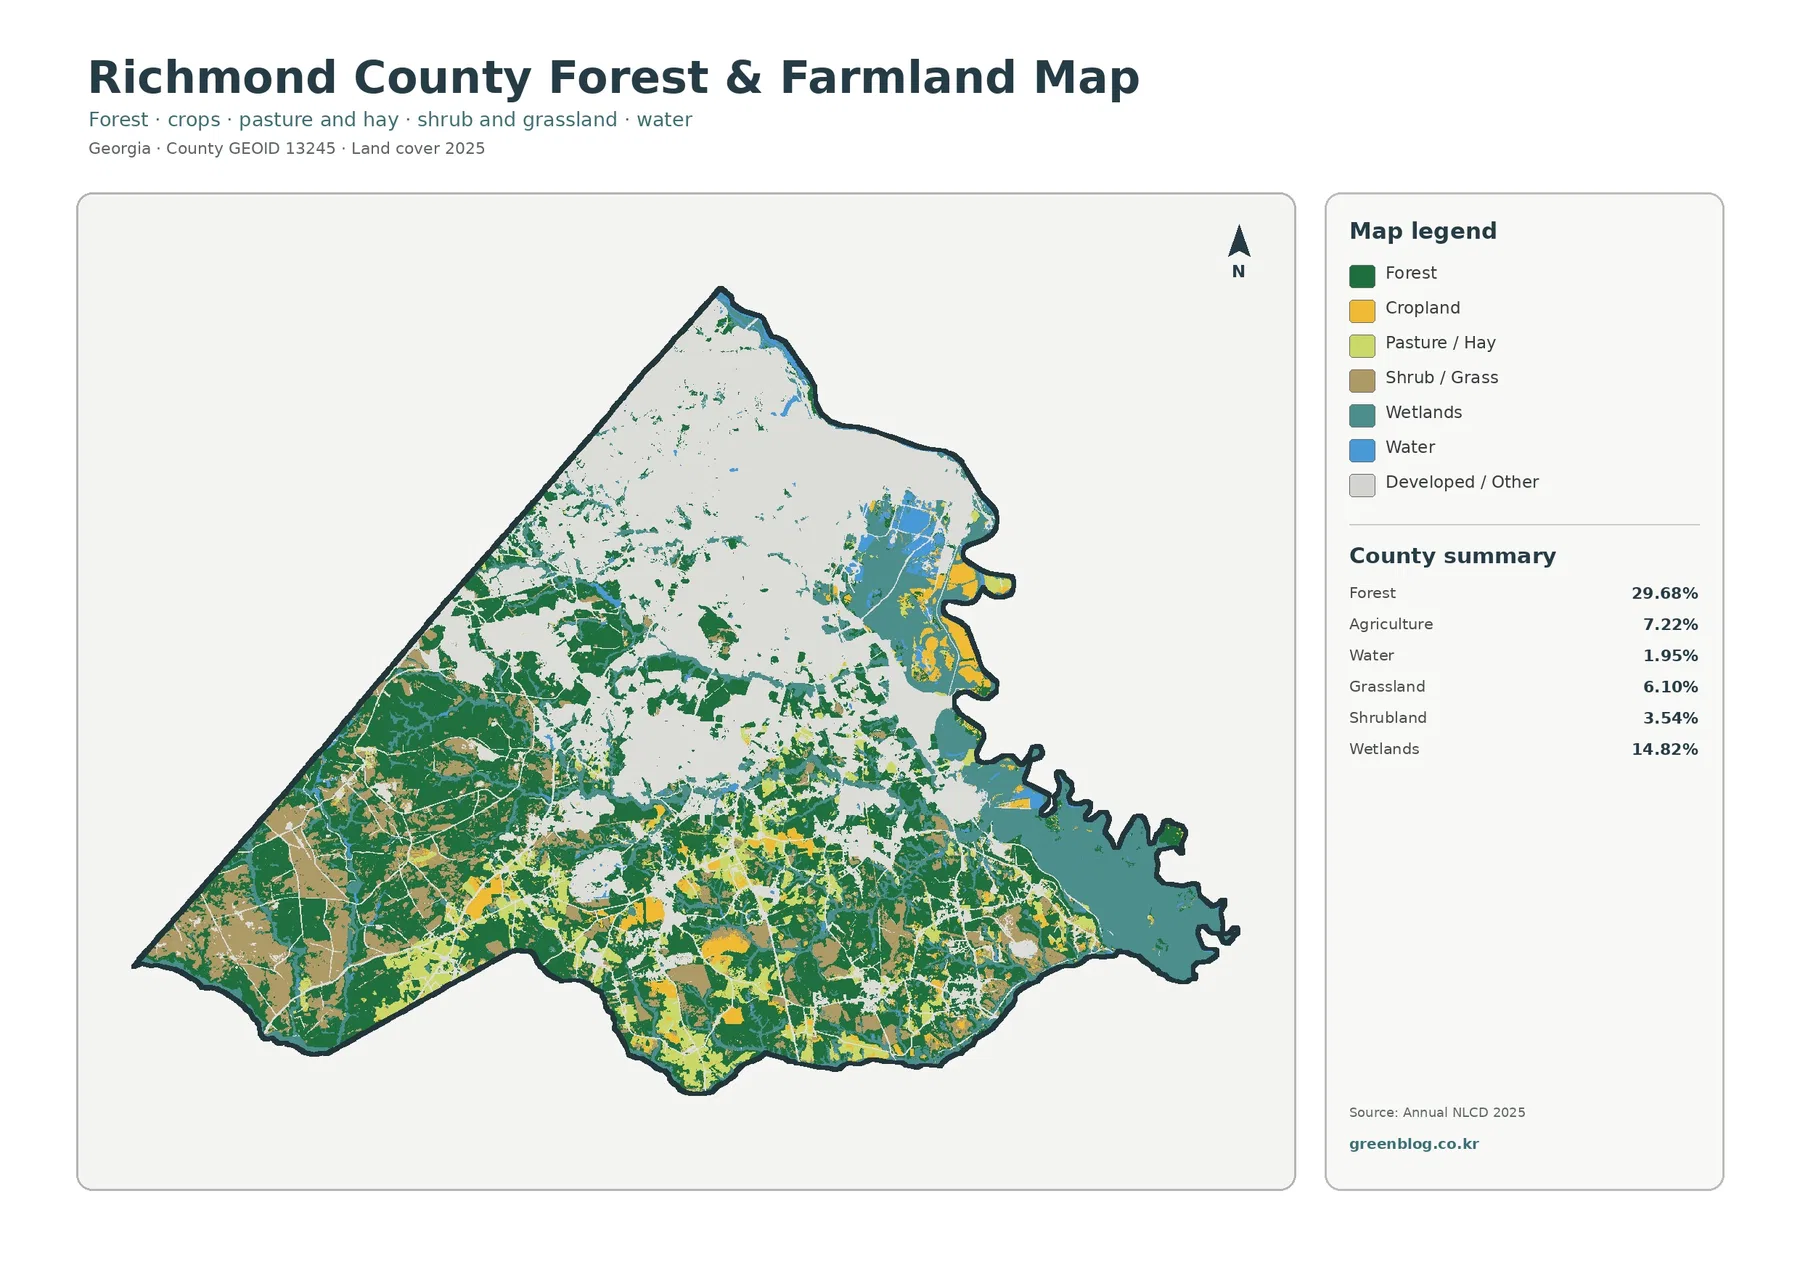
Once developed cover is muted, the southwest stands out as one of the county’s largest wooded areas. Forest also runs through the center and breaks the urban surface into smaller pieces near the transition to the southern half. Agriculture and grassland become more visible in the south and southeast, where larger open blocks appear between woods and wetlands.
Agriculture covers 7.22%, so Richmond County is not primarily a farm county. Still, the southern landscape contains enough agricultural and grass cover to matter when comparing the consolidated county as a whole. A visitor looking only at downtown Augusta would miss this rural part of the land-cover pattern.
UGA Extension Richmond County provides Agriculture and Natural Resources assistance, including soil and water testing and landscape guidance, fitting a county that contains both dense urban development and rural land.
Large transportation and institutional surfaces add distinctive hard-surface shapes
Beyond the northern street network, the impervious map contains large geometric hard-surface clusters in central and eastern areas. Augusta-Richmond County owns Augusta Regional Airport at Bush Field, providing one verified example of major paved infrastructure in the county.
The raster cannot trace an airport, military installation, or industrial parcel boundary. Precise facility limits require official parcel or facility mapping.
The 1985–2025 comparison records 8.79% classified to developed
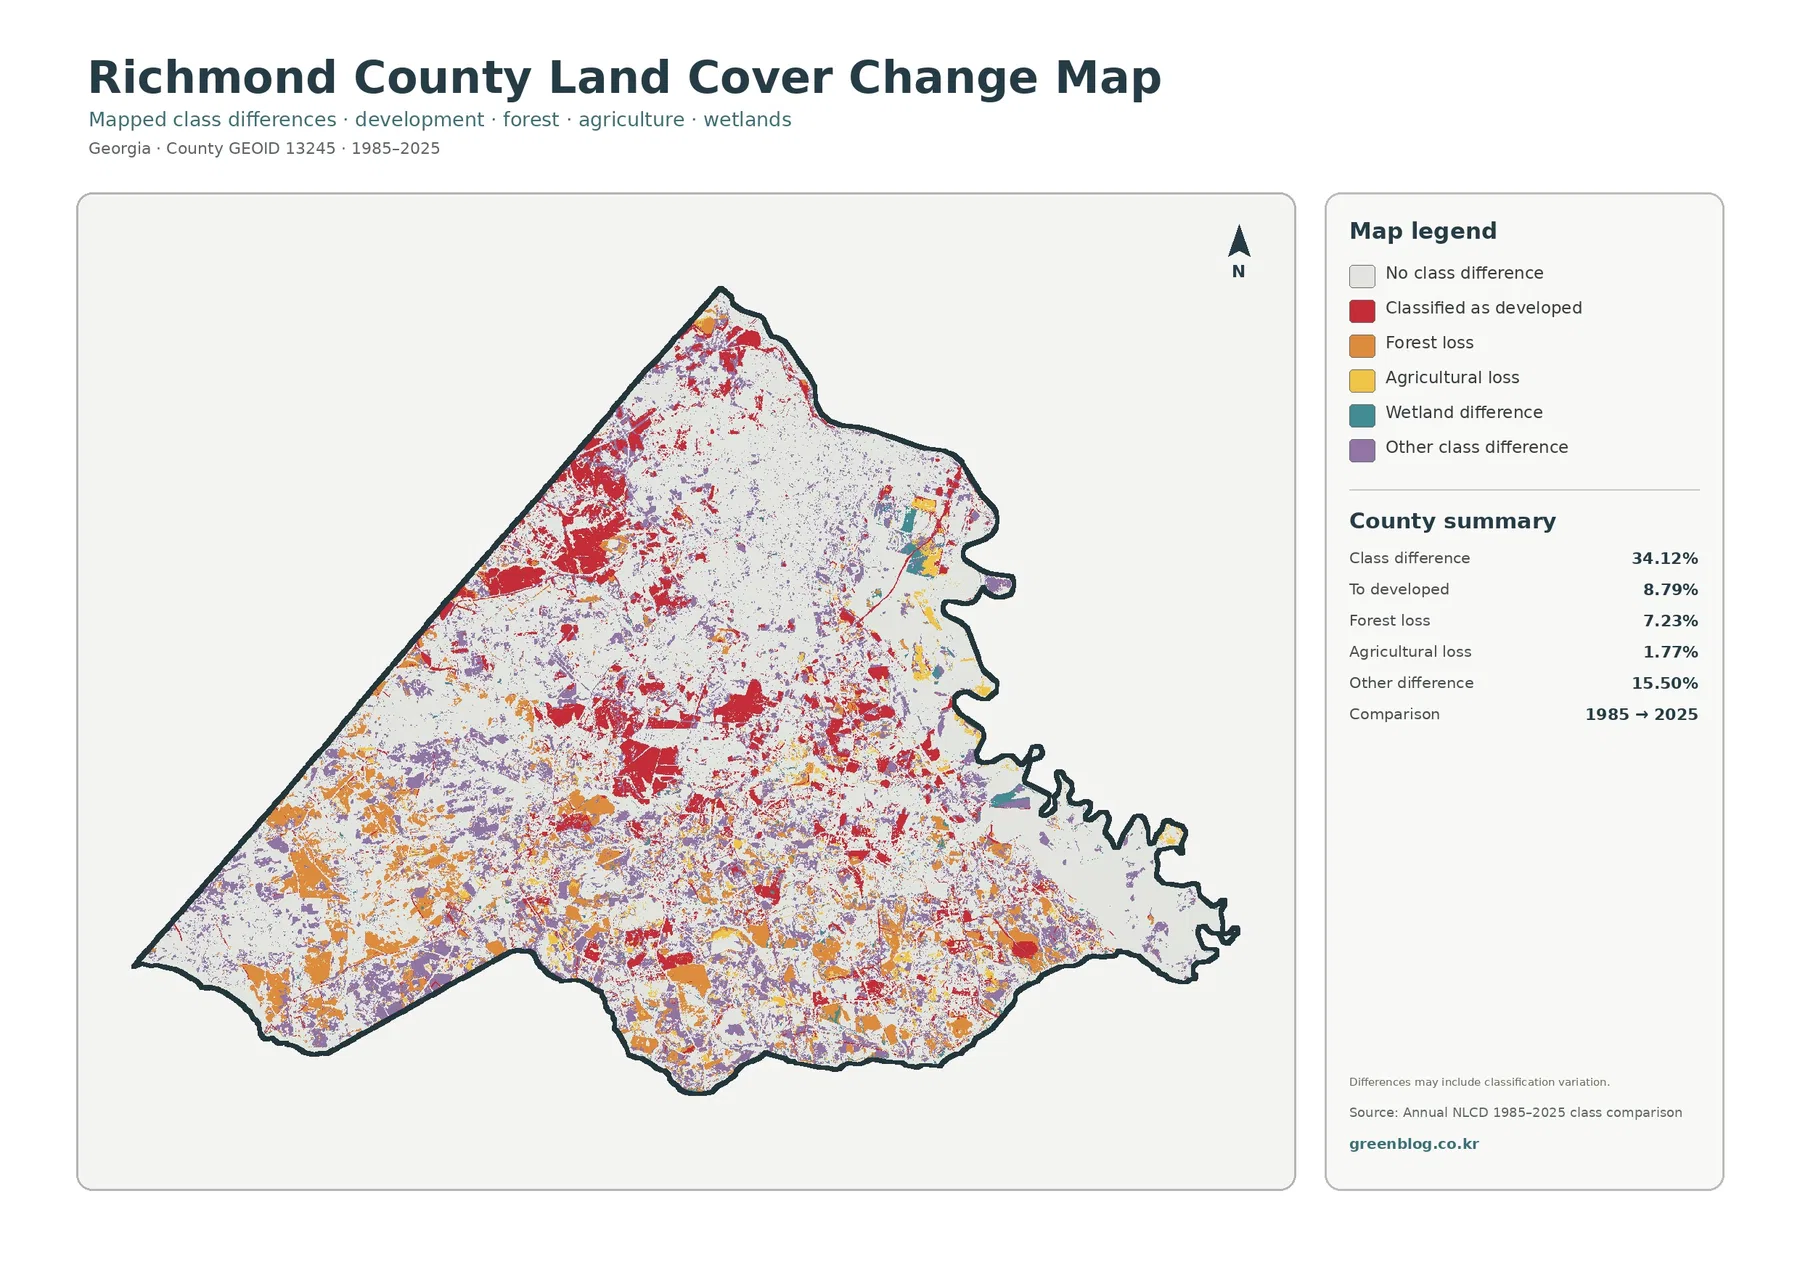
The total endpoint class difference is 34.12%. This number counts cells assigned different classes in 1985 and 2025. It is not the percentage of Richmond County that urbanized, and it cannot be added to the current 34.84% developed share to reconstruct an earlier or future city footprint.
The printed summary lists 15.50% other difference, 8.79% classified to developed, 7.23% forest loss, and 1.77% agricultural loss. Developed-change red is widespread around the northern urban edge and appears in multiple central corridors. Forest-loss orange and other-difference purple extend much farther into the southern and southwestern landscape.
Wetland difference appears in the legend without its own printed percentage. The missing value should not be reconstructed by subtraction and presented as an official wetland-change rate. Intermediate imagery, development records, and land-management information are needed before assigning a cause to a specific patch.
Thirty-meter land cover cannot replace zoning, parcel, or wetland records
Annual NLCD assigns one predominant class to each 30-meter cell, so urban blocks, field edges, ditches, roads, trees, and mixed parcels can look generalized.
Choosing the four JPG maps for Richmond County
Use the 2025 countywide map first when the goal is to show Augusta’s developed north, the Savannah River wetland edge, and the greener south together. The vegetation view is better for examining southern forest, agriculture, and grass cover. Choose the impervious map for urban intensity and major hard-surface clusters, and reserve the endpoint map for a separate 1985–2025 change discussion.
Each JPG measures 2480 × 1754 pixels and suits reports, lessons, and presentations. Test a proof before large-format printing because the package does not mark the files as A3 high-resolution assets.
Frequently Asked Questions
What is the largest land-cover class in Richmond County?
Developed land is the largest class in the supplied 2025 summary at 34.84%. Forest follows at 29.68% and wetlands at 14.82%, creating a strong contrast between the Augusta urban area and the county’s wooded and river-edge landscapes.
Why is Richmond County’s mean impervious cover 12.52%?
Augusta contains a large, connected urban footprint with neighborhoods, roads, commercial areas, institutions, and other paved surfaces. About 9.57% of the county reaches at least 50% impervious cover.
Does the 34.12% endpoint difference equal urban growth?
No. It counts all cells with different class labels in 1985 and 2025. The summary separately lists 8.79% classified to developed, 7.23% forest loss, 1.77% agricultural loss, and 15.50% other difference.
Sources and Reference Data
- MRLC Annual NLCD Data – official access to annual land-cover and comparison products
- USGS Annual NLCD Land Cover Classification – definitions for developed land, forest, wetlands, agriculture, and related classes
- Augusta-Richmond County – Augusta Regional Airport at Bush Field – official county-owned airport infrastructure reference
- Augusta-Richmond County Comprehensive Plan – official planning context for land use, transportation, growth, and natural resources
- Augusta Water – official Savannah River water-source and local water-resource information
- UGA Extension – Richmond County Agriculture & Natural Resources – local soil, water, landscape, and natural-resource assistance
Map File Information
The ZIP contains four original JPG maps for comparing Richmond County's 34.84% developed cover, 29.68% forest, Augusta's urban footprint, Savannah River wetlands, impervious surfaces, and 1985–2025 class differences.
- Included Files: Use only the versions confirmed in the article and supplied images
- File Type: Use the confirmed download contents
- Intended Use: Printing, education, presentations, and map-based projects
Related Maps
- Appling County Georgia Land Cover Map
- Atkinson County Georgia Land Cover Map
- Bacon County Georgia Land Cover Map
Green Map creates custom-edited map images using open geographic data sources such as geoBoundaries, Natural Earth, OpenStreetMap, and government open data.
These maps are edited visual materials, not raw data files, and are provided for education, documents, presentations, and graphic reference.