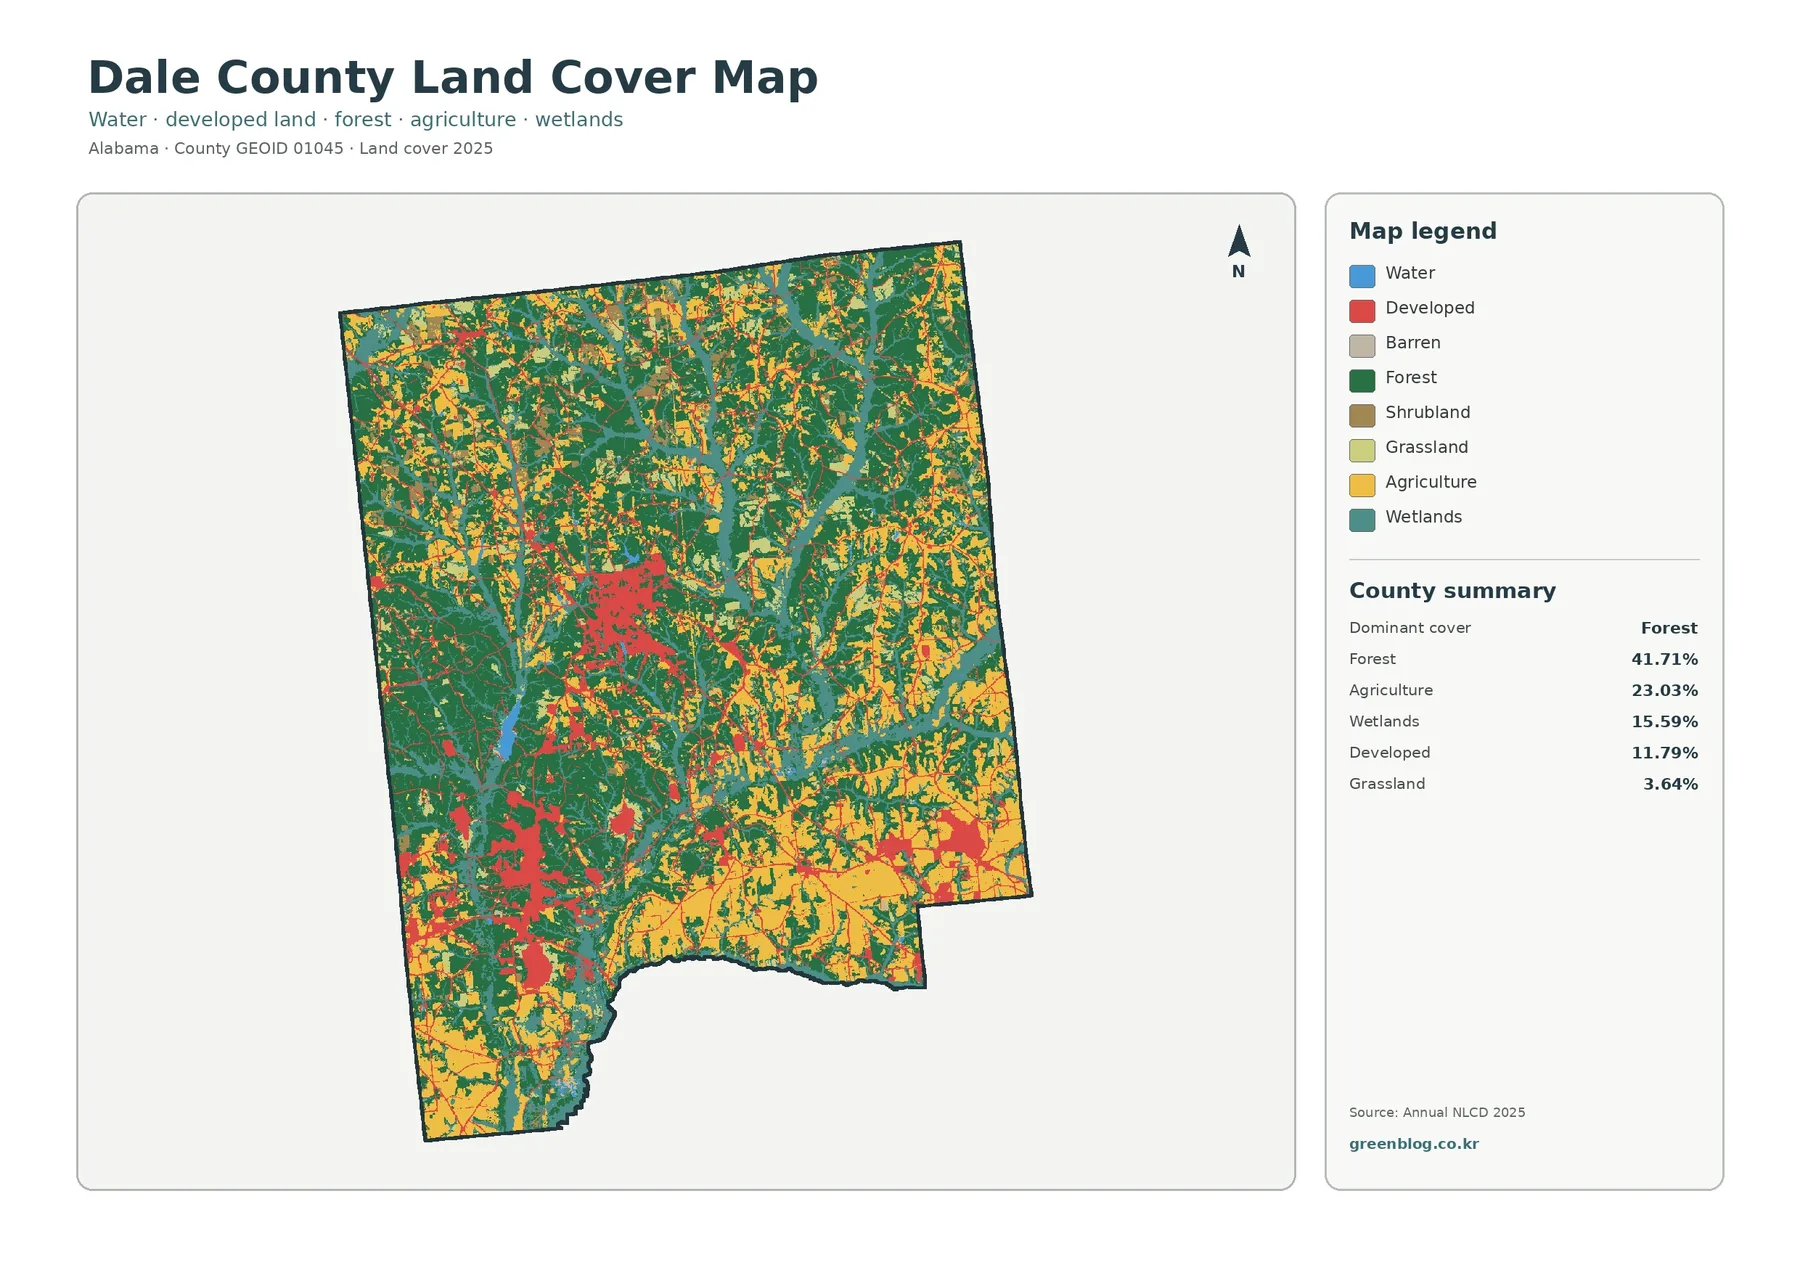
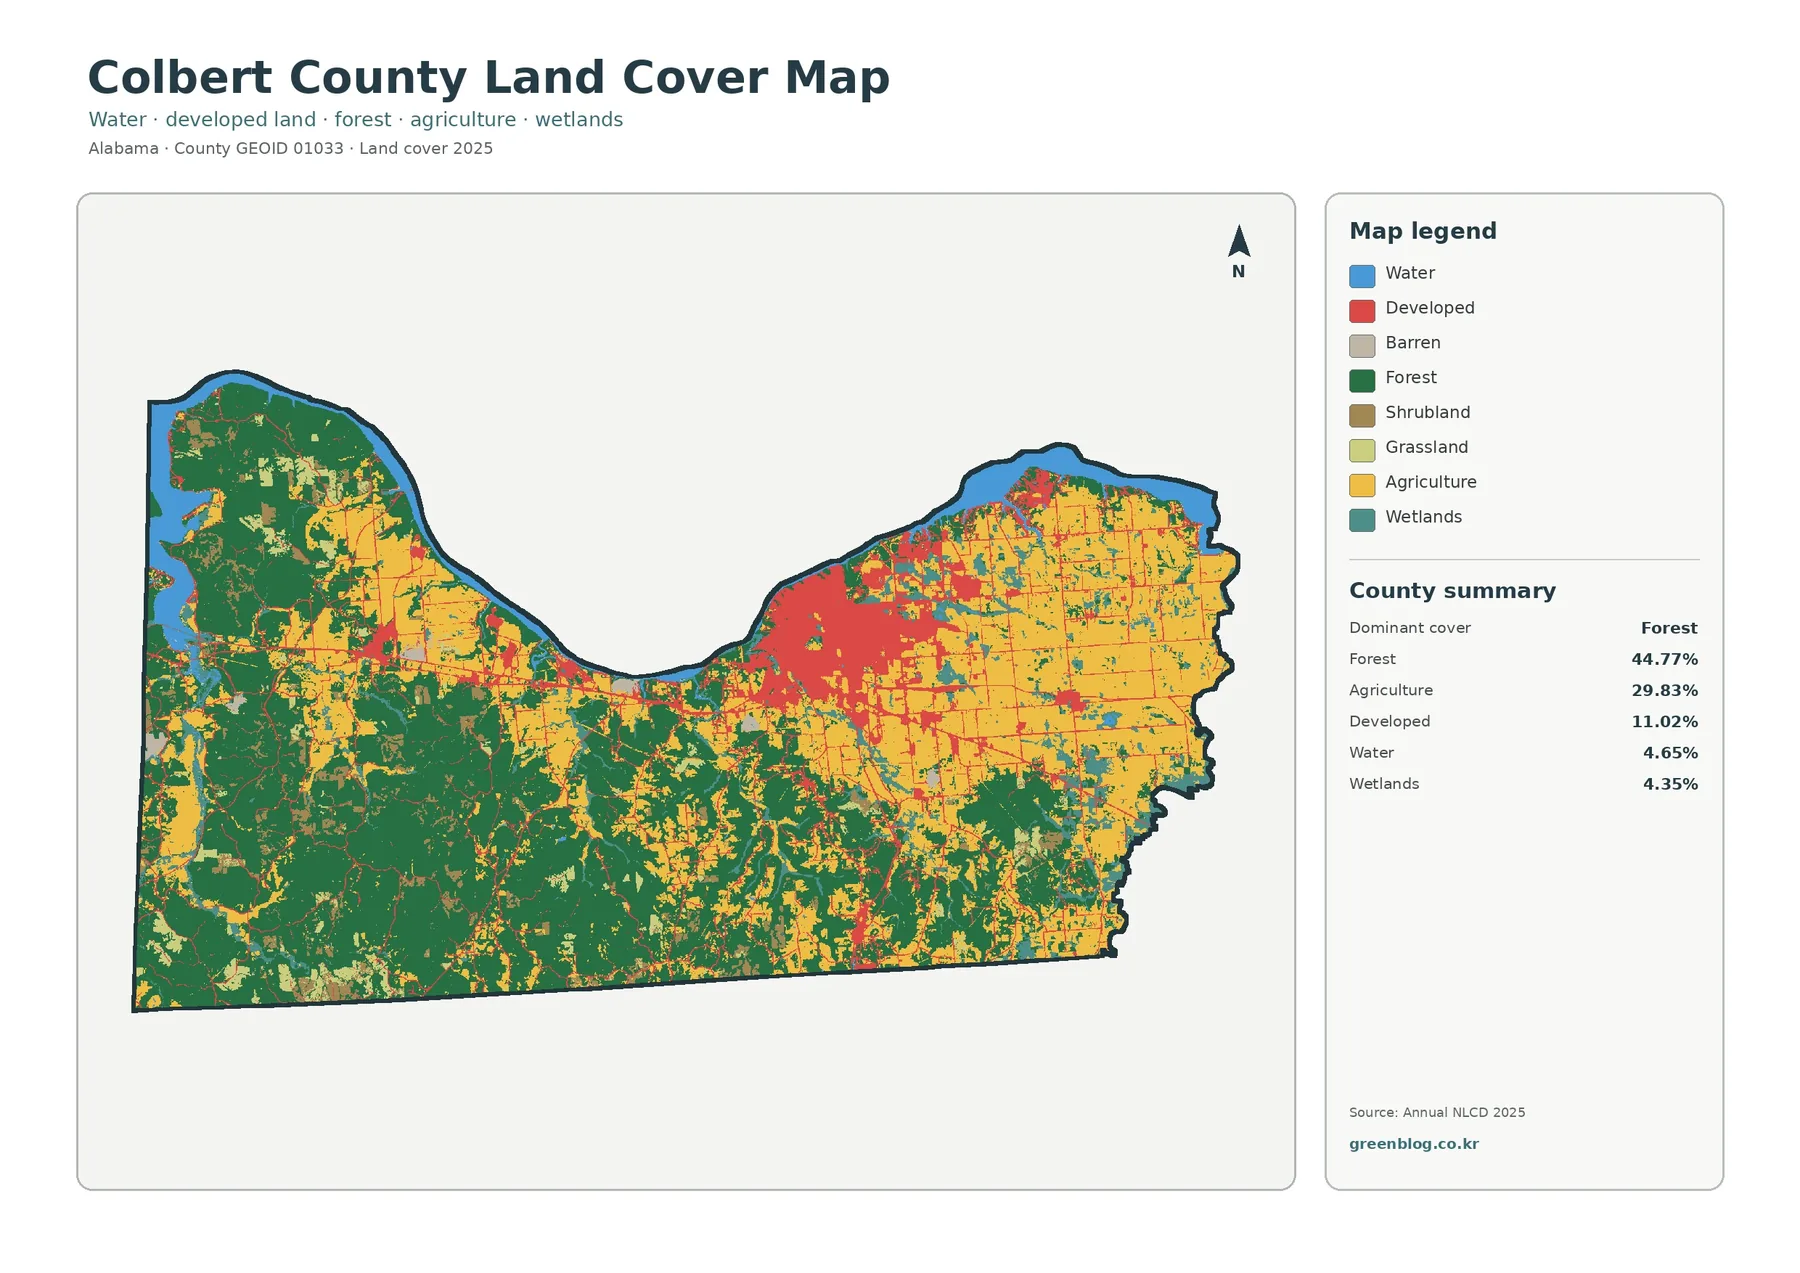
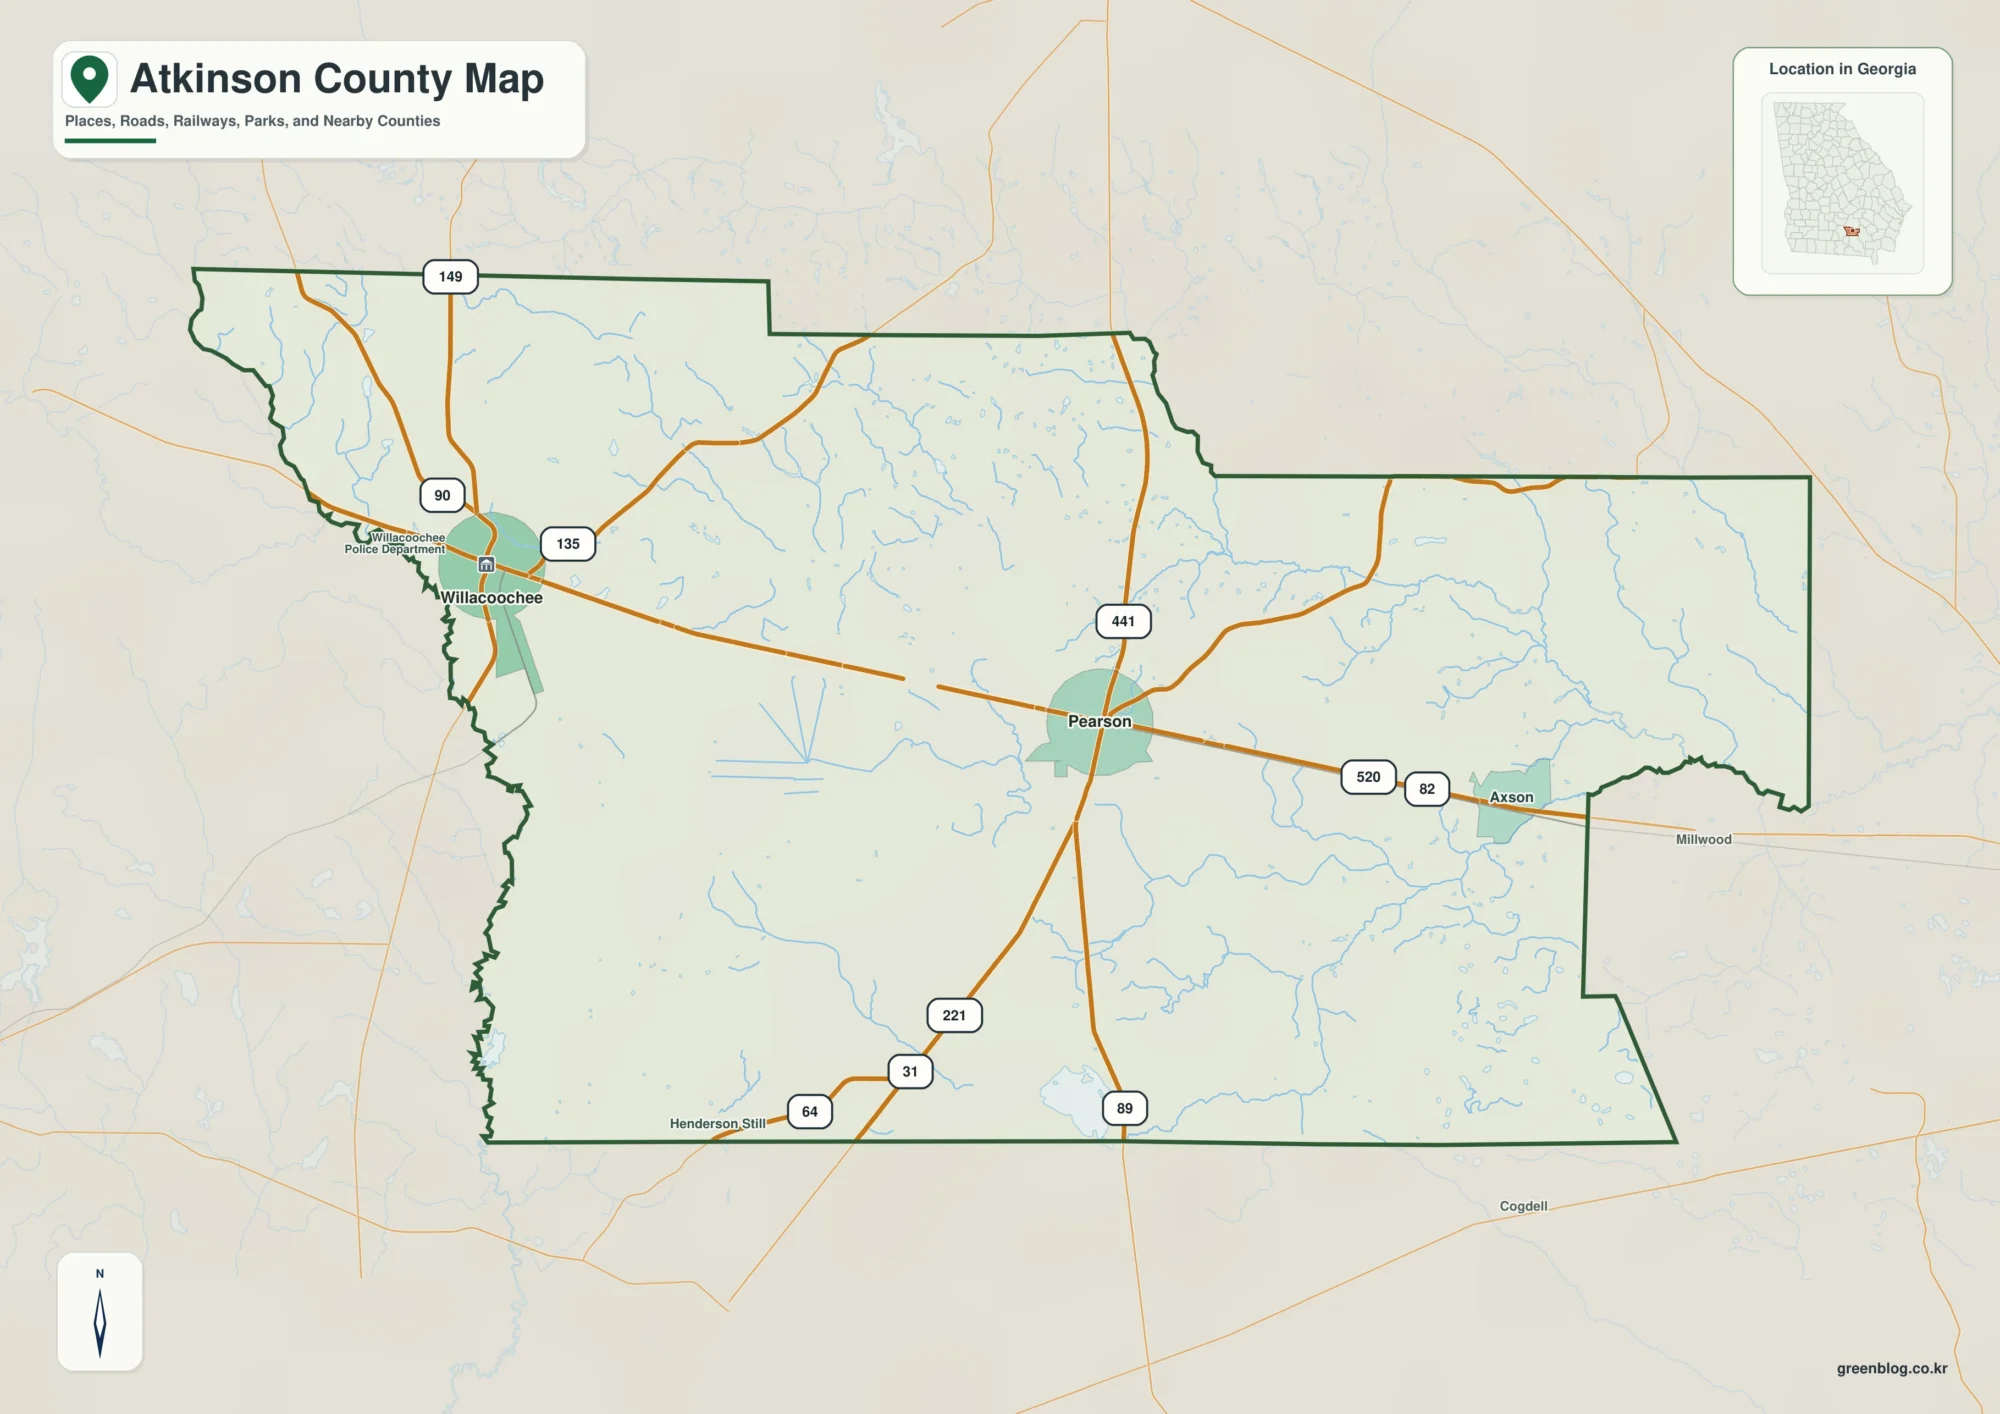
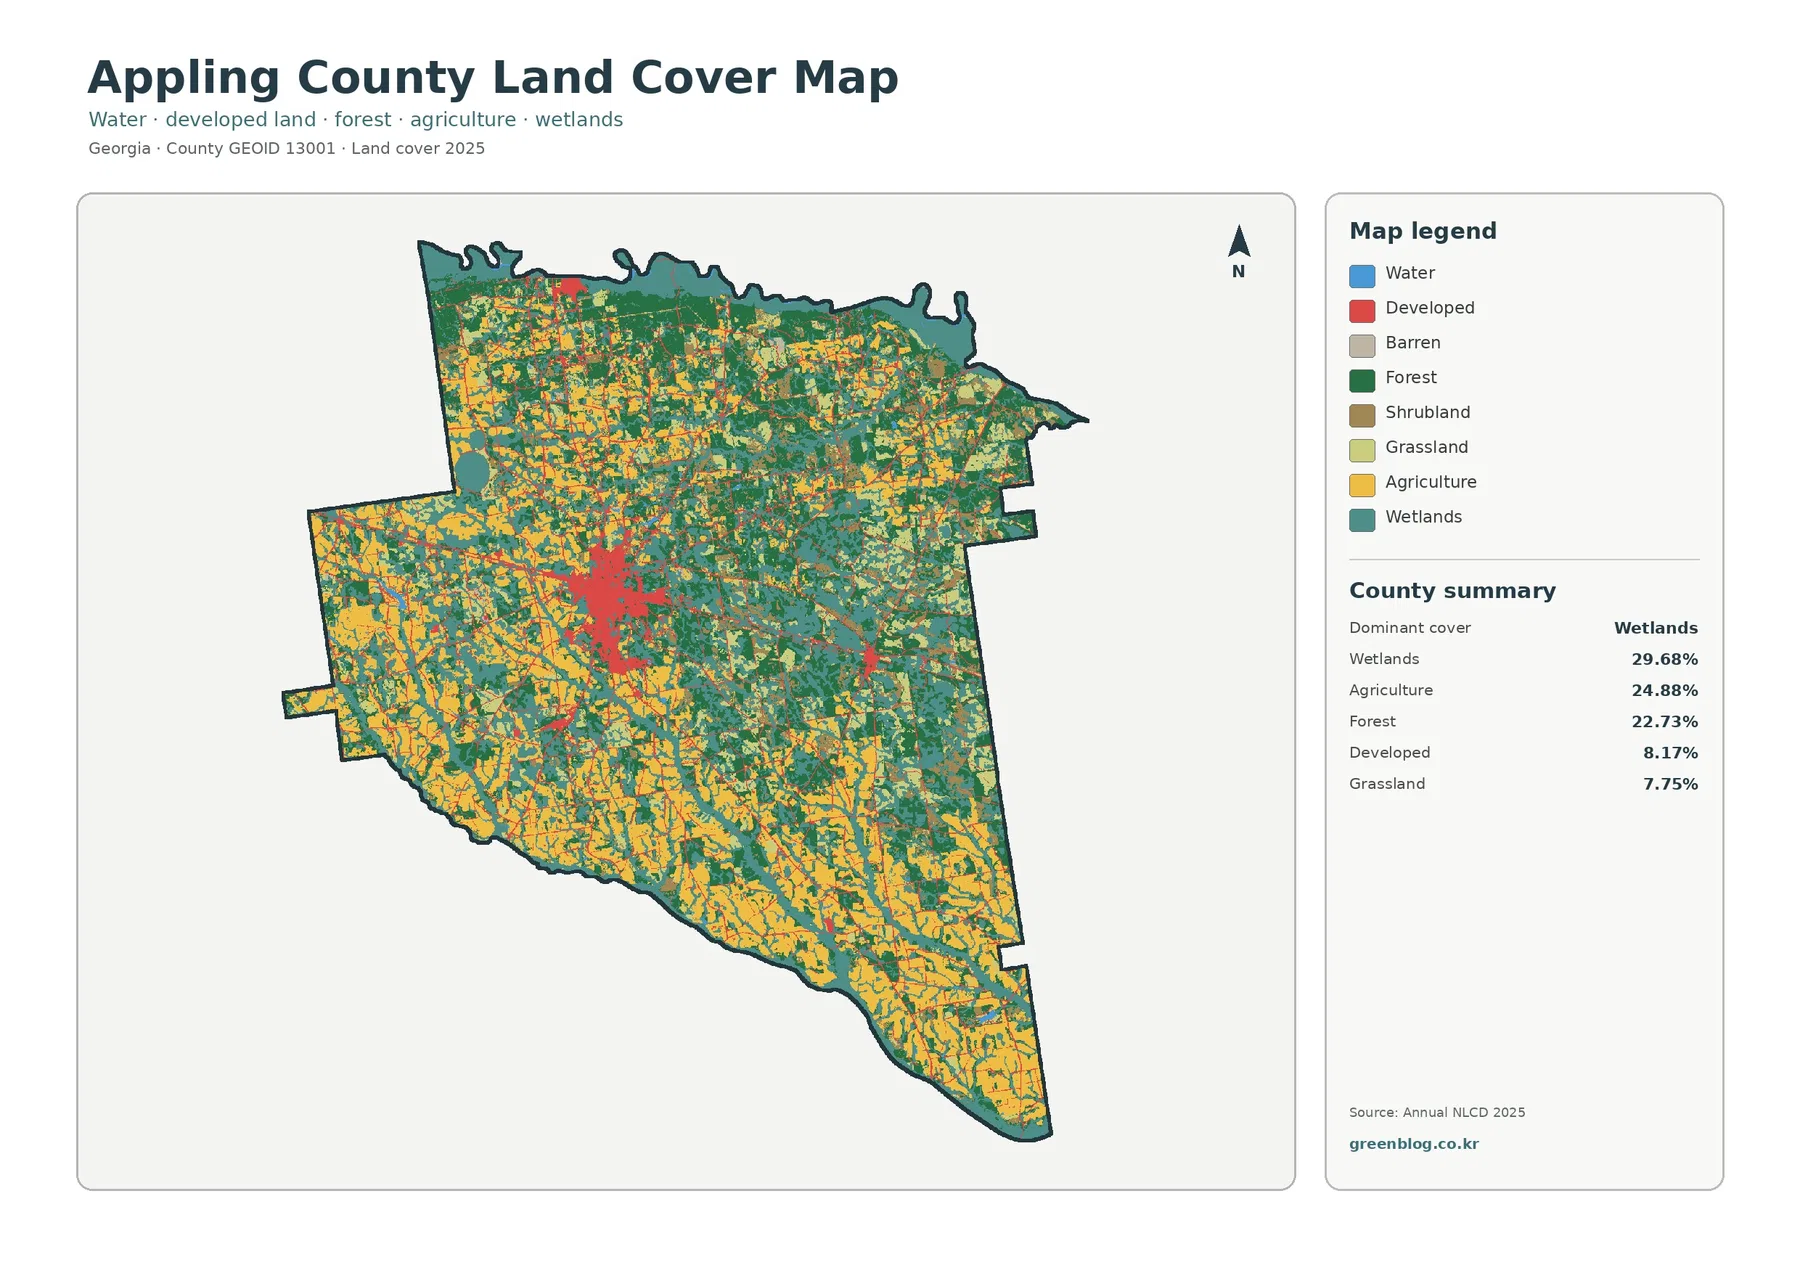
Pierce County is a wetland-and-farm county before it is an urban one. Wetlands cover 32.86% of the supplied 2025 classification, agriculture 25.08%, forest 22.89%, and developed land 9.07%. The largest built concentration sits around Blackshear in the south-central county, while smaller northeastern centers are separated by broad rural cover. This Pierce County Georgia Land Cover Map shows how wet ground, working land, woodland, and small towns share the county.
The page includes four WebP views for land cover, vegetation, impervious surface, and the 1985–2025 endpoint comparison. Four original 2480 × 1754 JPG maps are available in one ZIP for county profiles, watershed lessons, rural-land comparisons, and presentations.
Table of Contents
Wetlands are the largest class and spread well beyond one river edge
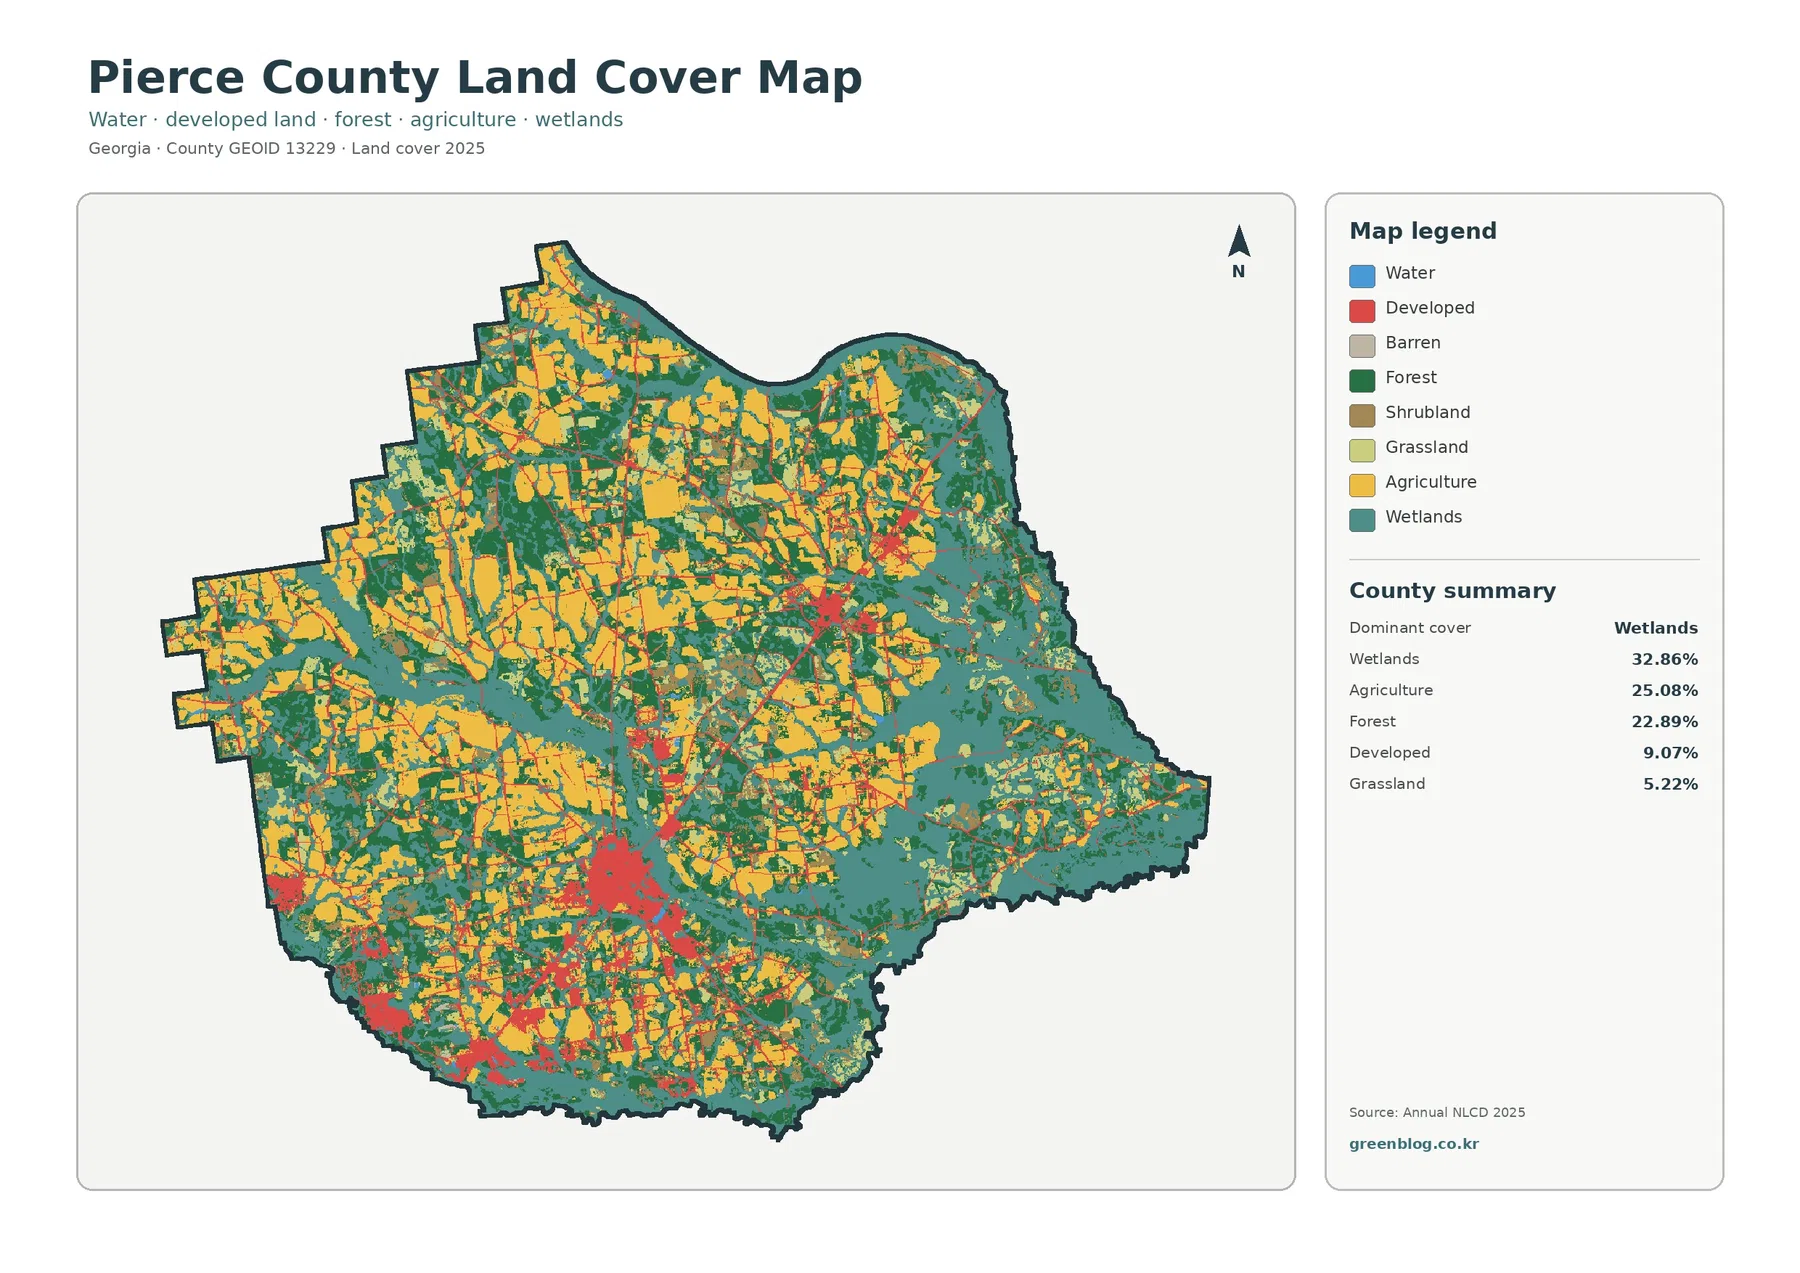
Wetlands account for 32.86%, the largest share in the county. Teal cover is broad across the eastern side and appears in long bands through the center, with additional wet areas in the southwest. The pattern is distributed enough that it cannot be reduced to one riverbank or one corner of the county.
Pierce County’s official website says the Alabaha River winds through the county, and the 2022 comprehensive plan lists the Satilla, Little Satilla, and Alabaha watersheds among natural resources to protect. That official context helps explain why wetland and drainage-related cover is so prominent. The raster does not label individual waterways, however, so a teal band should not be assigned to a named river from color alone.
Open water covers only 0.36%. That small percentage is a reminder that wetlands and exposed water are different classes. A wetland cell may include saturated ground and vegetation rather than an open pond or channel, and narrow waterways can be generalized by the 30-meter grid.
Blackshear is the main hard-surface center in an otherwise rural landscape
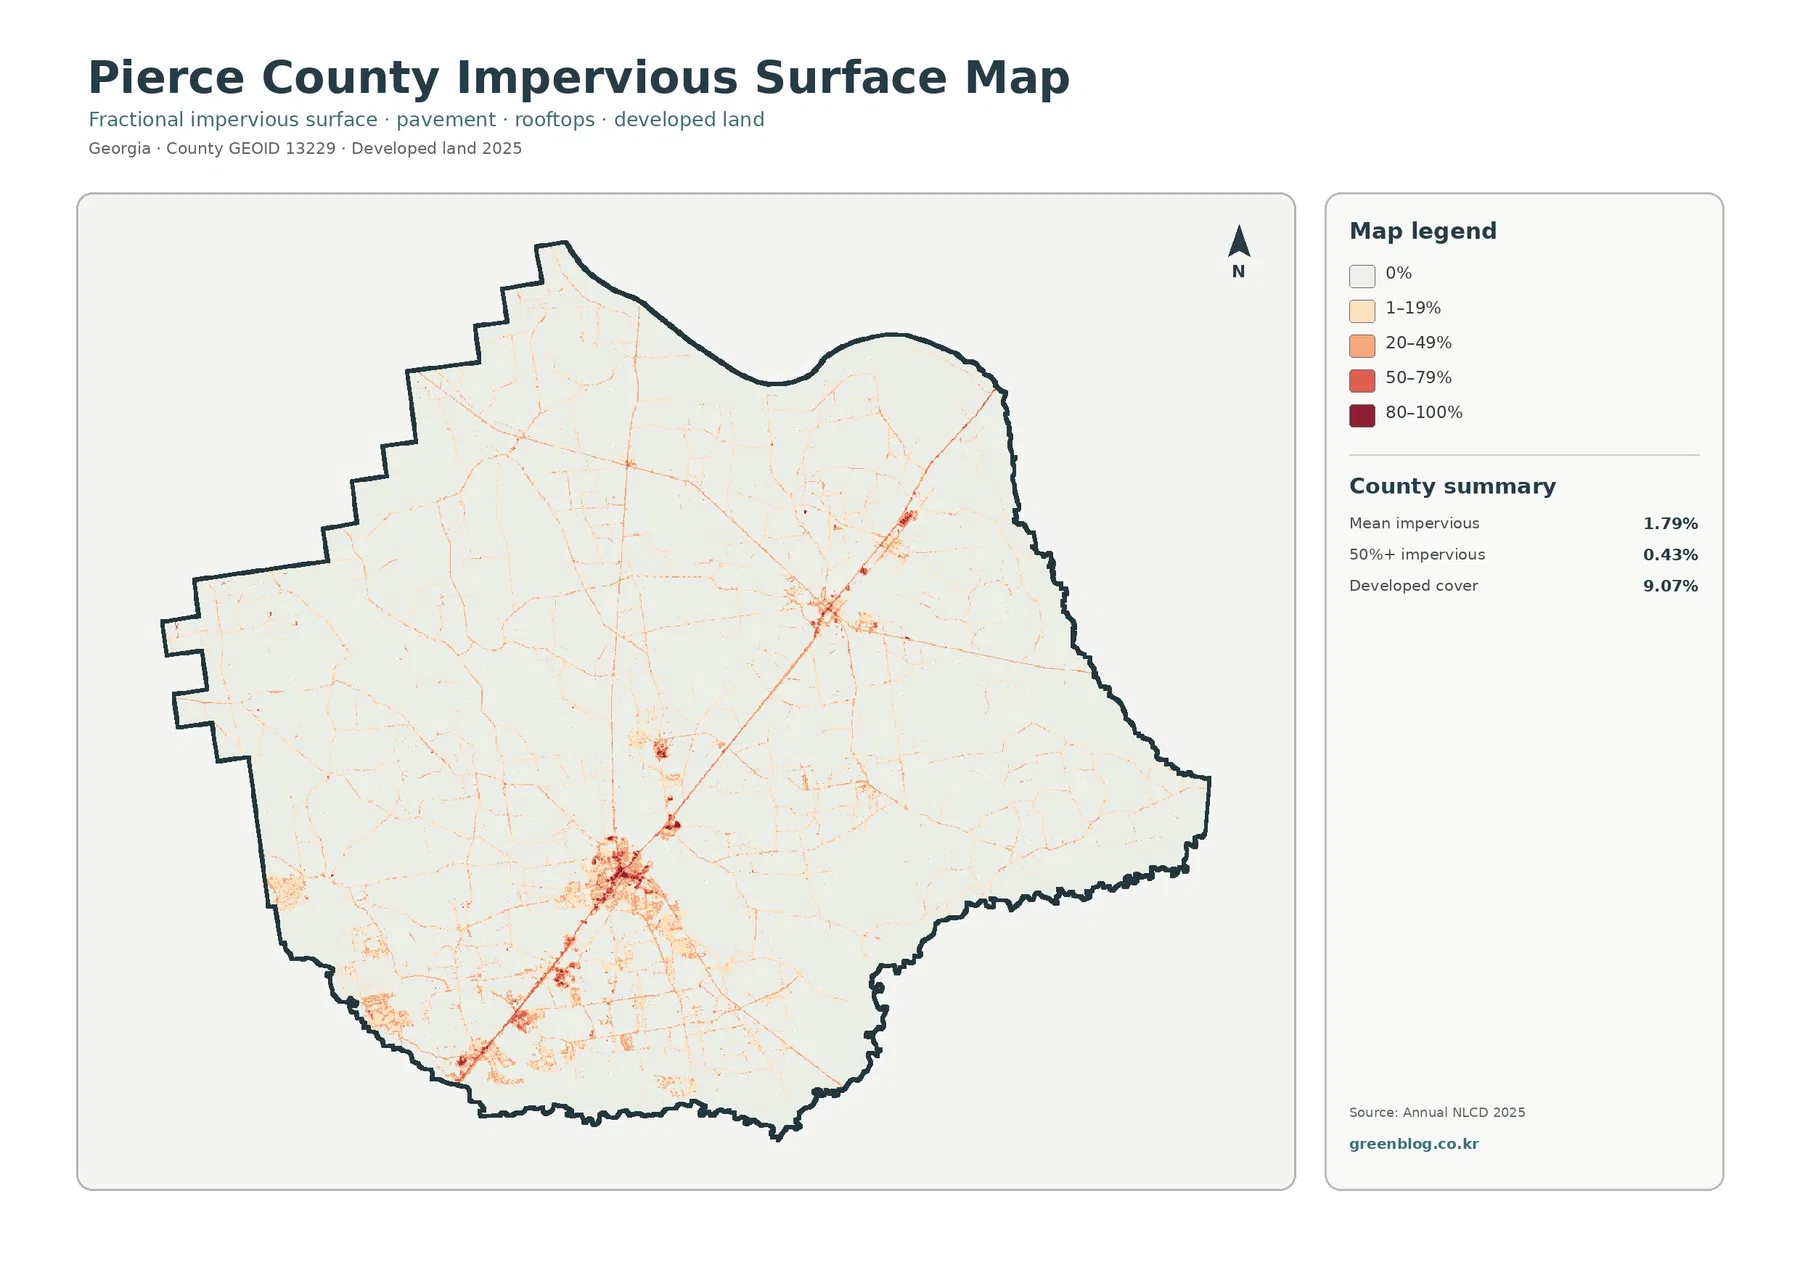
The strongest impervious cluster sits in the south-central county. Pierce County identifies Blackshear as the county seat, which gives this concentration a clear local reference. Darker hard-surface cells occupy the core, while lighter values spread outward through neighborhoods and along several road-shaped lines.
Mean impervious cover is 1.79%, and only 0.43% of Pierce County reaches 50% impervious surface or higher. Developed land covers 9.07%. The difference exists because developed classes can include lawns, trees, yards, and exposed soil, while the impervious layer isolates roofs, pavement, parking areas, and similar hard materials.
Patterson and Offerman add smaller northeastern settlement centers
Georgia’s joint comprehensive plan covers Pierce County with Blackshear, Patterson, and Offerman. Northeast of the Blackshear-area core, the maps contain another group of developed and impervious surfaces separated from the main town by farmland, forest, and wetlands. The official municipal context makes Patterson and Offerman useful references for that part of the county.
The two cities should not be assigned to individual pixels because municipal boundaries are not included in the land-cover images. Their exact limits require Census TIGER/Line or local GIS. The reliable map-level observation is that the northeast contains smaller built centers while wide rural gaps remain between them and Blackshear.
Pierce County Planning and Codes handles annexation, rezoning, subdivision, site plans, and long-range planning for Blackshear, Patterson, Offerman, and the county. Those legal functions are separate from land cover. A red or dark raster cell identifies a developed surface, not a zoning category or development right.
Agriculture and forest divide the rural land almost evenly behind the wetlands
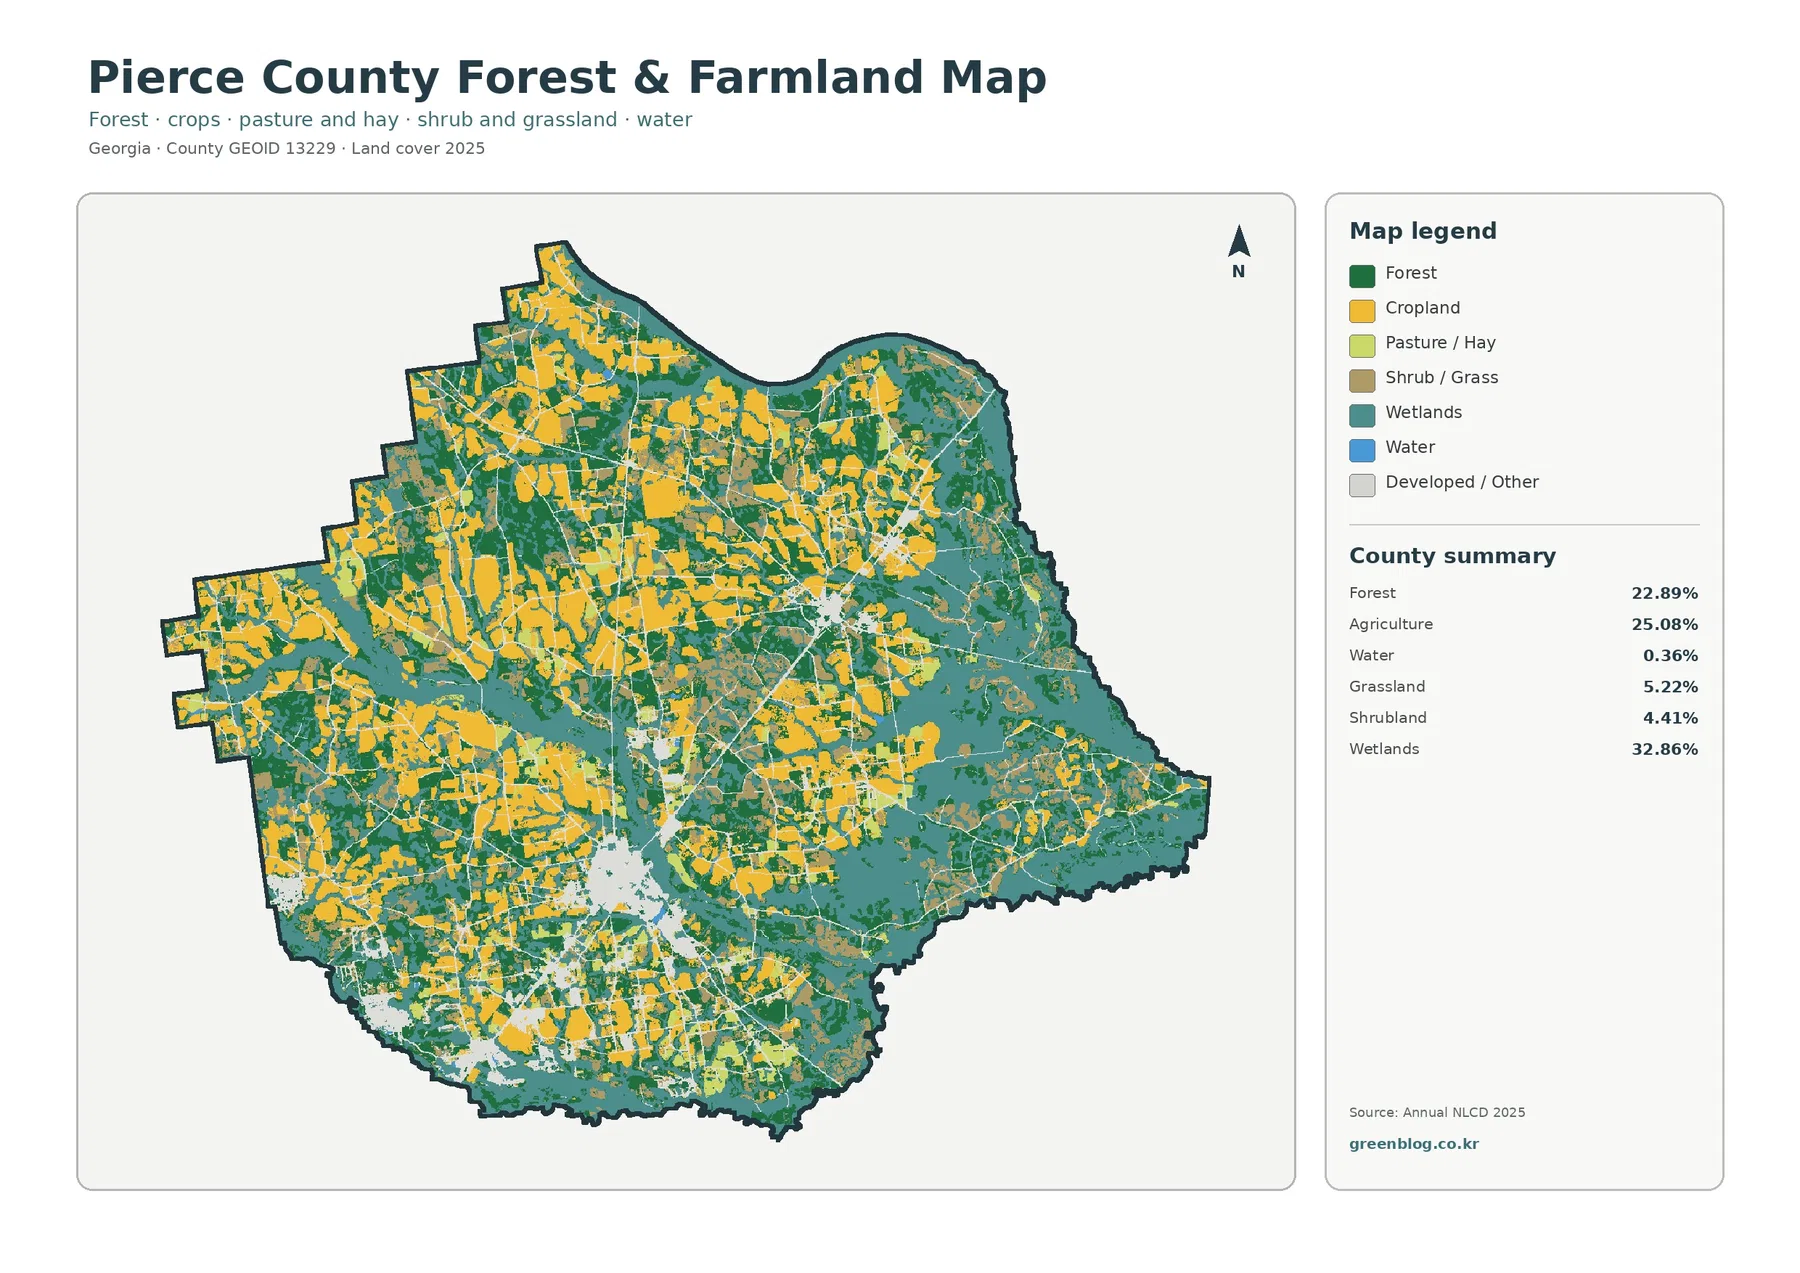
Agriculture covers 25.08% and appears in broad blocks through the north, west, and south-central portions. Forest is close behind at 22.89%, with larger wooded sections in the west and northwest and many green strips between fields and wetlands. Neither class is confined to one side of the county.
The county’s official site describes Pierce as a place of farmland and small-town rural character. UGA Extension’s Pierce County office serves commercial farmers with variety selection, pest and disease management, budgeting, price forecasting, and other production guidance. Those local sources explain why agriculture matters here without allowing a yellow pixel to be labeled as a specific crop or farm.
Grassland adds 5.22% and shrubland 4.41%. Those open classes appear among fields, forest edges, and wet areas, so not every non-forest parcel is active cropland. The vegetation map is useful for separating these surfaces before making broader statements about the county’s rural land.
Highway-oriented development is visible, but route names need a transportation layer
The impervious map contains a prominent road-shaped trace through the Blackshear area and toward the northeast. Blackshear’s 2023 planning material includes corridor-management work for Highway 84, showing that this route is important to local access and development planning. The land-cover raster can be compared with that context but does not itself label Highway 84.
The 1985–2025 endpoint map shows more forest and farm change than developed change
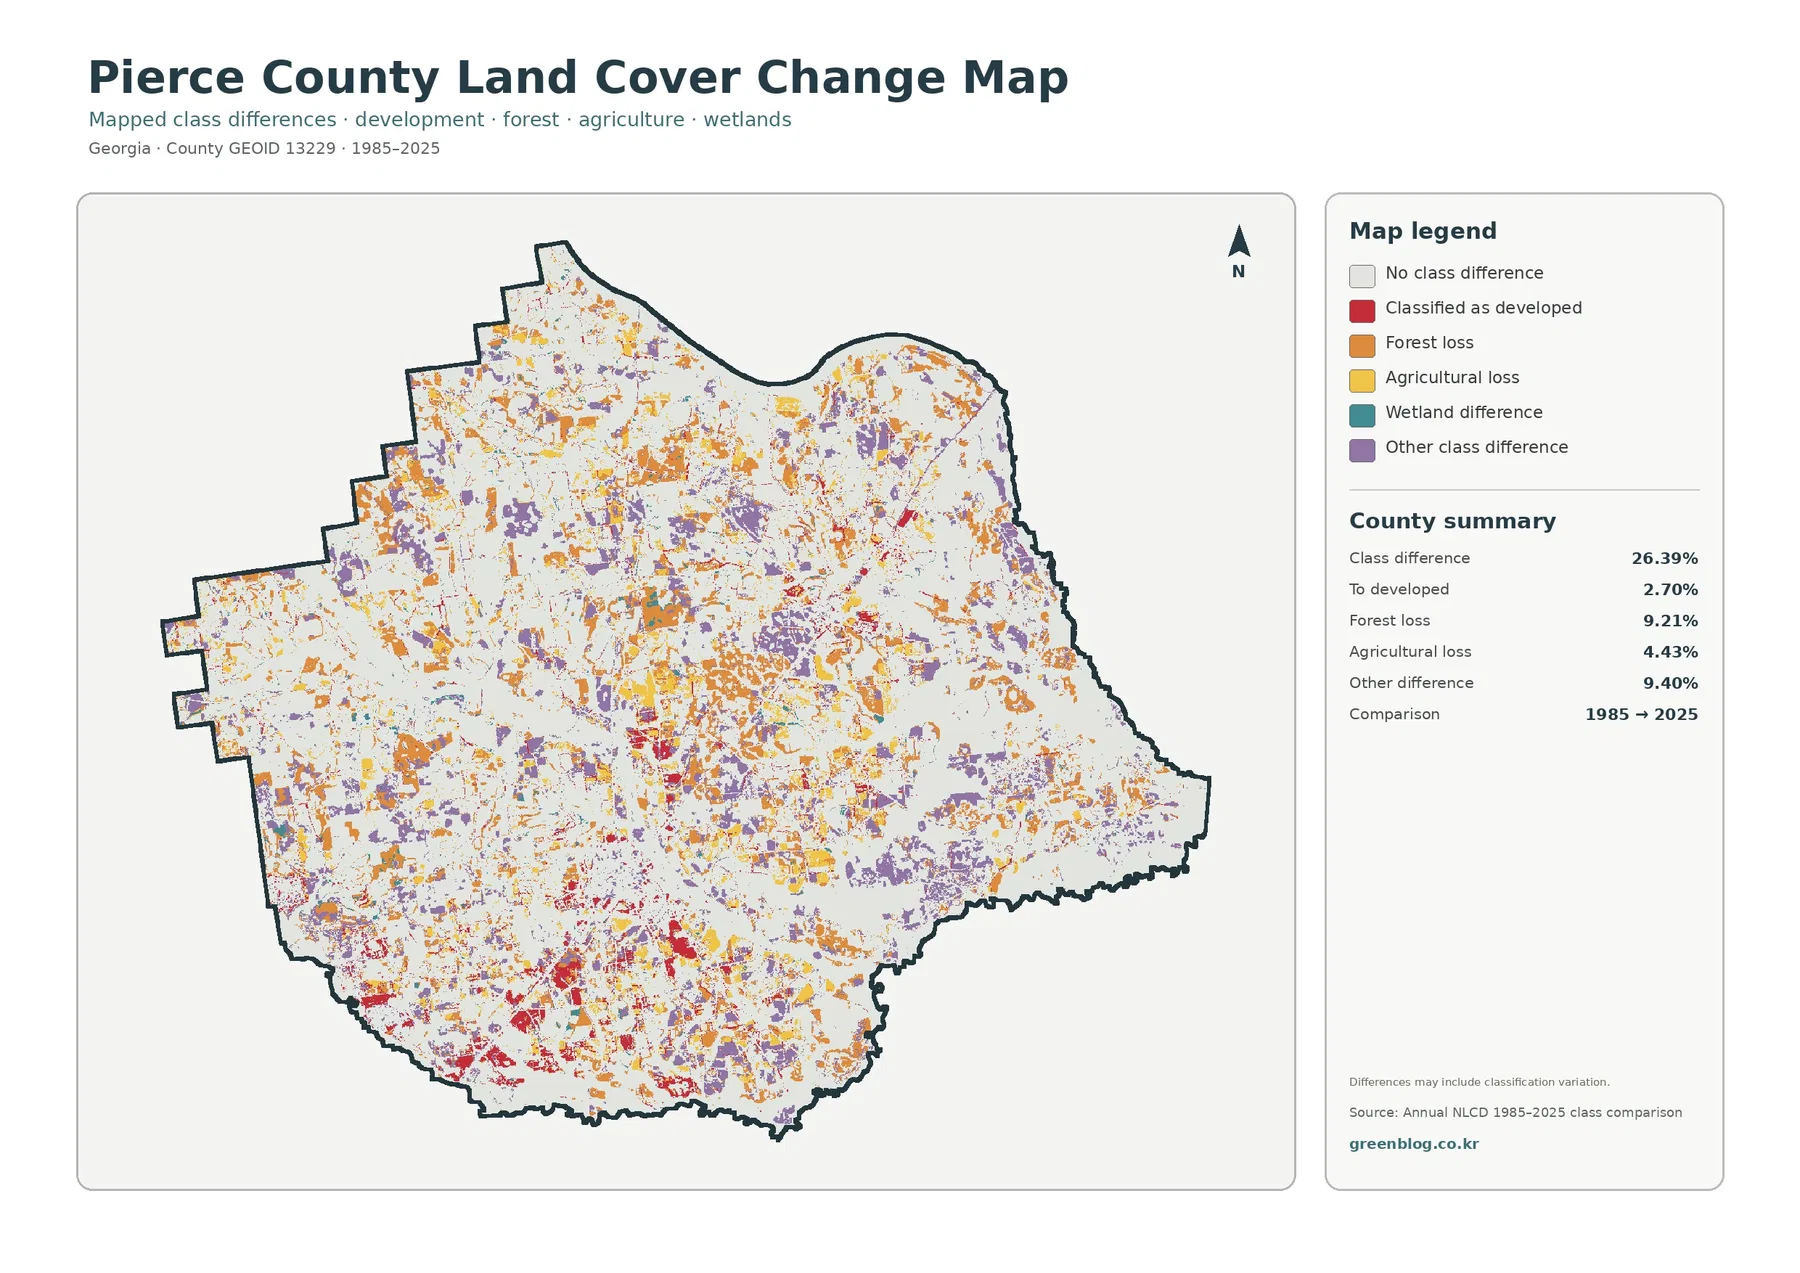
The total endpoint class difference is 26.39%. This figure counts raster cells assigned different categories in 1985 and 2025. It is not an urbanization rate and does not mean that 26.39% of Pierce County was damaged or permanently converted.
The printed summary lists 9.21% forest loss, 9.40% other difference, 4.43% agricultural loss, and 2.70% classified to developed. Developed-change red is most noticeable around Blackshear, the northeastern settlement areas, and several road corridors. Forest-loss orange and other-difference purple are distributed much more widely across the county.
Wetland difference appears in the legend without a separately printed percentage. The missing rate should not be reconstructed by subtracting the listed values from 26.39%. Classification variation may also contribute to some patches, so intermediate imagery and local forestry, agriculture, or development records are needed before assigning a cause.
The map is useful for watershed context, but not as a wetland or parcel determination
Annual NLCD assigns one predominant class to each 30-meter cell, so small ponds, narrow streams, field edges, tree rows, roads, and mixed rural lots can look simplified.
Teal does not establish a regulatory wetland boundary, yellow does not define a farm parcel, green does not identify forest ownership, and red does not show a city or zoning district. Property, permits, wetland jurisdiction, road names, and legal land-use questions require current local, state, or federal records.
Choosing the four JPG maps for Pierce County
Use the 2025 countywide map first when the goal is to explain the wetland majority, farm blocks, forest, and Blackshear development together. The vegetation map is better for agriculture-versus-forest comparisons. Choose the impervious map for town centers and road-oriented hard surfaces, and reserve the endpoint map for a separate discussion of 1985–2025 classification differences.
Each JPG measures 2480 × 1754 pixels and suits reports, lessons, and presentations. Test a proof before large-format printing because the package does not mark the files as A3 high-resolution assets.
Frequently Asked Questions
What is the dominant land-cover class in Pierce County?
Wetlands are the largest class in the supplied 2025 summary at 32.86%. Agriculture follows at 25.08%, forest at 22.89%, and developed land at 9.07%.
Why is developed land 9.07% while mean impervious cover is only 1.79%?
Developed classes can include lawns, trees, yards, and exposed ground around buildings and roads. The impervious layer measures the harder surfaces such as roofs, pavement, and parking areas.
Does the 26.39% endpoint difference measure wetland loss or urban growth?
No. It counts all cells with different class labels in 1985 and 2025. The summary separately lists 9.21% forest loss, 4.43% agricultural loss, 2.70% classified to developed, and 9.40% other difference.
Sources and Reference Data
- MRLC Annual NLCD Data – official access to annual land-cover and comparison products
- USGS Annual NLCD Land Cover Classification – definitions for wetlands, agriculture, forest, developed land, and related classes
- U.S. Census Bureau TIGER/Line Shapefiles – authoritative county, place, and transportation layers for comparison
- Pierce County Government – official local context for Blackshear, farmland, rural character, and the Alabaha River
- Georgia DCA – Pierce County Joint Comprehensive Plan – official planning context for Blackshear, Offerman, Patterson, land use, and the Satilla–Alabaha watersheds
- UGA Extension – Pierce County Agriculture & Natural Resources – local production-agriculture, crop-variety, pest, disease, and farm-management resources
Map File Information
The ZIP contains four original JPG maps for comparing Pierce County's 32.86% wetland cover, 25.08% agriculture, forest, Blackshear and northeastern development, impervious surfaces, and 1985–2025 class differences.
- Included Files: Use only the versions confirmed in the article and supplied images
- File Type: Use the confirmed download contents
- Intended Use: Printing, education, presentations, and map-based projects
Related Maps
- Appling County Georgia Land Cover Map
- Atkinson County Georgia Land Cover Map
- Bacon County Georgia Land Cover Map
Green Map creates custom-edited map images using open geographic data sources such as geoBoundaries, Natural Earth, OpenStreetMap, and government open data.
These maps are edited visual materials, not raw data files, and are provided for education, documents, presentations, and graphic reference.