Muscogee County is unusual among Georgia counties because forest and developed land occupy almost the same share of the 2025 map. Forest covers 43.40%, while developed land covers 41.04%. The western and central portions are heavily urbanized around Columbus, but the eastern side remains predominantly wooded with broad wetland patches. This Muscogee County Georgia Land Cover Map makes that urban-to-forest transition the main story rather than treating the county as uniformly built.
The article includes four WebP views: current land cover, vegetation, fractional impervious surface, and a 1985–2025 endpoint comparison. Four original 2480 × 1754 JPG maps are bundled in one ZIP for urban-environment lessons, county profiles, planning context, and presentation graphics.
Table of Contents
Columbus occupies a large developed footprint, but forest still leads countywide
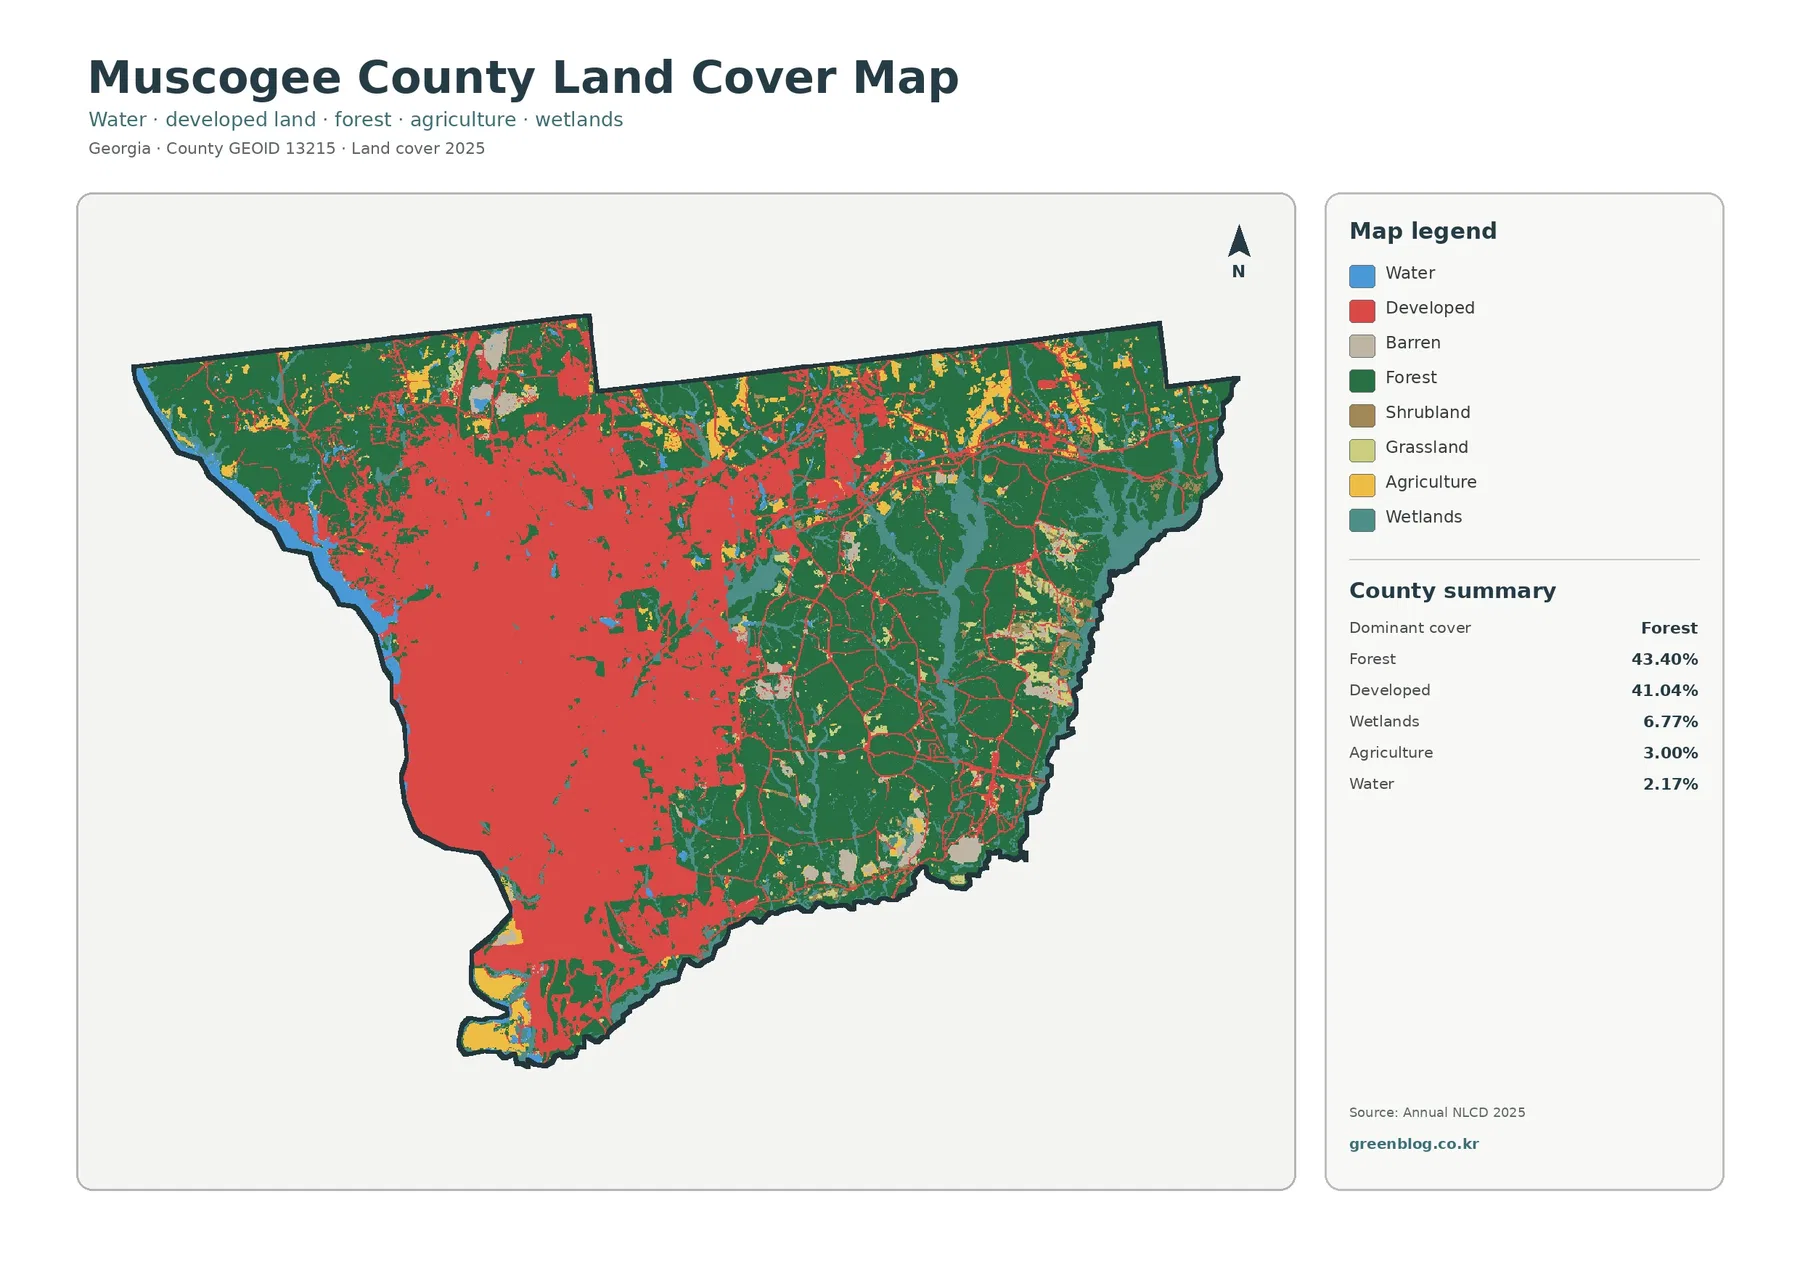
The western half contains a broad red developed area extending from the southwest through central Columbus and northward into several connected neighborhoods and road corridors. Developed land reaches 41.04%, which is far higher than in most rural counties. The map therefore looks urban at first glance, especially near the Chattahoochee River side.
Forest still ranks first at 43.40%. The eastern half contains large, nearly continuous green areas, with additional forest in the north and along the edges of developed neighborhoods. Moving east from the urban core produces a rapid shift from built cover to forest and wetlands. That contrast is one of the clearest geographic patterns in the county.
Wetlands account for 6.77%, agriculture 3.00%, and open water 2.17%. Agricultural cover is limited to small northern and southern pockets instead of broad farm districts. Wetlands are much more important and occur mainly among the eastern forest and along branching low-lying features.
Columbus and Muscogee County share one consolidated government and one city boundary
Columbus Consolidated Government’s official profile explains that the City of Columbus and Muscogee County merged in 1971 and that the entire county lies within the city limits. That detail changes how the map should be described. The forested east is not simply countryside outside Columbus; it is part of the same consolidated city-county even though its physical surface is very different from the urban west.
Land cover does not replace zoning. Columbus Planning uses the Unified Development Ordinance for legal land-use decisions, while a red raster cell only identifies developed surface.
The Chattahoochee River edge places water directly beside the urban core
Blue water traces much of the western edge, immediately beside some of the county’s most developed areas. Columbus Parks and Recreation describes the RiverWalk as following the Chattahoochee River through the city and connecting locations from Lake Oliver south toward the military installation. That local geography helps explain why water and dense development sit so close together on the west side.
Open water represents only 2.17% countywide, but its position makes it visually important. The northwest contains a broader blue section, while the central and southern west edge narrows into a river-like strip beside urban cover. The land-cover raster does not print river names, the Alabama boundary, or the RiverWalk route, so exact identification still requires a dedicated hydrography or local map.
The vegetation view makes the eastern forest dominance even more obvious
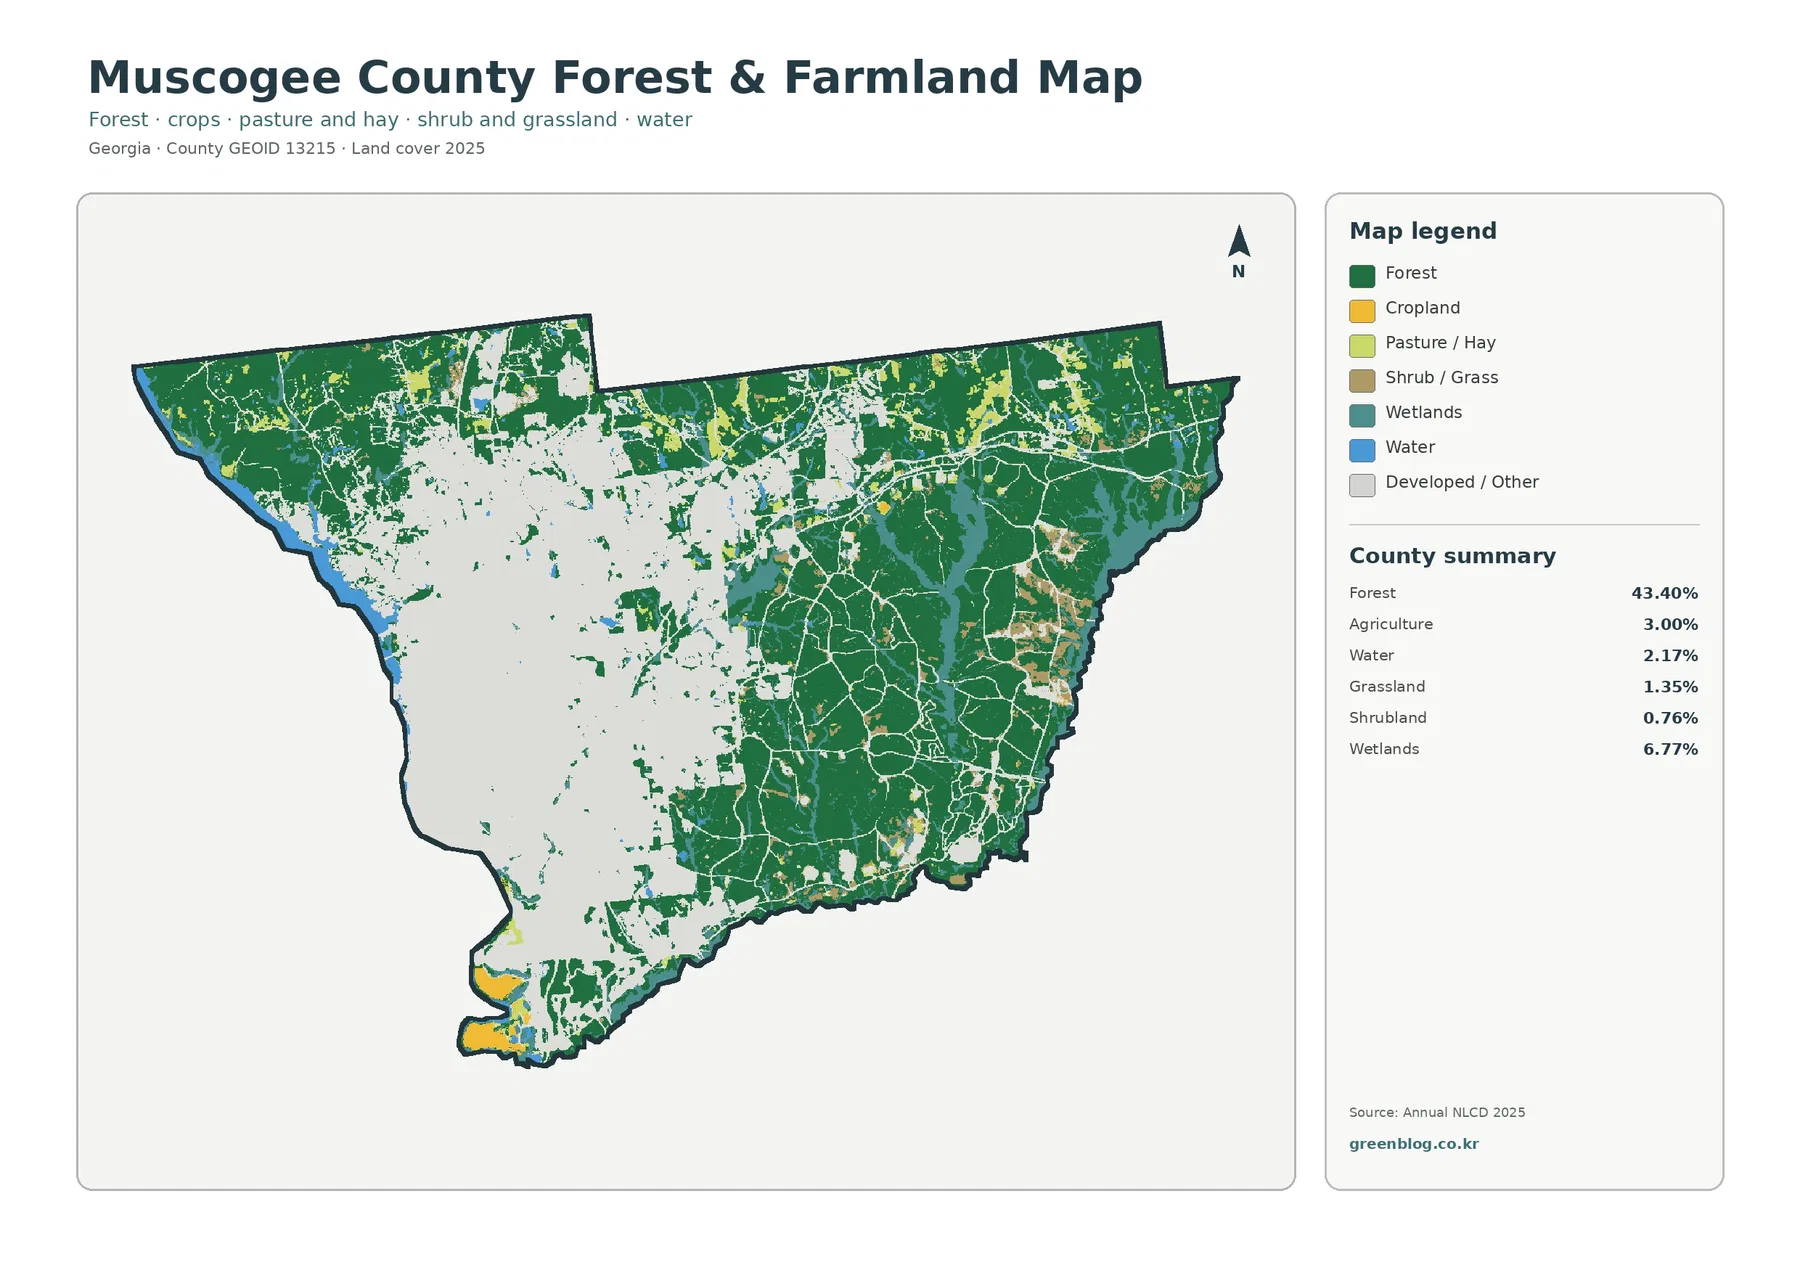
With developed areas muted, the eastern half becomes a broad block of forest interrupted mainly by wetlands, roads, and a few clearings. The west is almost the reverse: non-developed natural cover appears in smaller fragments within the city. The contrast is much stronger than a typical forest-versus-farm county because agriculture occupies only 3.00%.
Grassland is 1.35% and shrubland 0.76%, both minor classes. Small agricultural patches appear near the north and at the southern tip, but they do not shape the countywide landscape. For Muscogee County, the most useful natural-cover comparison is forest and wetlands versus the urbanized west rather than cropland versus forest.
A 15.10% impervious mean reveals a much harder urban surface than the developed percentage alone
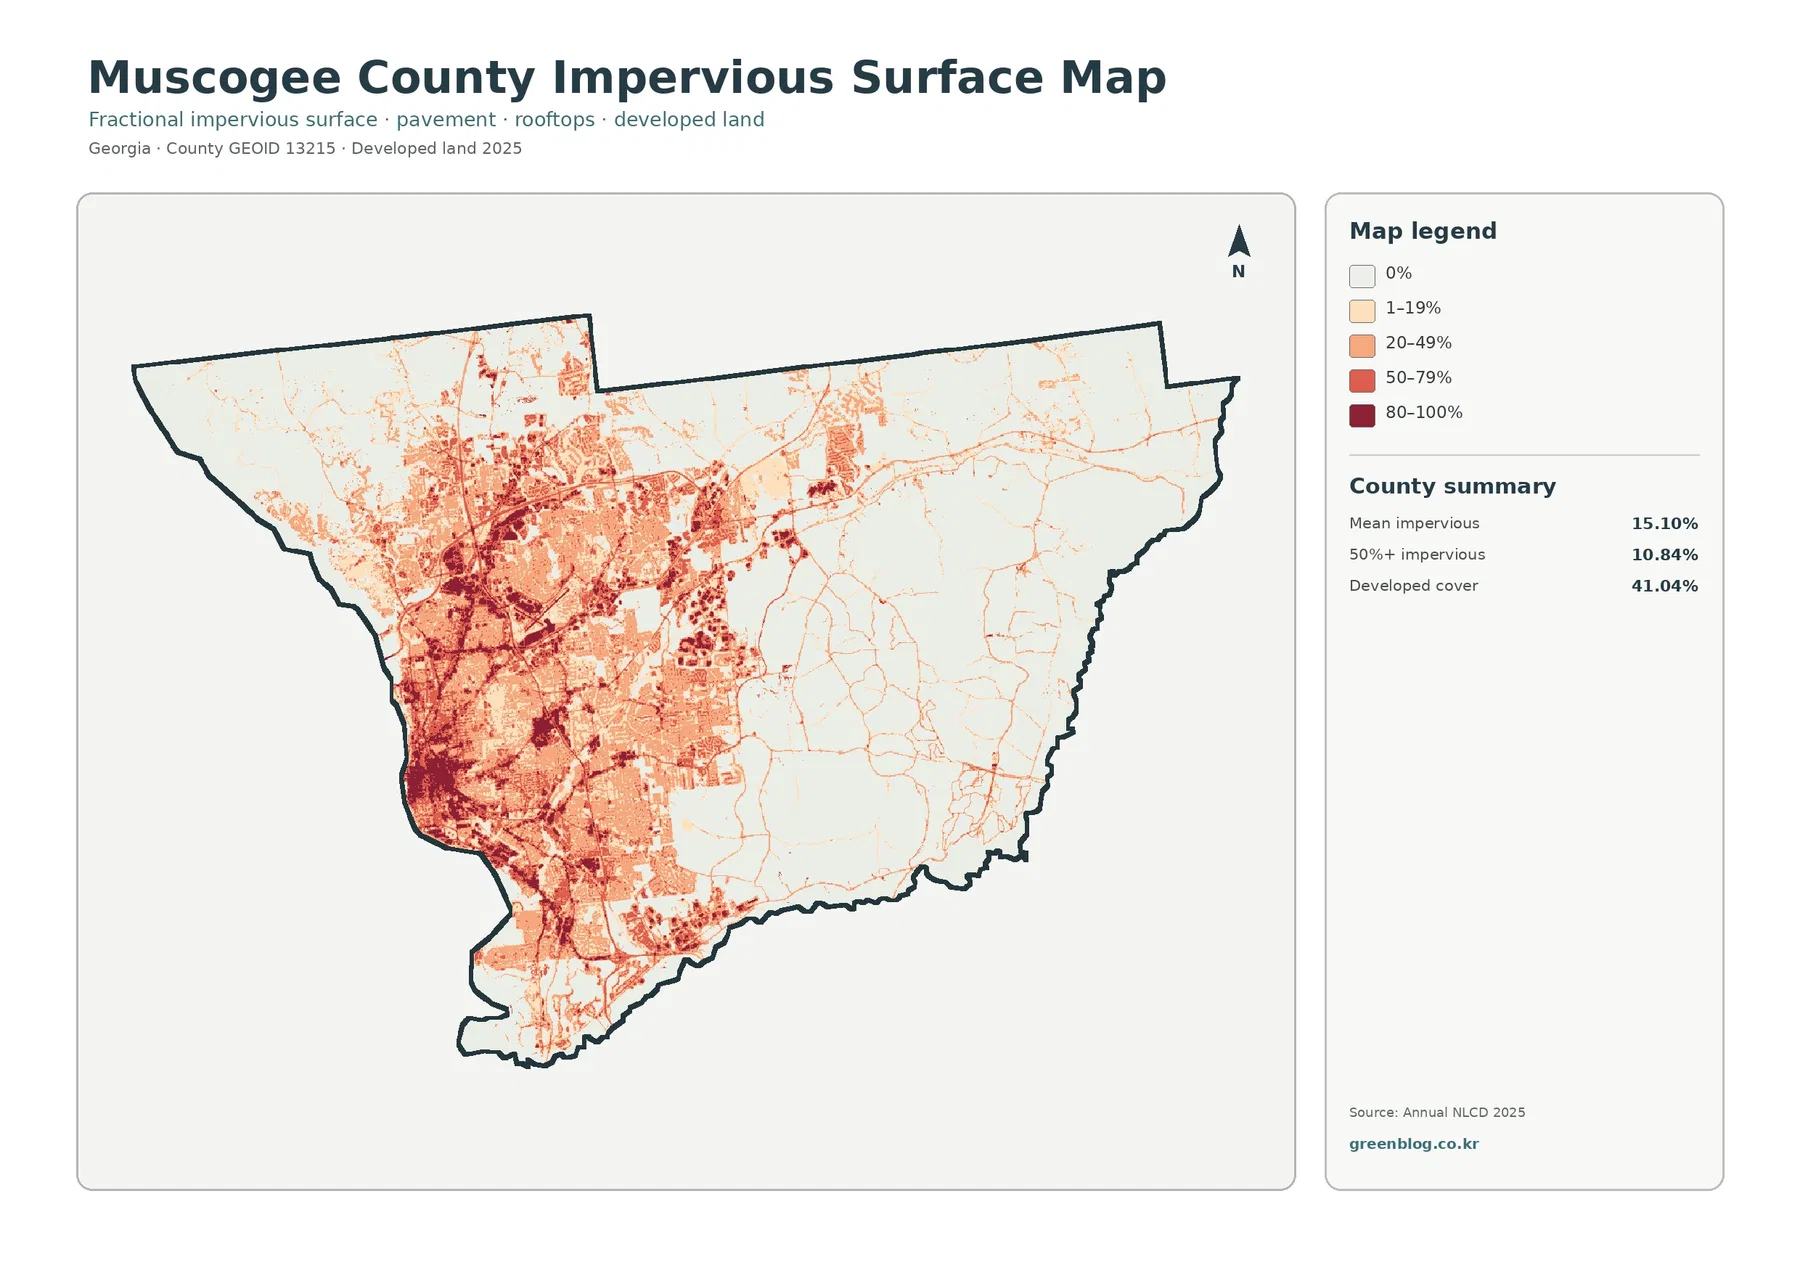
The impervious map is densely colored across the west and center. Large groups of 50–79% and 80–100% cells occur inside the Columbus core, with additional high values north and south along roads and developed sites. The eastern half turns mostly white or pale, so the divide between urban hard surfaces and forested land is even sharper than on the general map.
Mean impervious cover is 15.10%, and 10.84% of the county reaches 50% impervious surface or higher. Developed land covers 41.04%, but those figures measure different things. Developed classes can contain lawns, trees, bare ground, and other permeable surfaces, while the impervious layer isolates roofs, pavement, parking lots, and similar hard materials.
The impervious map can support stormwater and urban-heat discussions, but it is not a flood-risk model. Site-specific risk requires separate drainage, terrain, rainfall, and flood data.
The 1985–2025 endpoint map records 10.33% classified to developed
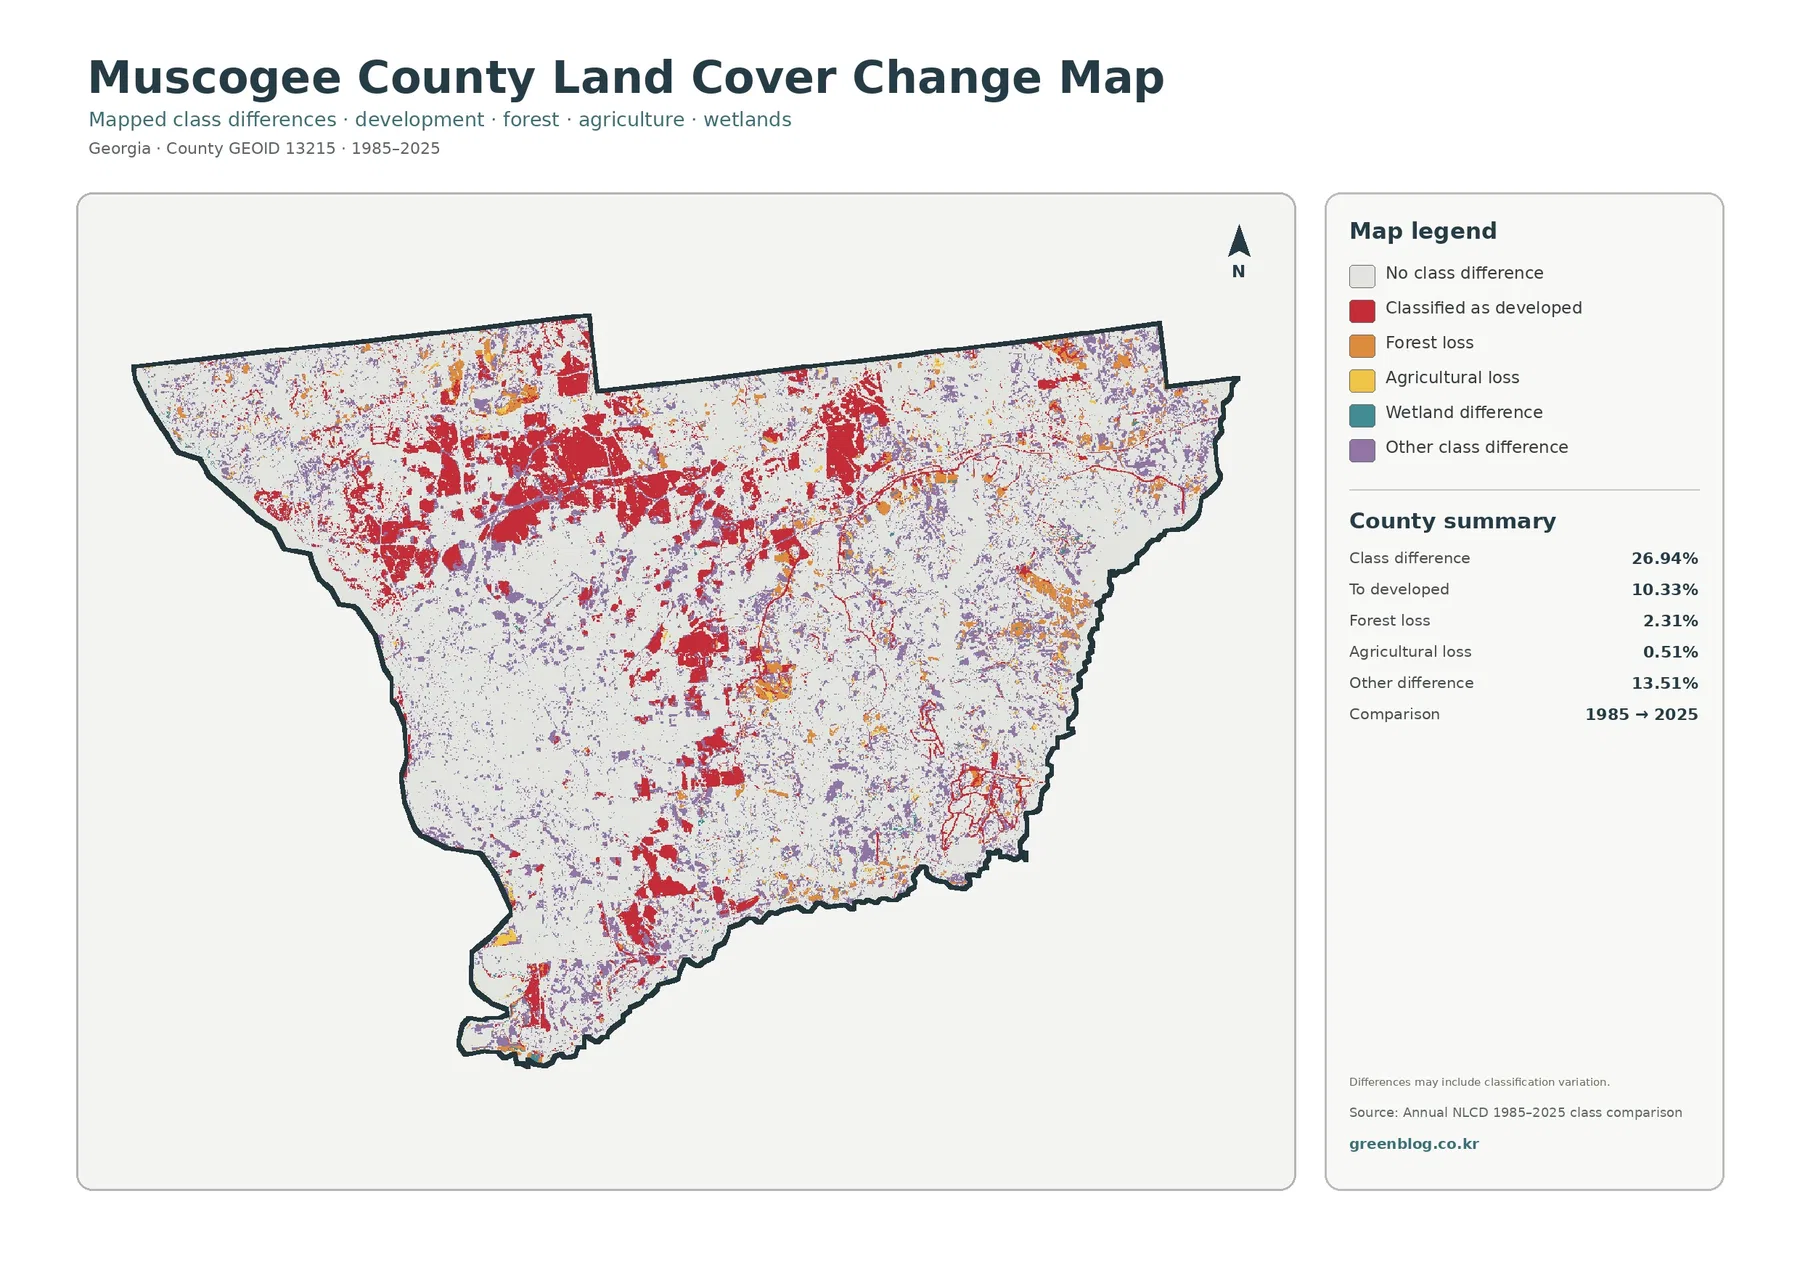
The total class difference between 1985 and 2025 is 26.94%. This number counts raster cells assigned different classes at the two endpoints. It is not the share of Muscogee County that was damaged, and it cannot be used by itself to reconstruct the county’s earlier developed or forest percentage.
The printed summary lists 10.33% classified to developed, 13.51% other difference, 2.31% forest loss, and 0.51% agricultural loss. Developed-change red is widespread across the west and central north, often around areas that are already heavily urbanized in 2025. The eastern half has more unchanged white cells, although roads and scattered development changes extend into it.
Wetland difference appears in the legend without a separately printed percentage. The missing rate should not be reconstructed by subtraction and presented as official. The map also notes that classification variation may be included, so intermediate imagery and local development records are needed before assigning causes or exact timing.
Thirty-meter land cover is useful for urban structure, not parcel or zoning decisions
Annual NLCD assigns one predominant class to each 30-meter raster cell. A city block can contain buildings, parking, trees, lawns, and streets even though the cell receives one main category. Small parks, narrow streams, wooded buffers, and individual buildings can therefore look simplified at county scale.
Using the four JPG maps to explain an urban-forest county
Start with the 2025 countywide map when the goal is to show that forest and developed land occupy nearly equal shares but are concentrated in very different places. The vegetation map is better for the eastern forest and wetlands. Use the impervious map for Columbus roofs and pavement, and reserve the endpoint map for a separate discussion of 1985–2025 classification differences.
Each JPG measures 2480 × 1754 pixels and is suitable for reports, lessons, and presentation graphics. The package does not identify the files as meeting an A3 high-resolution reference, so test a proof before relying on them for large-format printing.
Frequently Asked Questions
Is Muscogee County more forested or developed?
Forest is slightly larger in the supplied 2025 summary at 43.40%, while developed land covers 41.04%. Their locations are very different, with development concentrated west and center and forest dominant in the east.
Why is developed land 41.04% while mean impervious cover is 15.10%?
Developed classes can include trees, lawns, yards, and bare ground around buildings and roads. The impervious layer measures the harder surfaces such as roofs, pavement, and parking areas.
Does the 26.94% endpoint difference measure urban growth?
No. It counts all cells with different class labels in 1985 and 2025. The summary separately lists 10.33% classified to developed, 2.31% forest loss, 0.51% agricultural loss, and 13.51% other difference.
Sources and Reference Data
- MRLC Annual NLCD Data – official access to annual land-cover and comparison products
- USGS Annual NLCD Land Cover Classification – definitions for forest, developed land, wetlands, agriculture, and related classes
- U.S. Census Bureau TIGER/Line Shapefiles – authoritative county, place, and transportation layers for comparison
- Columbus Consolidated Government – Columbus Profile – official background on the 1971 city-county consolidation and countywide city limits
- Columbus Parks & Recreation – Riverwalk – official context for the Chattahoochee River, RiverWalk, and Lake Oliver along the western urban edge
- UGA Extension – Muscogee County Agriculture & Natural Resources – local soil, water, agriculture, home-garden, and sustainable-landscape resources
Map File Information
The ZIP contains four JPG maps for comparing Muscogee County's 43.40% forest cover, 41.04% developed land, Columbus hard surfaces, eastern wetlands and woods, and 1985–2025 class differences.
- Included Files: Use only the versions confirmed in the article and supplied images
- File Type: Use the confirmed download contents
- Intended Use: Printing, education, presentations, and map-based projects
Related Maps
- Appling County Georgia Land Cover Map
- Atkinson County Georgia Land Cover Map
- Bacon County Georgia Land Cover Map
Green Map creates custom-edited map images using open geographic data sources such as geoBoundaries, Natural Earth, OpenStreetMap, and government open data.
These maps are edited visual materials, not raw data files, and are provided for education, documents, presentations, and graphic reference.