Mitchell County is strongly agricultural, but the county is not visually uniform. Agriculture covers 54.33% of the supplied 2025 map, forest 23.67%, wetlands 10.19%, and developed land 7.62%. One large built cluster sits near the middle around Camilla, while another distinct center appears farther south near Pelham. This Mitchell County Georgia Land Cover Map explains how those two settlement areas fit into a landscape of fields, wooded blocks, and wet corridors.
Four WebP previews accompany the article: current land cover, a vegetation-focused view, fractional impervious surface, and a 1985–2025 endpoint comparison. The four original 2480 × 1754 JPG maps are packaged in one ZIP for reports, lessons, county profiles, and presentations.
Table of Contents
Camilla and Pelham create two separate hard-surface centers instead of one urban strip
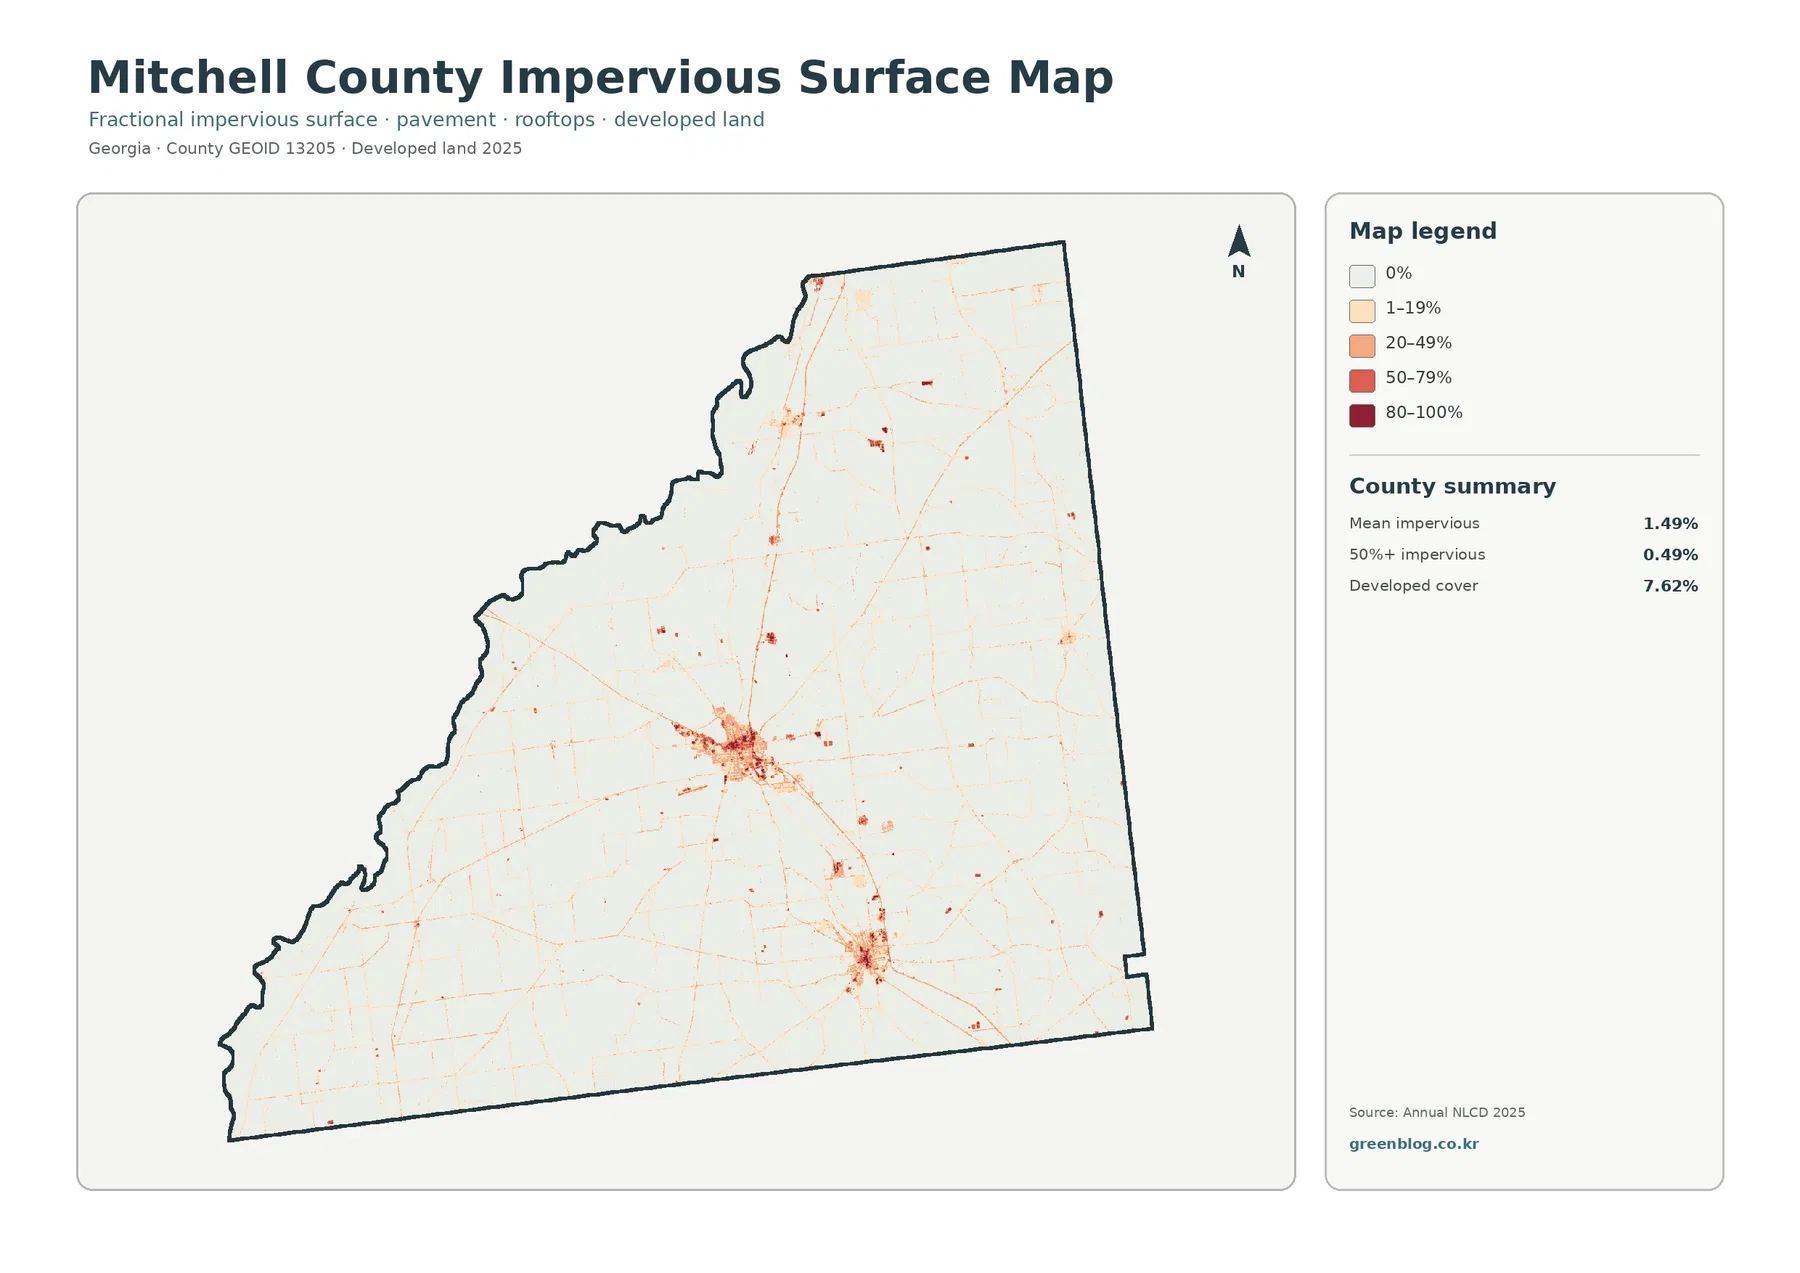
The impervious map has two obvious concentrations. The larger one lies near the county center, and a second compact cluster sits to the south. Smaller hard-surface points appear farther north and east, but they do not approach the size of the two main centers. Broad agricultural areas between the clusters remain pale, so the county does not read as one continuous suburban corridor.
Mitchell County’s official city information identifies Camilla as the county seat and Pelham as another major incorporated community. Baconton and Sale City are also part of the county. This official place context helps orient the separate clusters, but the land-cover raster does not draw municipal boundaries. Exact city limits must come from a verified place layer.
The countywide mean impervious value is 1.49%, and 0.49% of the county reaches 50% impervious surface or more. Developed land covers 7.62%, a broader class that can include yards, trees, lawns, and bare soil around buildings and roads. The impervious product narrows the view to roofs, pavement, parking surfaces, and other materials that resist water infiltration.
Agriculture covers more than half the county, but forest still breaks up the field pattern
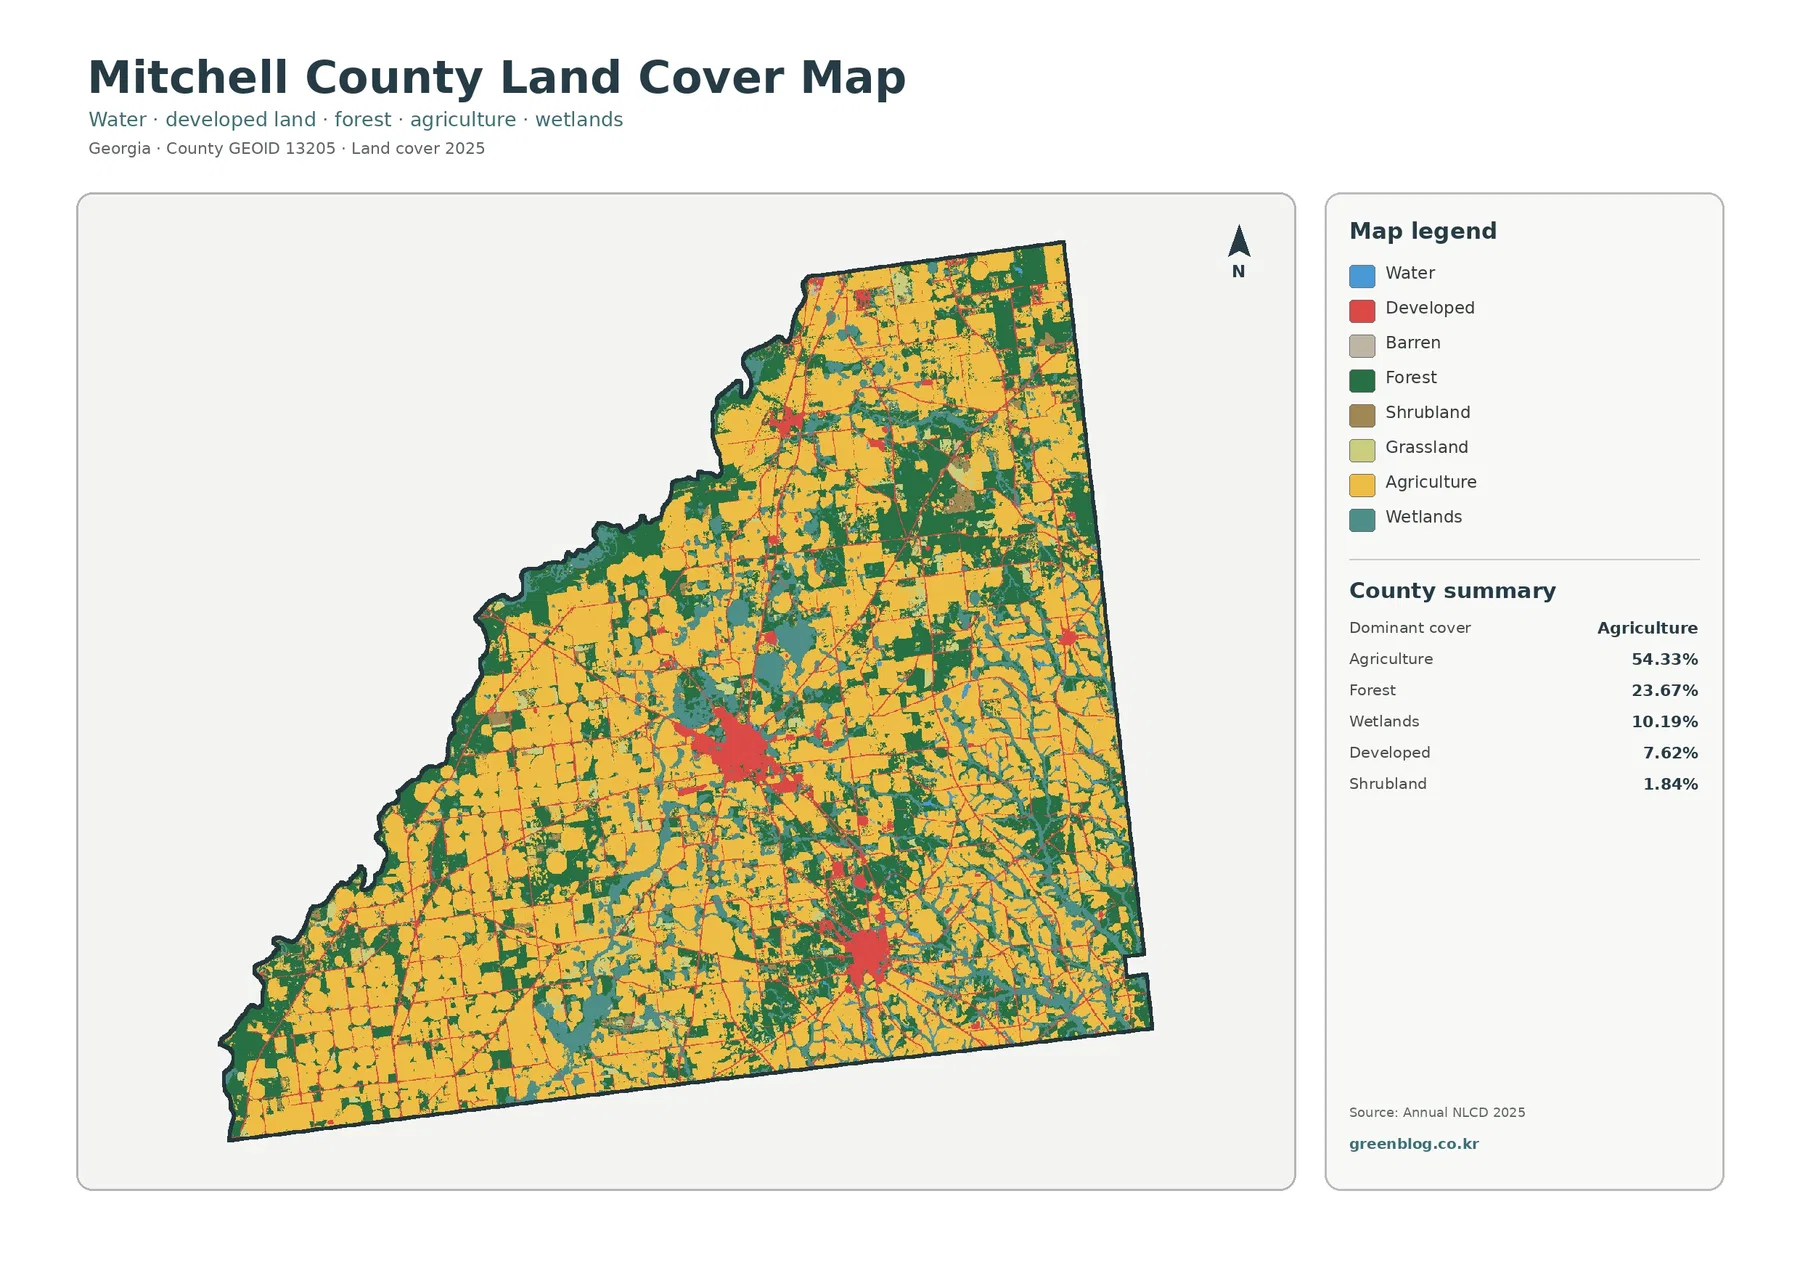
Agriculture is the dominant class at 54.33%. Large yellow field blocks fill much of the north and east and continue across the southern and western parts of the county. The pattern is extensive enough that forest, wetlands, and settlement mostly appear as interruptions within a farm-dominated landscape rather than as equally large regional zones.
Forest covers 23.67%. The largest wooded blocks appear in the northeast, central-east, and near parts of the western edge, with additional green patches across the south. These forests repeatedly divide the agricultural areas, so even the most farm-heavy portions are not completely open.
Wetlands account for 10.19%. Teal cover is especially noticeable along the western side and in branching bands through the central county. Mitchell County’s official community page places the county on the east side of the Flint River. That geographic fact helps explain why the west deserves attention, although the teal raster is not a legal wetland map or a precise river boundary.
The vegetation view makes the size of working farmland unmistakable
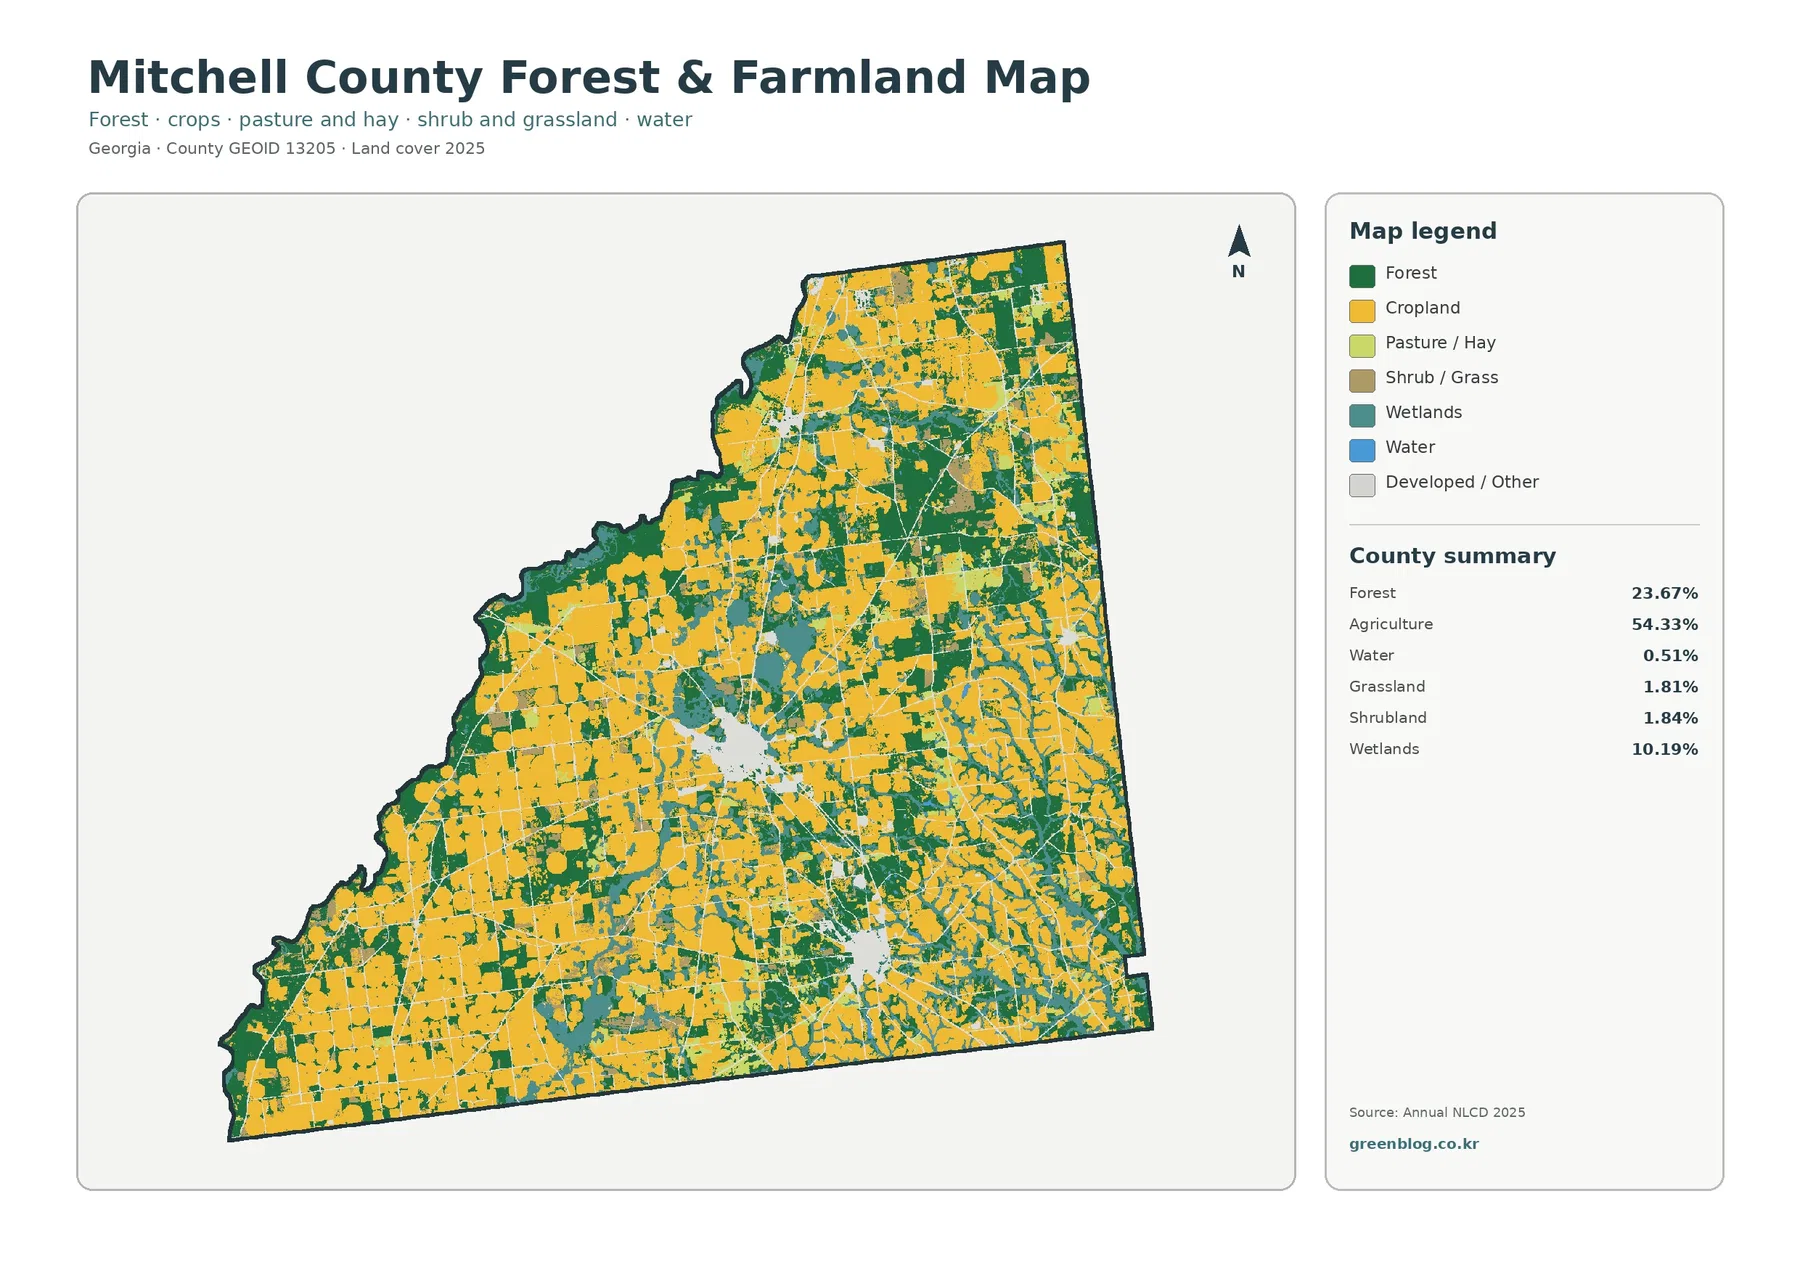
Removing the strong developed colors exposes a county where field blocks dominate nearly every direction. The eastern and northern sections contain some of the broadest continuous agricultural areas, while the west and center show more interruptions from forest and wetlands. Southern Mitchell County remains heavily farmed even around the Pelham-area settlement.
Mitchell County’s official descriptions of Camilla and Pelham both emphasize agriculture, including peanuts, cotton, corn, pecans, poultry, cattle, vegetables, and related processing. The local UGA Extension office provides farmers with crop-production information, soil testing, water-quality resources, and other agricultural support. Those sources explain why agriculture is central to the county without turning the raster into a crop-specific map.
Shrubland is 1.84%, grassland 1.81%, and open water 0.51%. These smaller classes are scattered among fields and wooded areas. Their limited percentages also show why a countywide explanation is clearer when agriculture, forest, wetlands, and developed land are treated as the main classes rather than giving every minor color equal weight.
The Flint River border and U.S. 19 corridor provide useful geography without replacing the raster evidence
Mitchell County’s official community information says the county lies along the east side of the Flint River and is bisected by U.S. Highway 19. The county’s city page also places Camilla and Pelham on the Highway 19 corridor. Those facts offer a useful frame for the west-edge wetland pattern and the north-south relationship between the two larger settlement centers.
The 1985–2025 endpoint comparison records more forest and farm change than developed change
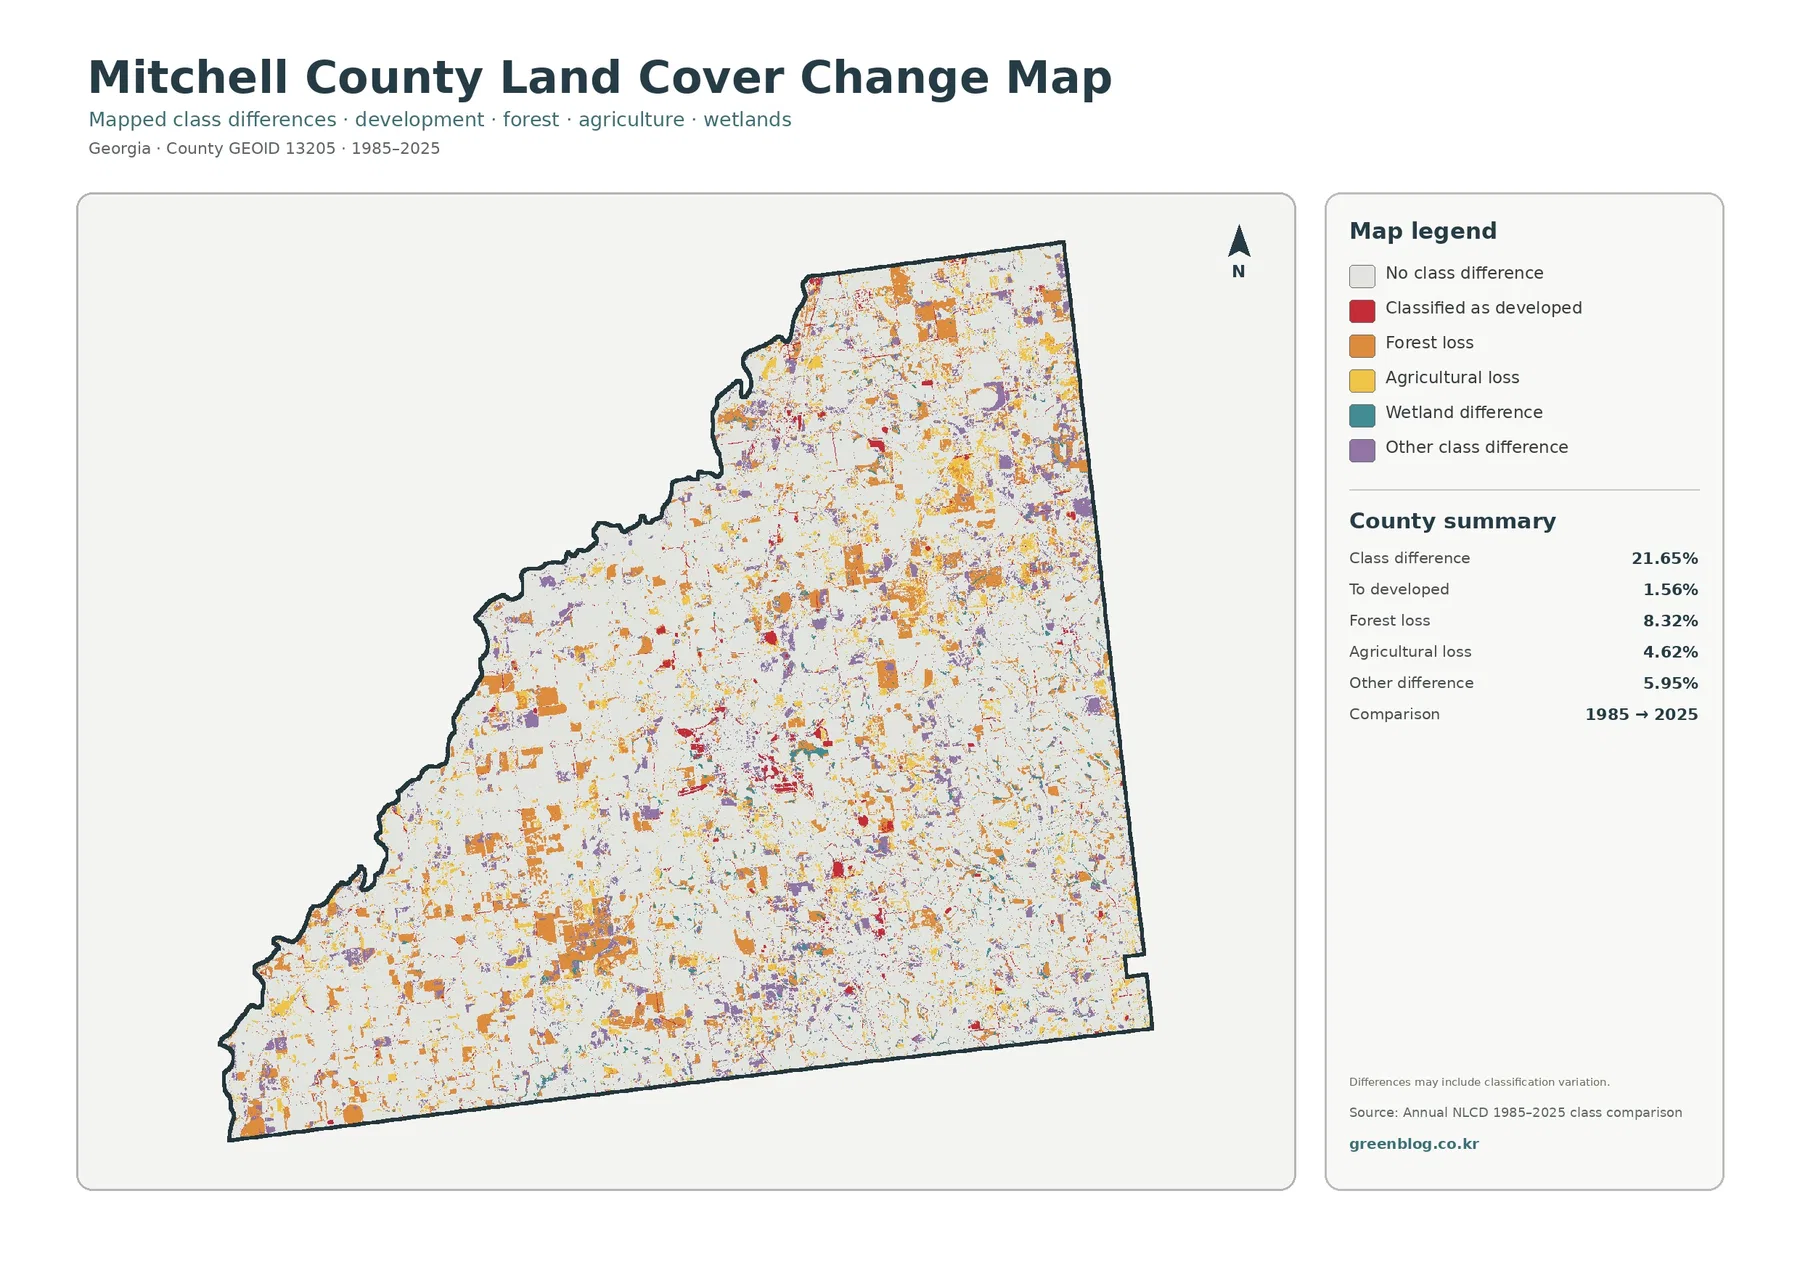
The total class difference between the two endpoint years is 21.65%. This is the share of raster cells assigned different categories in 1985 and 2025. It is not the amount of Mitchell County that became urban, and it cannot be subtracted from the current 54.33% agricultural share to reconstruct historical farmland.
The printed summary lists 8.32% forest loss, 4.62% agricultural loss, 5.95% other difference, and 1.56% classified to developed. Developed-change red is concentrated around the Camilla and Pelham areas and a few smaller sites. Forest-loss orange and agricultural-loss yellow are more widely scattered across the county.
Wetland difference appears in the legend without its own printed percentage. The missing rate should not be recreated by subtraction and reported as official. The map also warns that classification variation can be included, so image date, seasonal conditions, mixed land cover within one cell, and model decisions can contribute to some endpoint differences.
A county-scale land-cover map cannot replace parcel, zoning, or crop records
Annual NLCD uses 30-meter raster cells. A single square can contain a field edge, trees, a road, and part of a building even though it receives one predominant class. Narrow drainage channels, small ponds, thin forest strips, and farm structures can therefore be simplified at county scale.
Use the four JPG maps as a small reference set rather than four copies of the same story
Start with the 2025 countywide map for an overview of agriculture, forest, wetlands, and settlement. The vegetation map is the clearest choice when the emphasis is farming and natural cover. Use the impervious view for the Camilla and Pelham hard-surface centers, and reserve the endpoint map for a separate discussion of 1985–2025 classification differences.
Each JPG measures 2480 × 1754 pixels and suits reports, lessons, and presentations. Test a proof before large-format printing because the package does not mark the files as A3 high-resolution assets.
Frequently Asked Questions
What is the dominant land-cover class in Mitchell County?
Agriculture is the largest class in the supplied 2025 summary at 54.33%. Forest follows at 23.67%, wetlands at 10.19%, and developed land at 7.62%.
Why is developed land 7.62% while mean impervious cover is only 1.49%?
Developed classes can include trees, lawns, yards, and bare ground around buildings and roads. The impervious product measures the harder surfaces such as roofs, pavement, and parking areas.
Does the 21.65% endpoint difference show how much farmland disappeared?
No. It counts cells with different class labels in 1985 and 2025. The summary separately lists 8.32% forest loss, 4.62% agricultural loss, 5.95% other difference, and 1.56% classified to developed.
Sources and Reference Data
- MRLC Annual NLCD Data – official access to annual land-cover and comparison products
- USGS Annual NLCD Land Cover Classification – definitions for agriculture, forest, wetlands, developed land, and related classes
- U.S. Census Bureau TIGER/Line Shapefiles – authoritative county, place, and transportation layers for comparison
- Mitchell County – Community – official county context for the Flint River, U.S. Highway 19, and the county’s incorporated communities
- Mitchell County – Our Cities – official descriptions of Camilla, Pelham, Baconton, and Sale City
- UGA Extension – Mitchell County Agriculture & Natural Resources – local crop-production, soil, water, and agriculture resources
Map File Information
The ZIP contains four original JPG maps for comparing Mitchell County's 54.33% agricultural cover, forest and wetlands, Camilla and Pelham development, impervious surfaces, and 1985–2025 class differences.
- Included Files: Use only the versions confirmed in the article and supplied images
- File Type: Use the confirmed download contents
- Intended Use: Printing, education, presentations, and map-based projects
Related Maps
- Appling County Georgia Land Cover Map
- Atkinson County Georgia Land Cover Map
- Bacon County Georgia Land Cover Map
Green Map creates custom-edited map images using open geographic data sources such as geoBoundaries, Natural Earth, OpenStreetMap, and government open data.
These maps are edited visual materials, not raw data files, and are provided for education, documents, presentations, and graphic reference.