Wetlands define the supplied 2025 Liberty County map. They cover 43.62% of the county, followed by forest at 33.74%. Developed land is much smaller at 9.56%, but it forms a conspicuous concentration in the western half around the Hinesville area. This Liberty County Georgia Land Cover Map compares that built center with the extensive wetland, forest, and open-water landscape farther east.
The article includes current land cover, forest and farmland, fractional impervious surface, and a 1985–2025 endpoint comparison. Four WebP previews appear with the discussion, and the original 2480 × 1754 JPG maps are available together in one ZIP. The set works well for county profiles, environmental lessons, presentations, and broad comparisons of developed and natural cover.
Table of Contents
Hard surfaces make the western development concentration easy to isolate
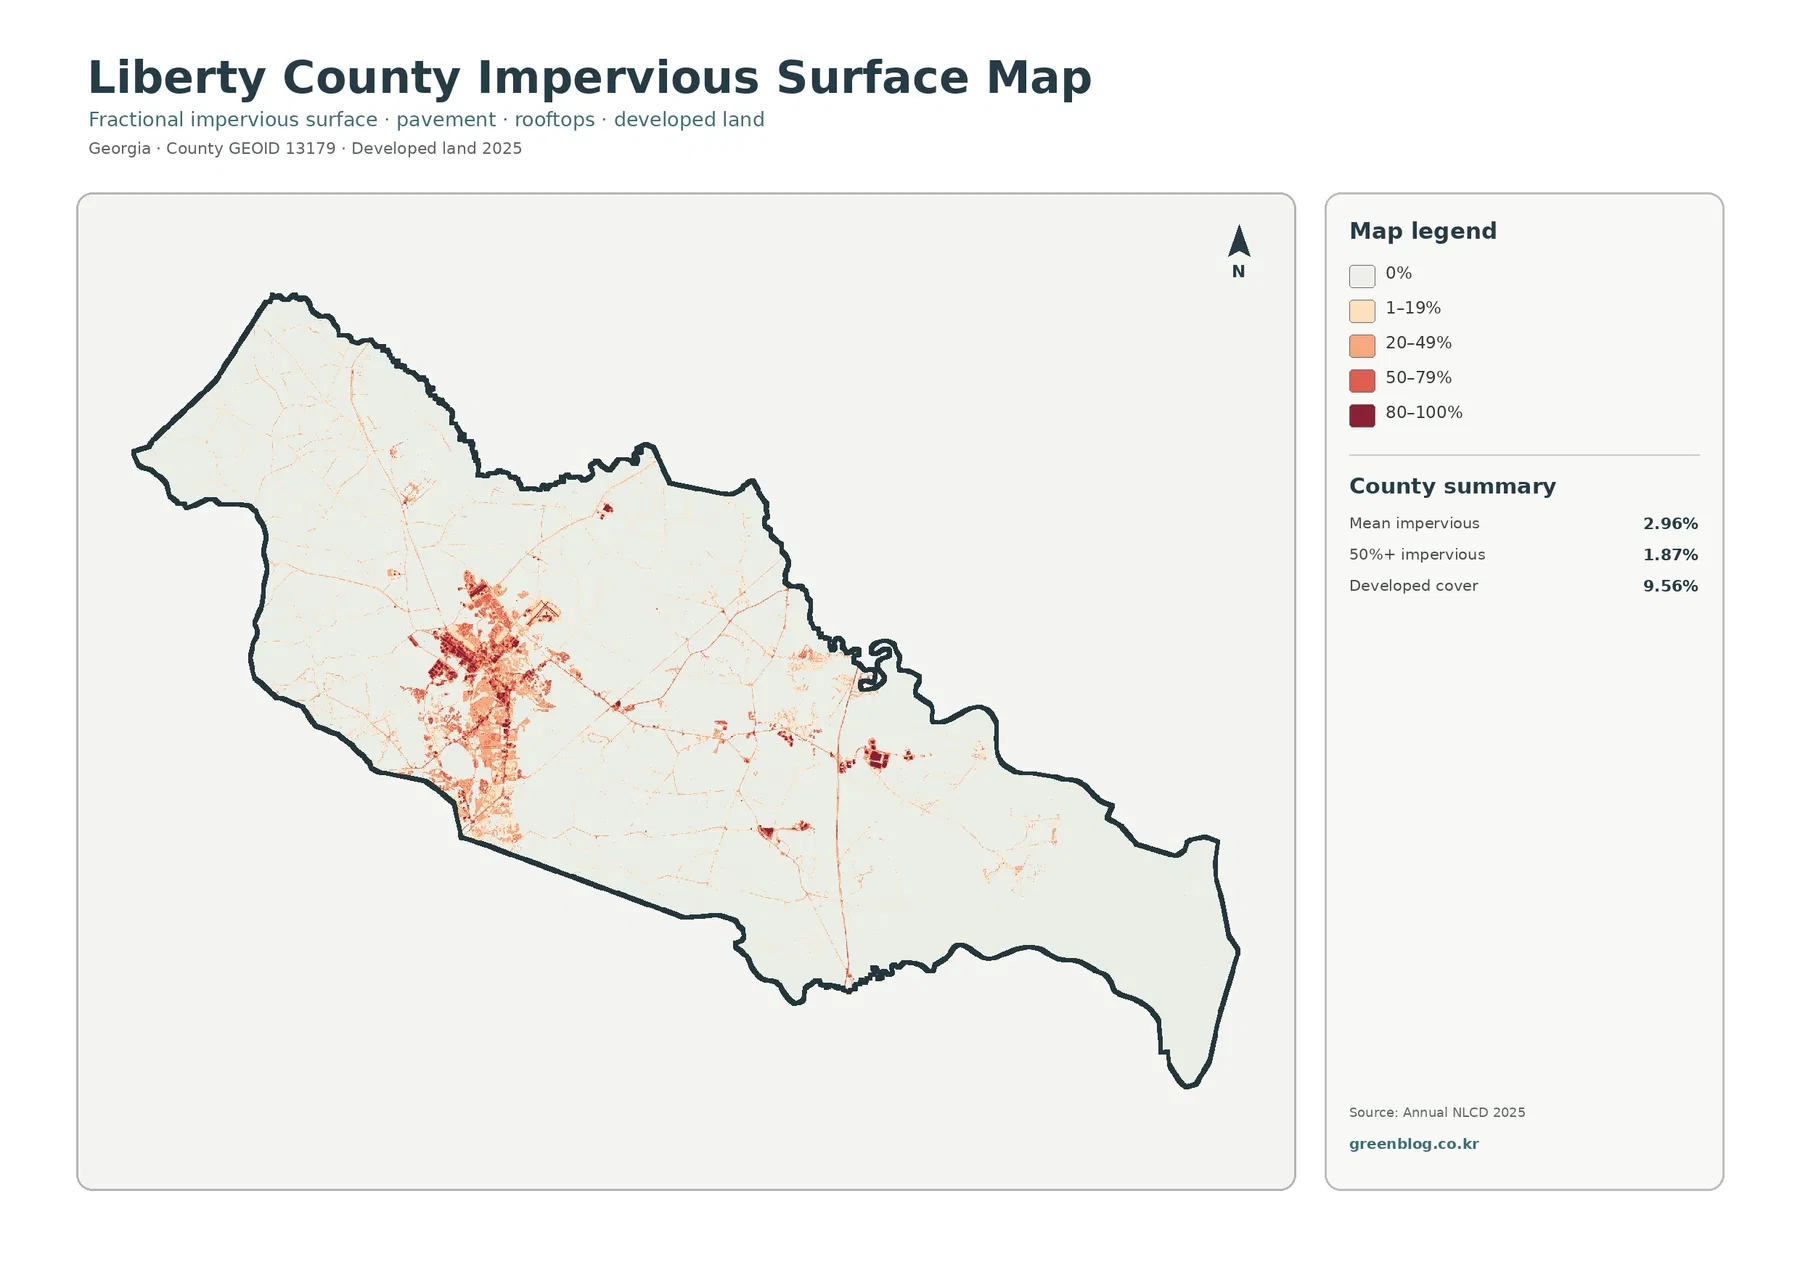
The impervious view places the county’s largest concentration of roofs and pavement in the western half. Dark red and orange patches form a broad cluster, with lighter linear traces extending north, south, and east. A few smaller concentrations occur farther east and southeast, but most of the county has little dark shading. The contrast between the main built center and the wetland-rich east is stronger here than on the general land-cover map.
Hinesville is a useful geographic reference for the largest cluster. The City of Hinesville maintains GIS information for municipal boundaries and Liberty County planning, while the city’s development authority describes Hinesville’s regional relationship with Fort Stewart. Those sources explain why this part of the county functions as a major developed center. The supplied raster does not draw either the city boundary or the Fort Stewart installation boundary, so individual cells should not be assigned to either jurisdiction without a separate official layer.
Mean impervious cover is 2.96%, and 1.87% of the county is mapped at 50% impervious surface or higher. Both values are much lower than the 9.56% developed share. Developed classes can contain lawns, trees, yards, and open soil around roads and buildings. Fractional impervious cover isolates the roofs, pavement, parking areas, and similar surfaces that do not readily absorb water.
Wetlands and forest together account for more than three-quarters of the county
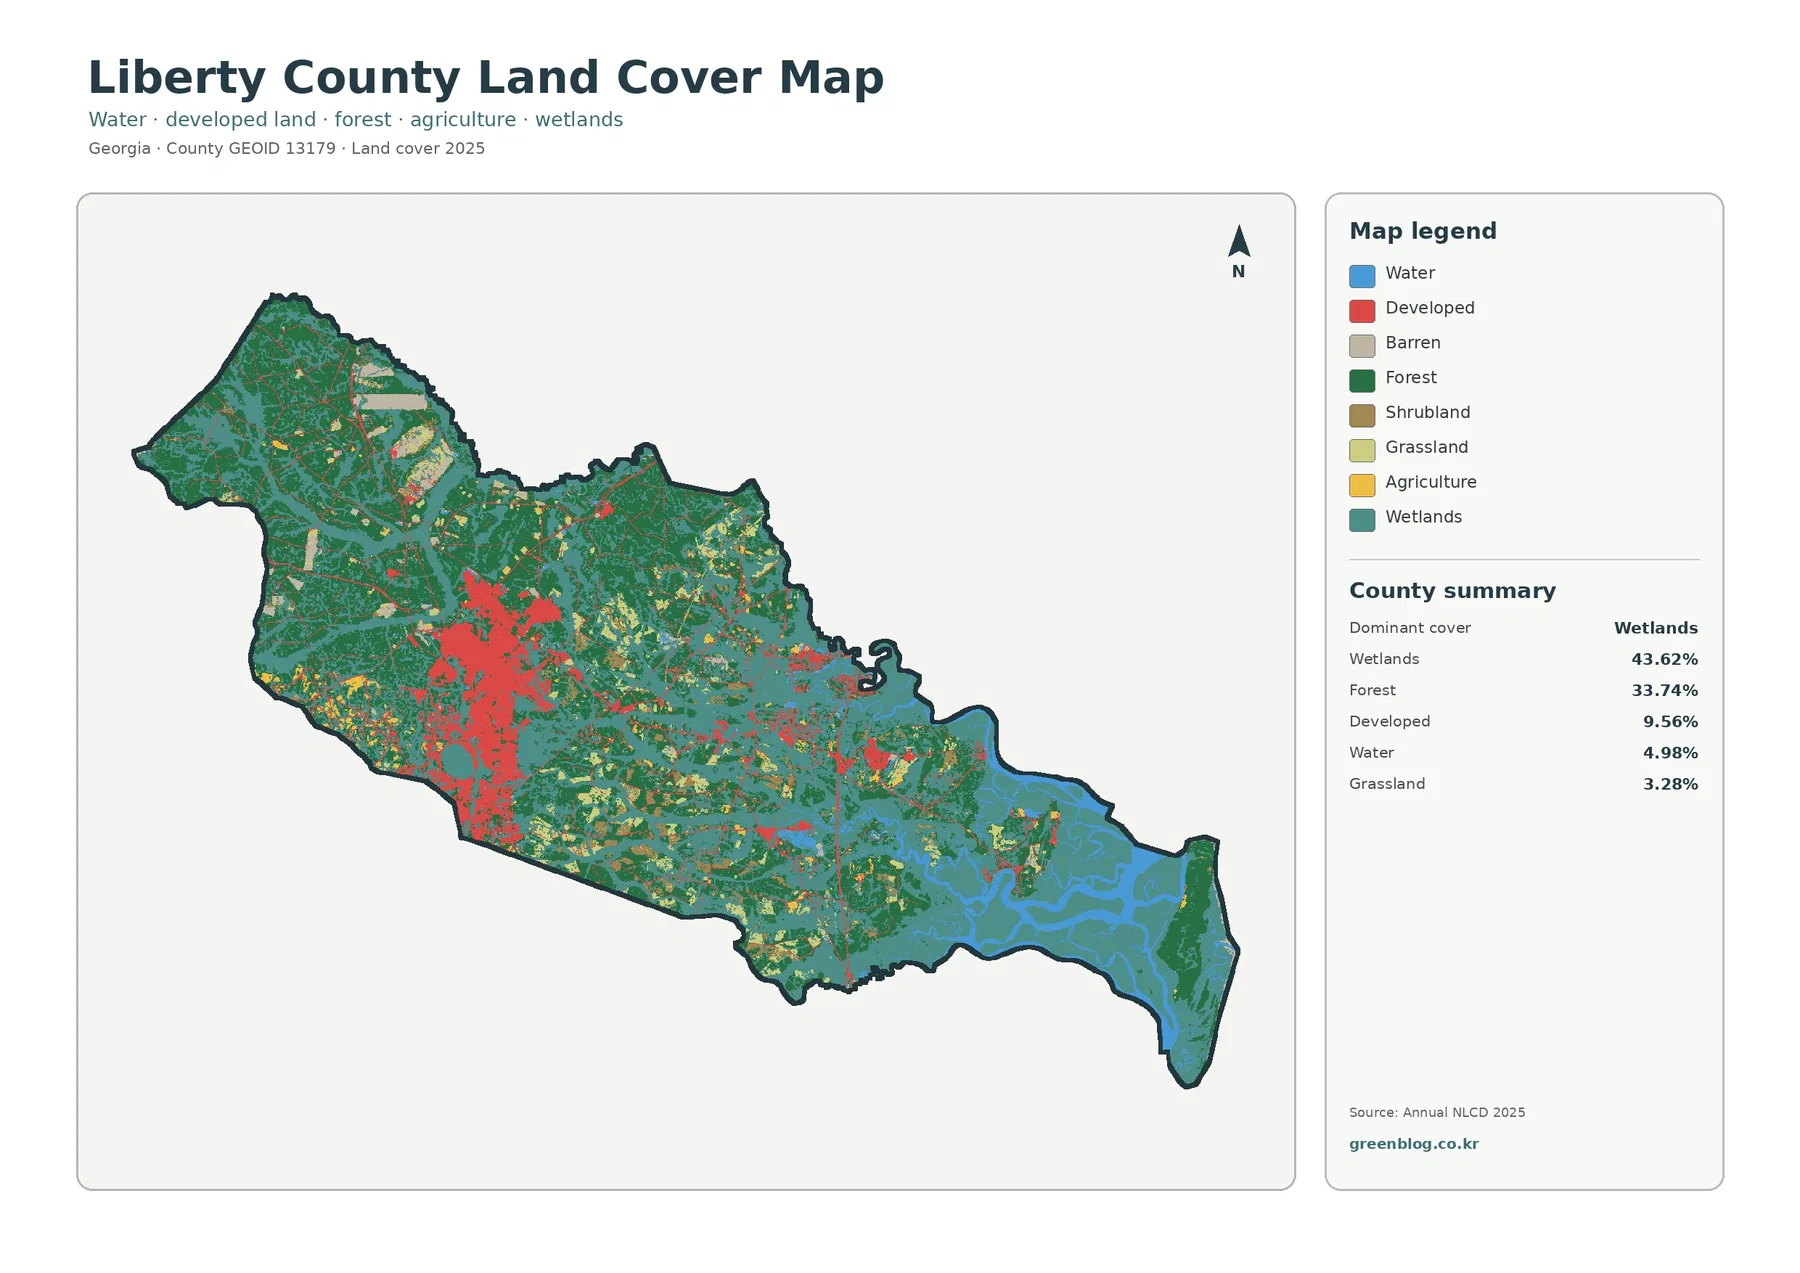
Teal wetland cells dominate the eastern and southeastern portions of the county and extend back toward the center in broad bands and narrow branches. At 43.62%, wetlands are the largest class. Blue open water appears inside and beside those wet areas, especially toward the eastern end. The wetland pattern is therefore much broader than the visible open-water network.
Forest covers 33.74%. Large dark-green blocks occupy much of the northwest and north-central area, with additional wooded sections scattered through the center and east. Forest and wetlands often meet directly rather than forming separate halves of the county. This repeated contact is one of the clearest features of the current map and helps explain why the landscape remains predominantly natural outside the main developed area.
Open water accounts for 4.98%, grassland for 3.28%, shrubland for 2.37%, and agriculture for only 0.94%. The very small agricultural share is notable. Yellow farm cells occur in a few northern, central, and eastern patches, but they never form the broad blocks seen in many inland Georgia counties. A description of Liberty County should therefore lead with wetlands, forest, and development rather than farmland.
The vegetation view shows why agriculture is a minor part of the countywide pattern
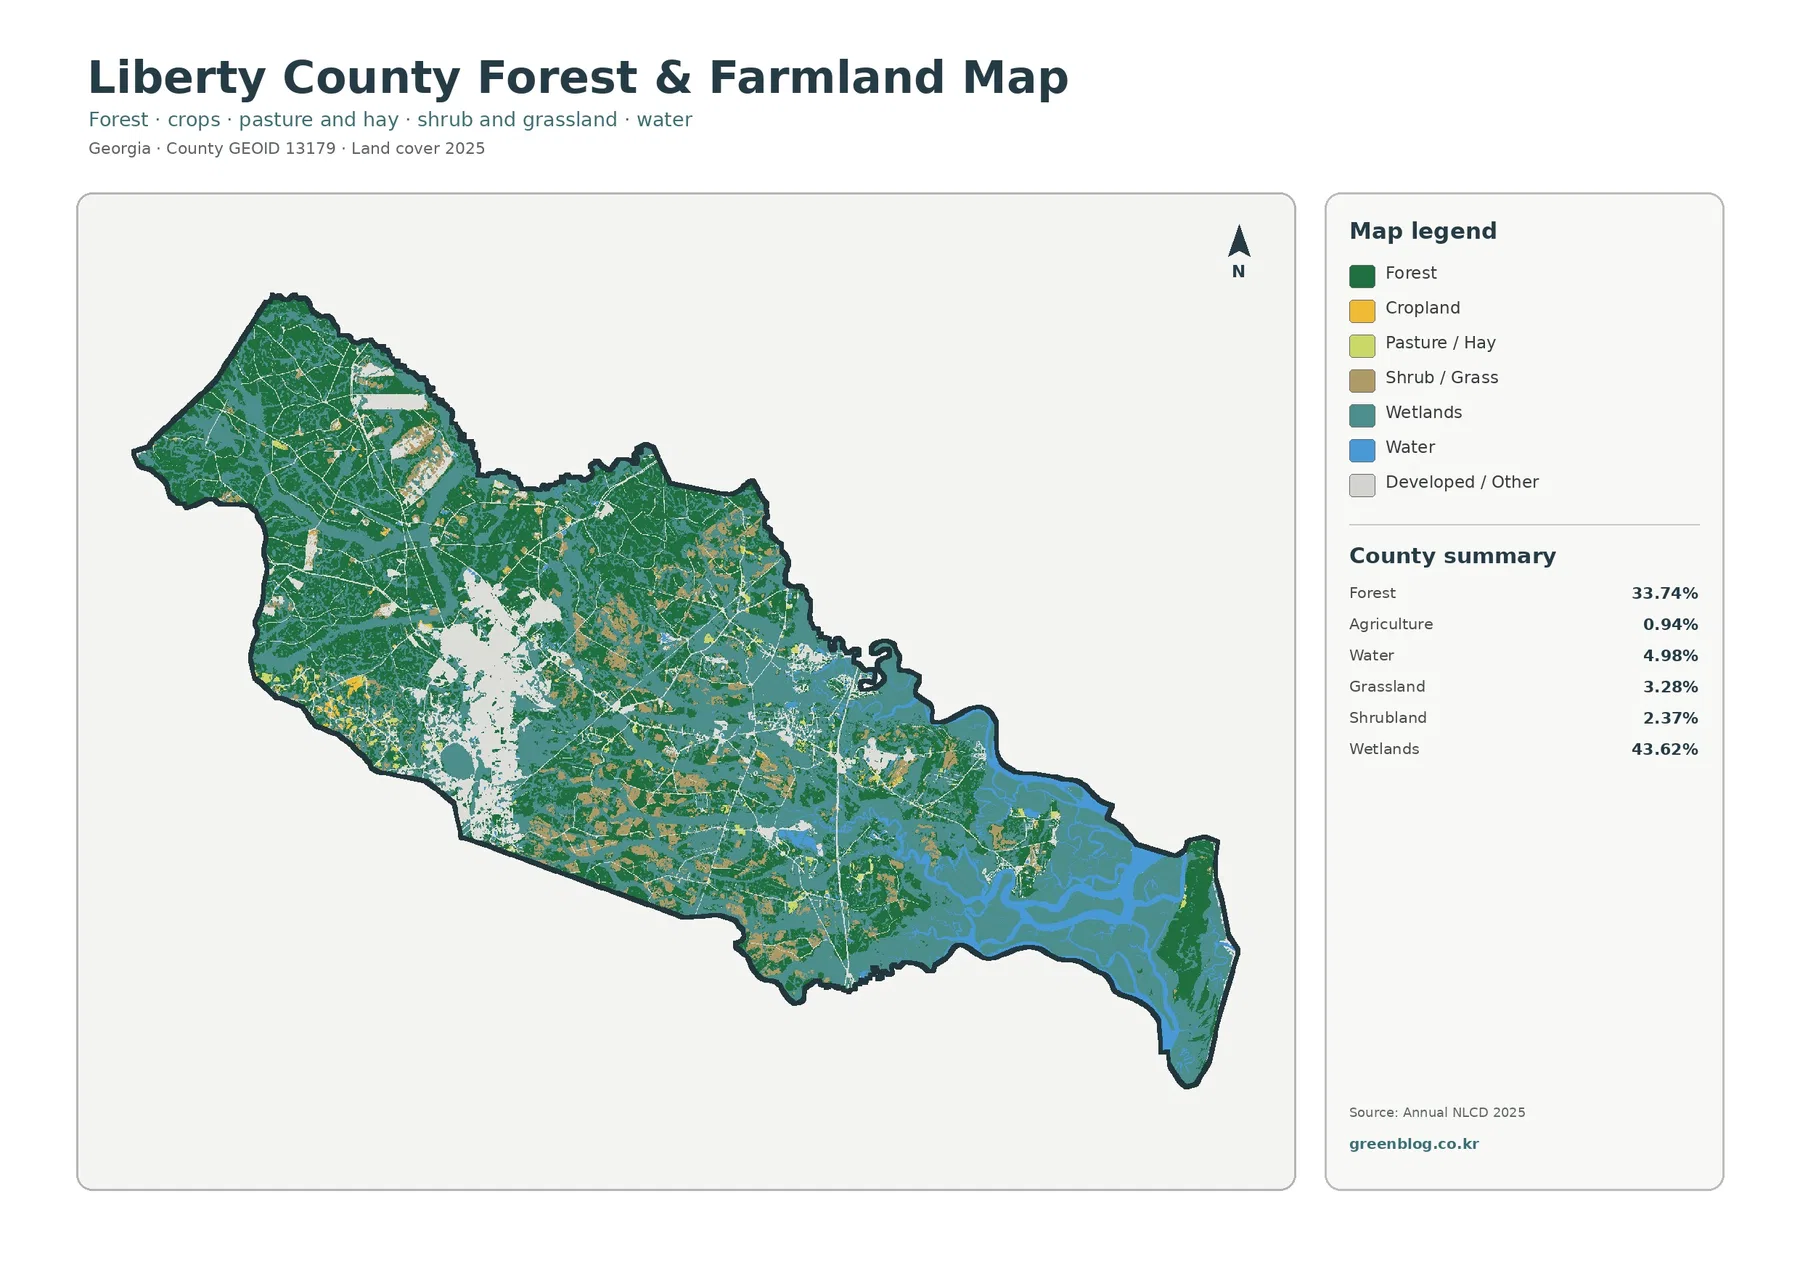
Removing the strong developed colors gives the northern forest blocks more visual weight and makes the wetland network easier to trace. The northwest is largely wooded, while the center and east contain extensive teal areas threaded around forest. The southeastern end is especially dominated by wetlands and water. Smaller grass and shrub patches appear between these larger classes.
Agriculture represents just 0.94%. Small yellow cropland patches appear in a few locations, but they are minor compared with the wetland and forest cover. UGA Extension’s Liberty County program provides local agriculture and natural-resource services, and its recent impact report identifies timber, hay, and corn among leading commodities. That local context is useful, but the map cannot identify a particular timber tract, hay field, or corn field from color alone.
The 1985–2025 endpoint map shows a 16.02% class difference
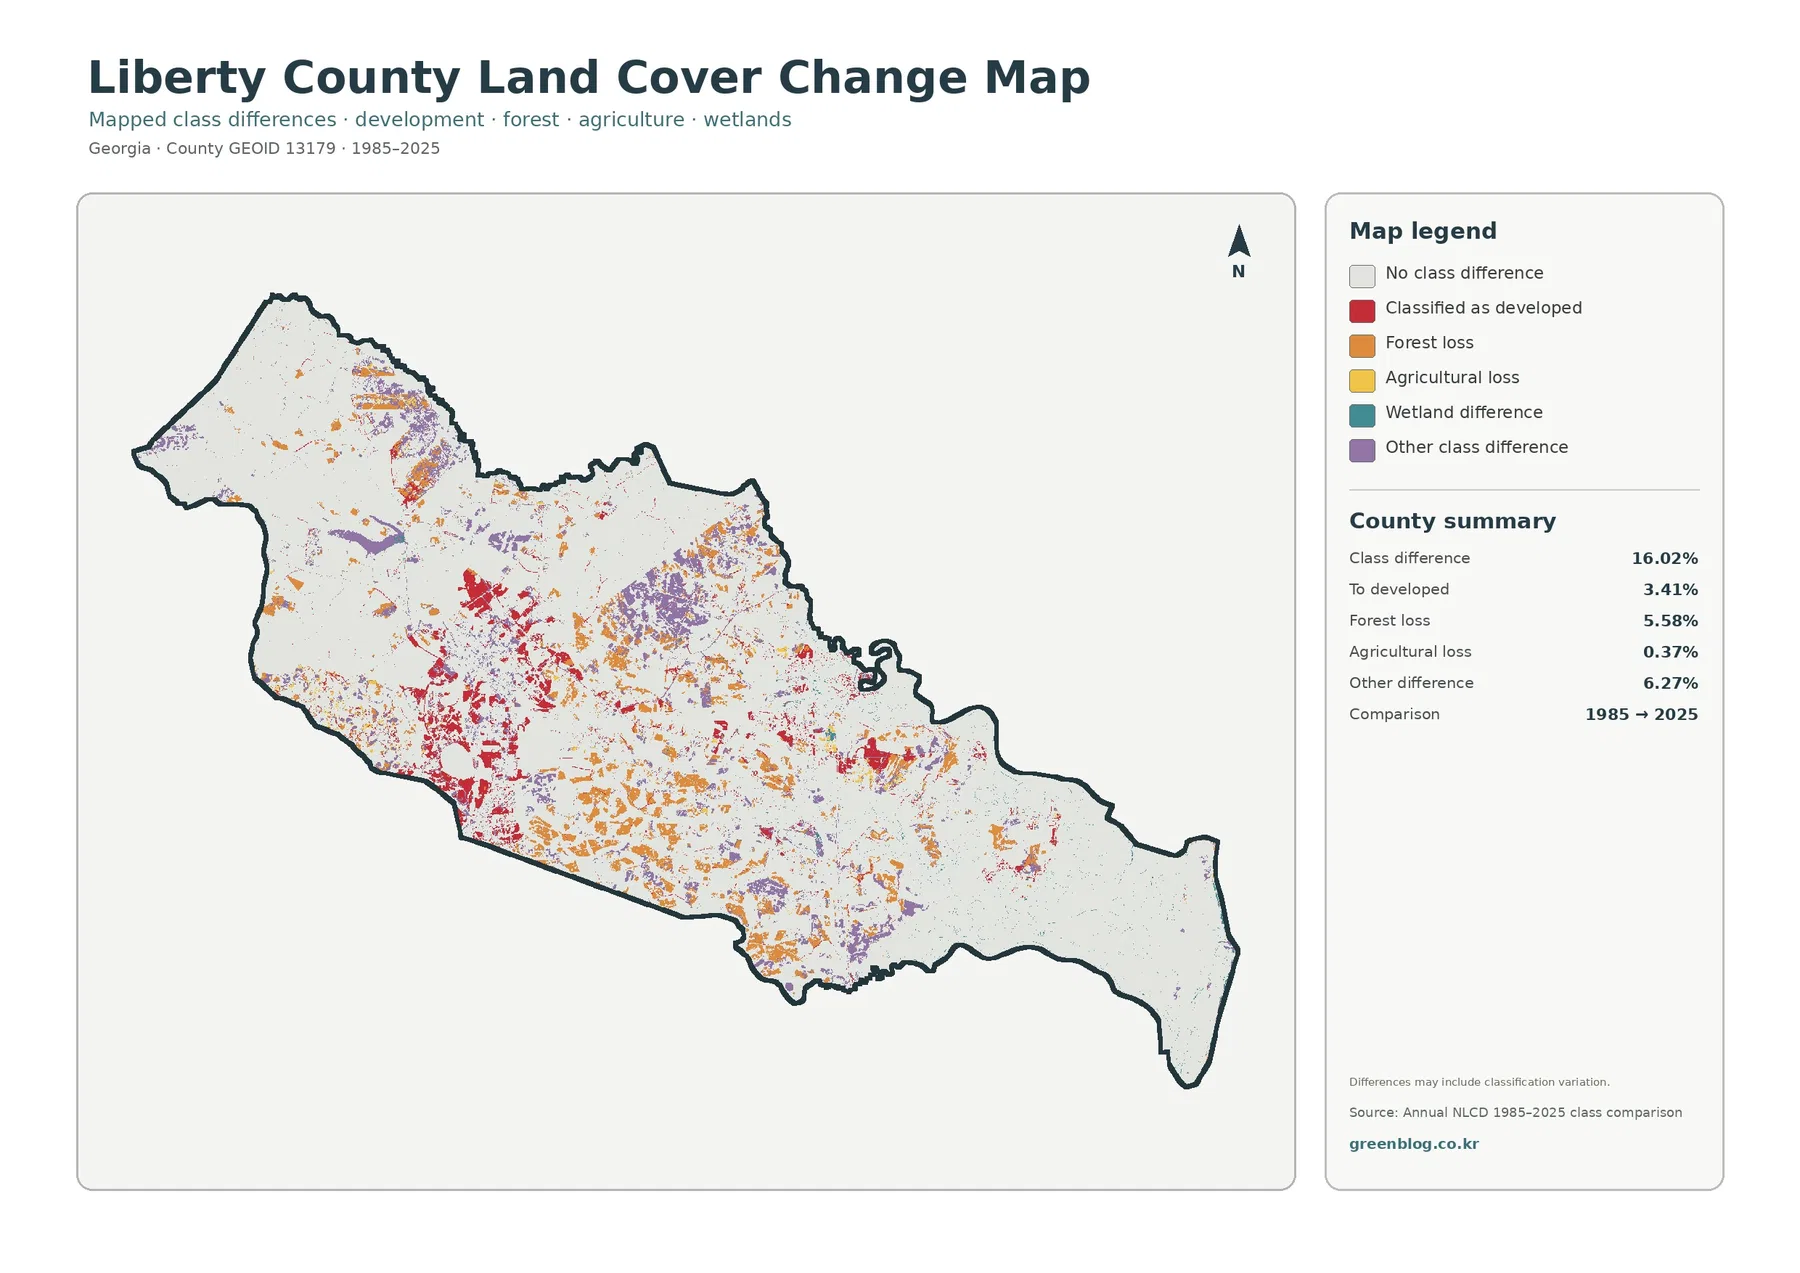
The total class difference between 1985 and 2025 is 16.02%. That percentage is the share of cells assigned different classifications at the two endpoints. It is not the portion of Liberty County that was damaged, cleared, or urbanized. The map itself notes that classification variation may be included, which matters when imagery dates, seasonal conditions, mixed pixels, and classification decisions differ.
The printed summary lists 3.41% classified to developed, 5.58% forest loss, 0.37% agricultural loss, and 6.27% other difference. Red developed-change cells are concentrated most strongly around the western built area and appear again in several smaller clusters farther east. Orange forest-loss and purple other-difference cells are more broadly scattered through the county.
Wetland difference appears in the legend, but no separate percentage is printed in the summary. The missing value should not be reconstructed by subtraction and presented as an official rate. Similarly, “forest loss” means only that a cell classified as forest at the earlier endpoint received another class in 2025. The map does not establish whether harvest, construction, storms, vegetation change, or classification variation caused that difference.
Wetland color is not a regulatory boundary or flood-zone map
Because wetlands cover 43.62% of the county, it is especially important to separate land-cover classification from legal or engineering information. A teal cell reports a surface class derived from remote sensing. It does not establish wetland jurisdiction, a FEMA flood zone, property ownership, a permit restriction, or a survey boundary.
The City of Hinesville GIS page maintains separate resources for updated municipal boundaries, Liberty County future land use, and FEMA flood-zone information. Those tools serve different questions from the Annual NLCD maps. Use the land-cover set for broad environmental context, then move to the appropriate official layer when a property or regulatory decision is involved.
What the four-map JPG download contains
The ZIP contains one JPG for each map discussed above: 2025 land cover, forest and farmland, impervious surface and developed land, and the 1985–2025 land-cover comparison. Using the countywide view first and adding one focused map for the specific question usually produces the clearest presentation.
Frequently Asked Questions
What is the largest land-cover class in Liberty County?
Wetlands are the largest class in the supplied 2025 summary at 43.62%, followed by forest at 33.74%. Together they account for more than three-quarters of the county, while developed land is concentrated mainly in a few built areas.
Why is developed land 9.56% while mean impervious cover is only 2.96%?
Developed classes can contain lawns, trees, yards, and open soil around roads and buildings. Fractional impervious cover isolates roofs, pavement, parking areas, and similar hard surfaces, so its countywide average is much lower than the broader developed share.
Does the 16.02% class difference mean that much of Liberty County was damaged?
No. It is the share of cells assigned different classes at the 1985 and 2025 endpoints. The summary separately lists 3.41% classified to developed, 5.58% forest loss, 0.37% agricultural loss, and 6.27% other difference. Timing and cause require additional evidence.
Sources and Reference Data
- MRLC Annual NLCD Data – official access to annual land-cover and comparison products
- USGS Annual NLCD Land Cover Classification – definitions for wetlands, forest, developed land, and related surface classes
- U.S. Census Bureau TIGER/Line Shapefiles – authoritative geographic layers for county boundaries, places, and road comparison
- City of Hinesville GIS – official municipal-boundary, Liberty County future-land-use, and FEMA flood-zone resources
- Hinesville Development Authority – official city context on Hinesville’s growth and relationship with Fort Stewart
- UGA Extension – Liberty County Agriculture & Natural Resources – local soil, water, agriculture, and natural-resource services
Map File Information
The ZIP contains four original JPG maps for comparing Liberty County's 43.62% wetland cover, 33.74% forest, Hinesville-area development, impervious surfaces, and 1985–2025 class differences.
- Included Files: Use only the versions confirmed in the article and supplied images
- File Type: Use the confirmed download contents
- Intended Use: Printing, education, presentations, and map-based projects
Related Maps
- Appling County Georgia Land Cover Map
- Atkinson County Georgia Land Cover Map
- Bacon County Georgia Land Cover Map
Green Map creates custom-edited map images using open geographic data sources such as geoBoundaries, Natural Earth, OpenStreetMap, and government open data.
These maps are edited visual materials, not raw data files, and are provided for education, documents, presentations, and graphic reference.