Agriculture is the largest surface class in Lee County, covering 41.85% of the supplied 2025 map. Forest accounts for 22.11% and wetlands for 20.76%, while developed land is much smaller at 9.33%. Even so, development is visually prominent because it is concentrated near the central county seat area and along the southern edge of the Albany metropolitan area. This Lee County Georgia Land Cover Map compares that developed pattern with the county’s broad farm, forest, and wetland areas.
Four WebP views appear in the article: current land cover, forest and farmland, fractional impervious surface, and a 1985–2025 endpoint comparison. The four original 2480 × 1754 JPG maps are also available together in one ZIP. They are useful for county profiles, classroom material, presentations, and broad landscape comparison when their 30-meter source scale is respected.
Table of Contents
The hard-surface map separates the Albany-metro edge from the county interior
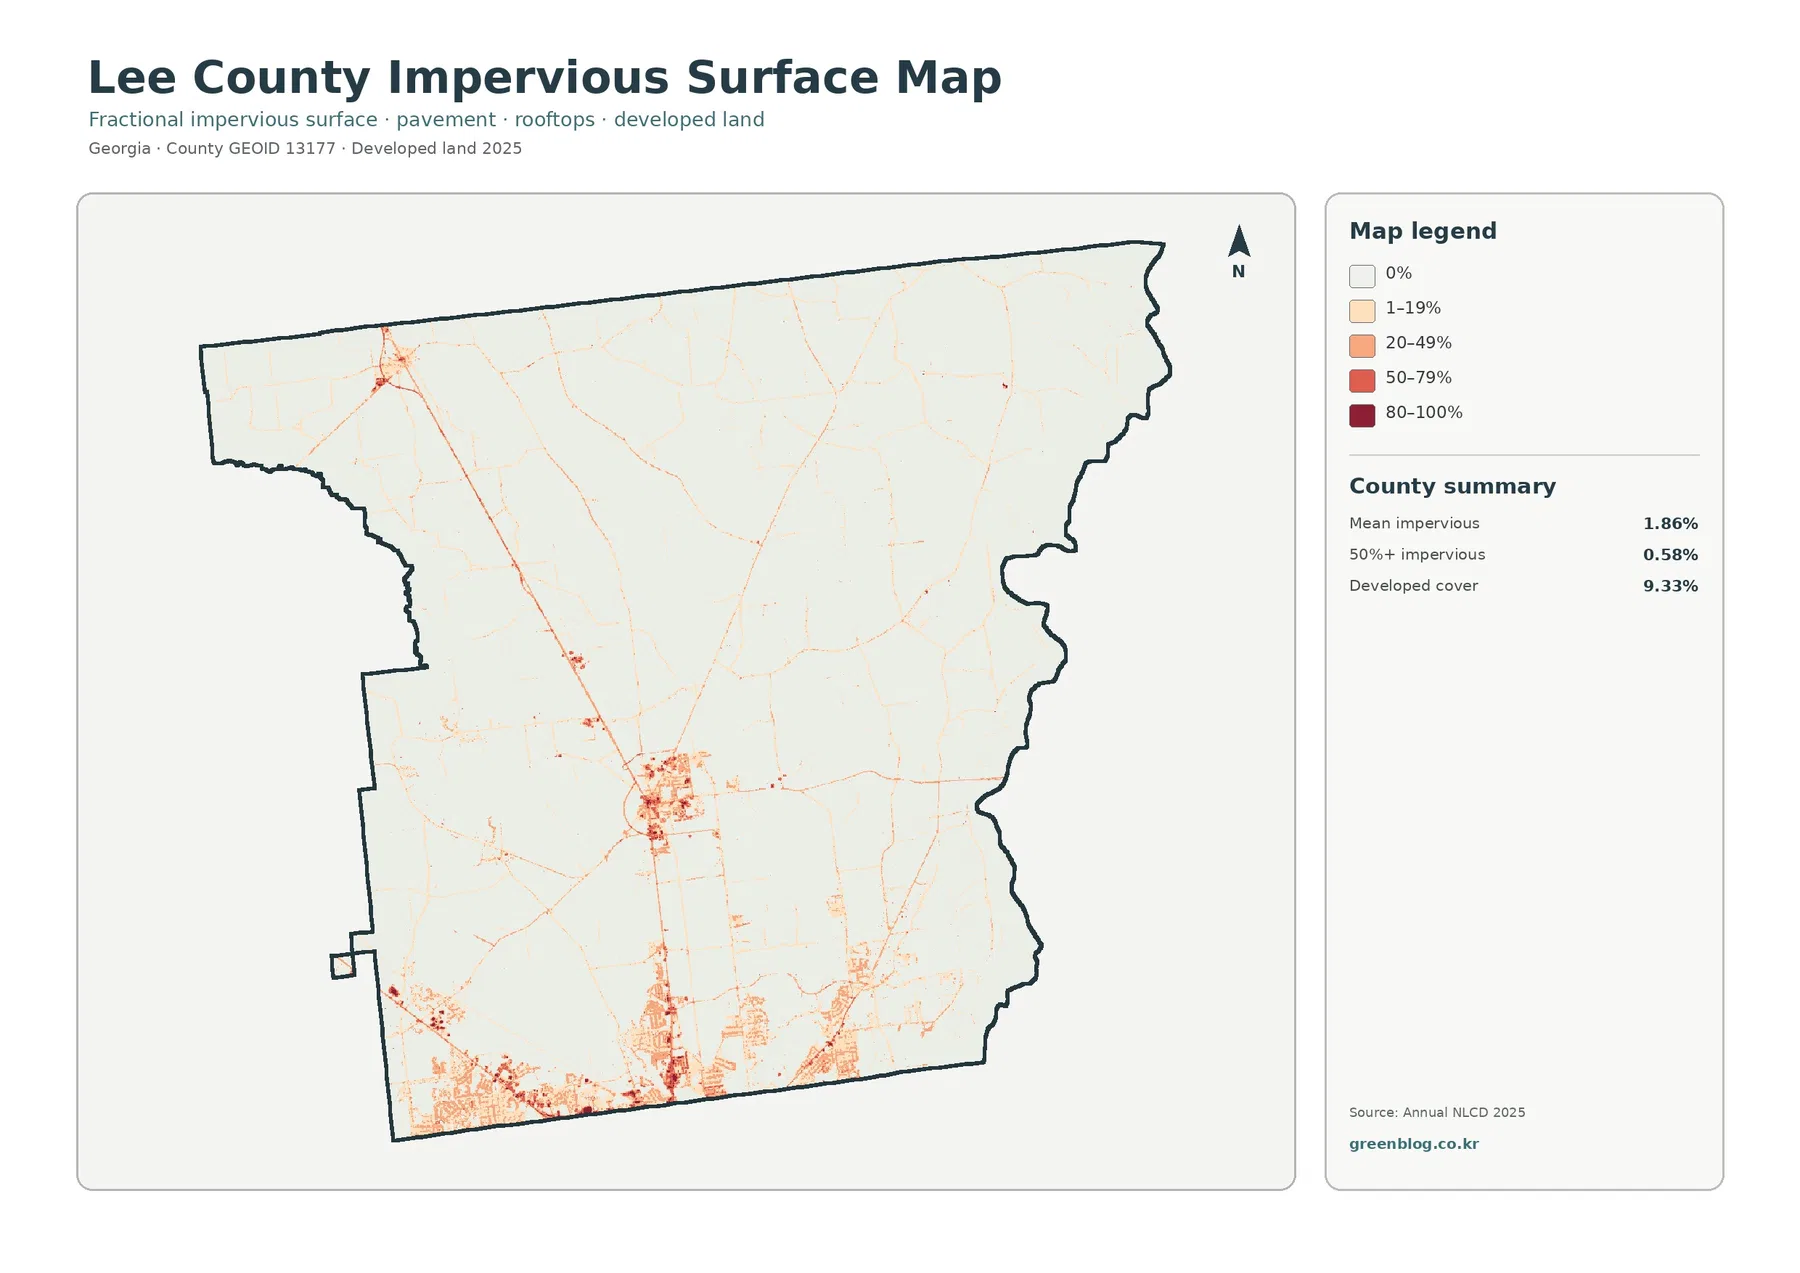
The strongest impervious pattern lies along the southern boundary. Broad patches of medium and high values appear there, with smaller hard-surface concentrations extending northward. A separate compact cluster sits near the middle of the county, and another small concentration appears in the northwest. Large portions of the agricultural interior remain nearly white, showing how sharply built areas contrast with the rural majority.
Lee County government describes the county as part of the Albany metropolitan area and as a place where residential, commercial, and industrial growth exists beside a traditional rural setting. That official context helps explain why the southern edge is more developed than much of the interior. The map itself does not draw the Albany or Dougherty County municipal boundary, so the exact jurisdiction of an individual hard-surface patch must be checked on a separate boundary layer.
Mean impervious cover is 1.86%, and only 0.58% of the county is mapped at 50% impervious surface or higher. Those figures are much lower than the 9.33% developed-land share. A developed class can contain lawns, scattered trees, yards, and open soil around roads and buildings. Fractional impervious cover isolates the roofs, pavement, and parking areas that do not readily absorb water.
Agriculture fills more than two-fifths of the 2025 countywide map
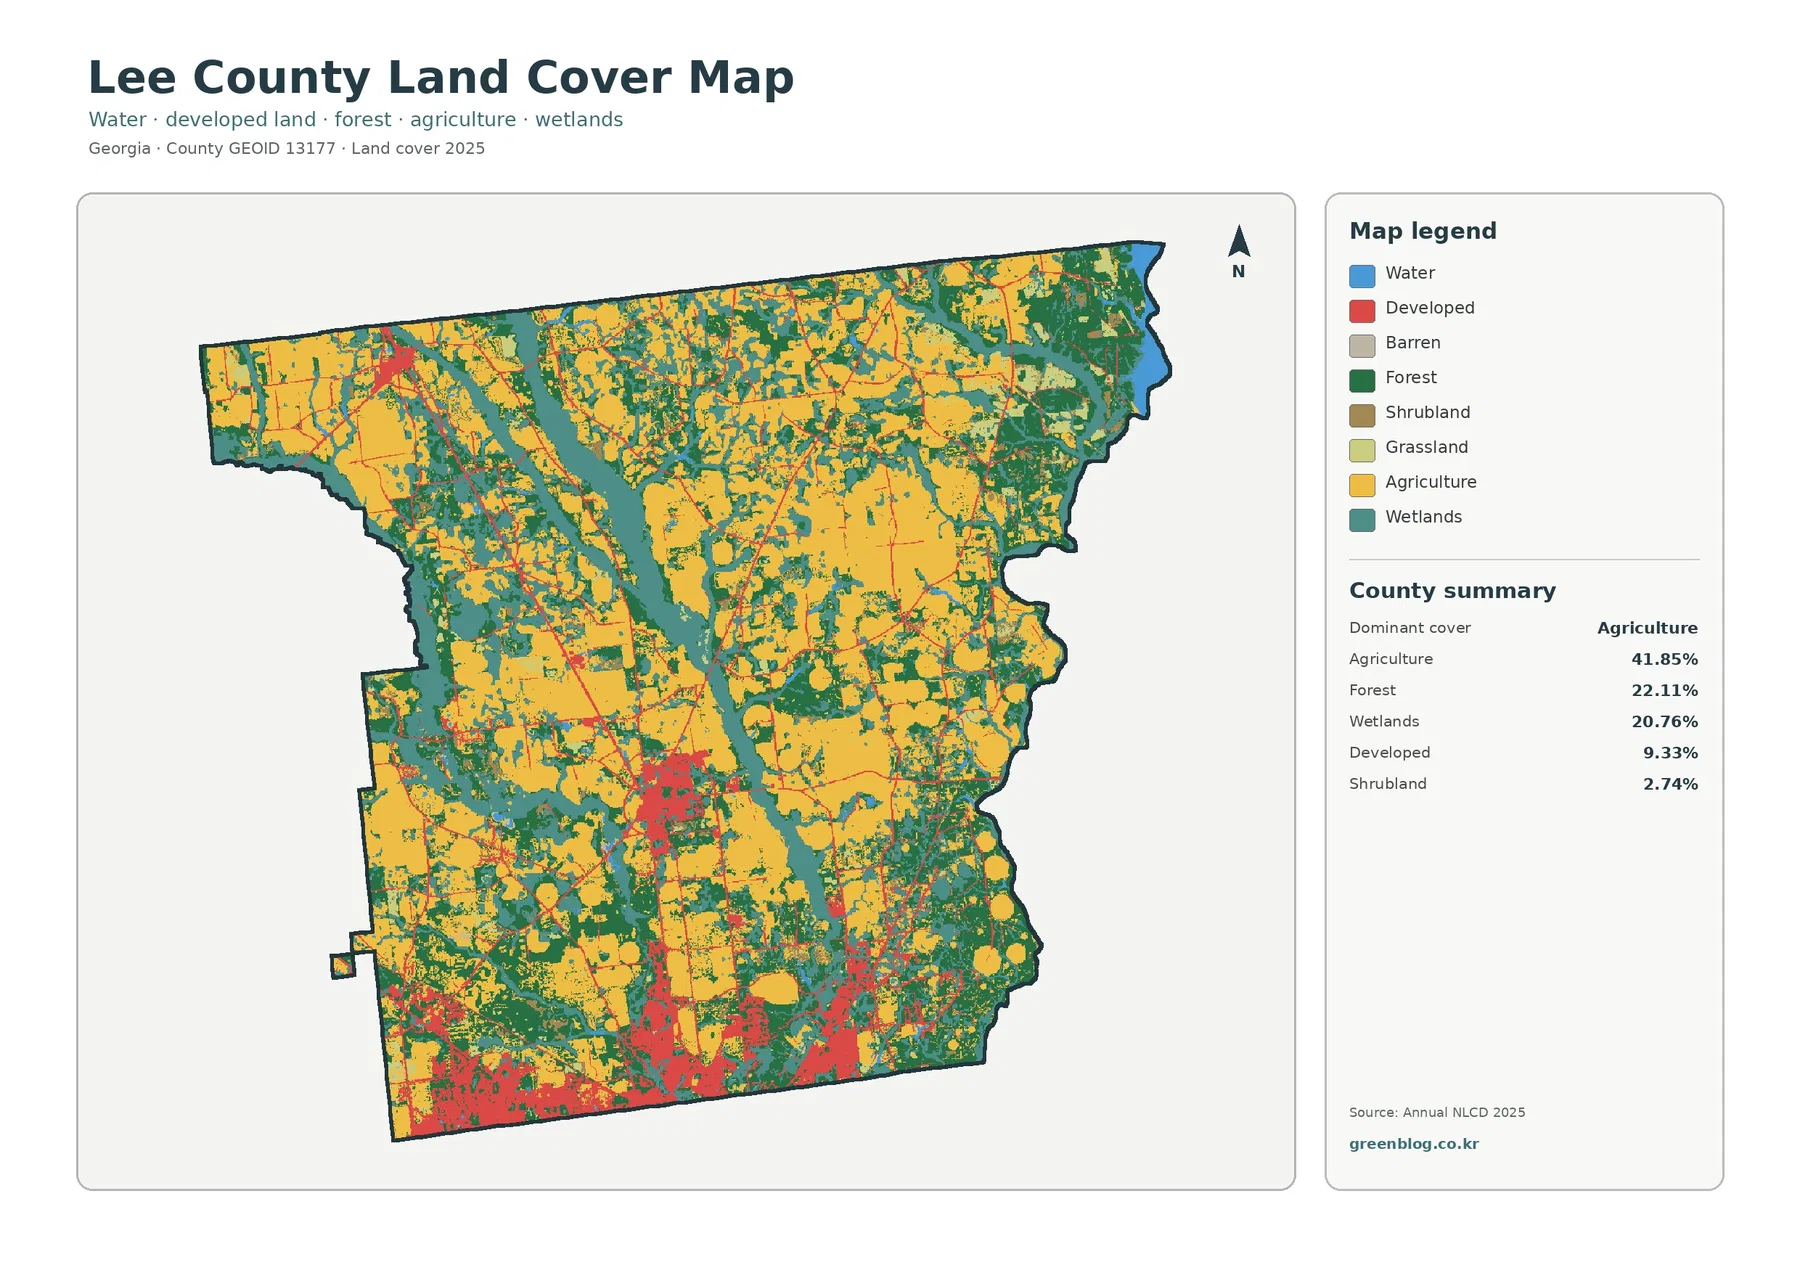
Yellow agricultural areas are widespread rather than confined to one corner. Large farm blocks cover much of the north and east, continue through the center, and reappear between developed areas in the south. At 41.85%, agriculture is nearly twice the forest share and twice the wetland share. The county is therefore best understood first as a working agricultural landscape, not as a suburban county with isolated farmland.
Forest covers 22.11%. Dark green blocks are especially visible along the eastern side, in the northeast, and in scattered central and southwestern areas. These wooded pieces break up large farm fields and often sit beside wetland corridors. Their distribution is important because it prevents the agricultural pattern from becoming one uninterrupted open surface.
Wetlands account for 20.76%, almost matching the forest share. Teal areas form broad north-south and branching patterns through the center and west and appear again along parts of the east. Open water is only 1.16%, so wetland color should not be interpreted as open river or lake surface. Wetland classes can include vegetation and saturated ground, while blue water represents exposed water.
Leesburg and Smithville provide place context without being drawn on the raster
Lee County government identifies Leesburg and Smithville as the county’s two cities, and the 2024 comprehensive plan identifies Leesburg as the county seat. That information makes Leesburg a useful reference for the compact developed concentration near the center of the county. The map does not print city names or municipal outlines, however, so a red or dark impervious cell should not be treated as an exact City of Leesburg boundary.
A smaller developed concentration in the northwest can be discussed as part of the northern settlement pattern, but it should not be labeled Smithville from the land-cover image alone. Place assignment requires a verified city or road layer. This is an important distinction because land cover reports the predominant surface type, while a political map reports legal jurisdiction and place names.
The vegetation-focused map clarifies how farms, woods, and wetlands share rural space
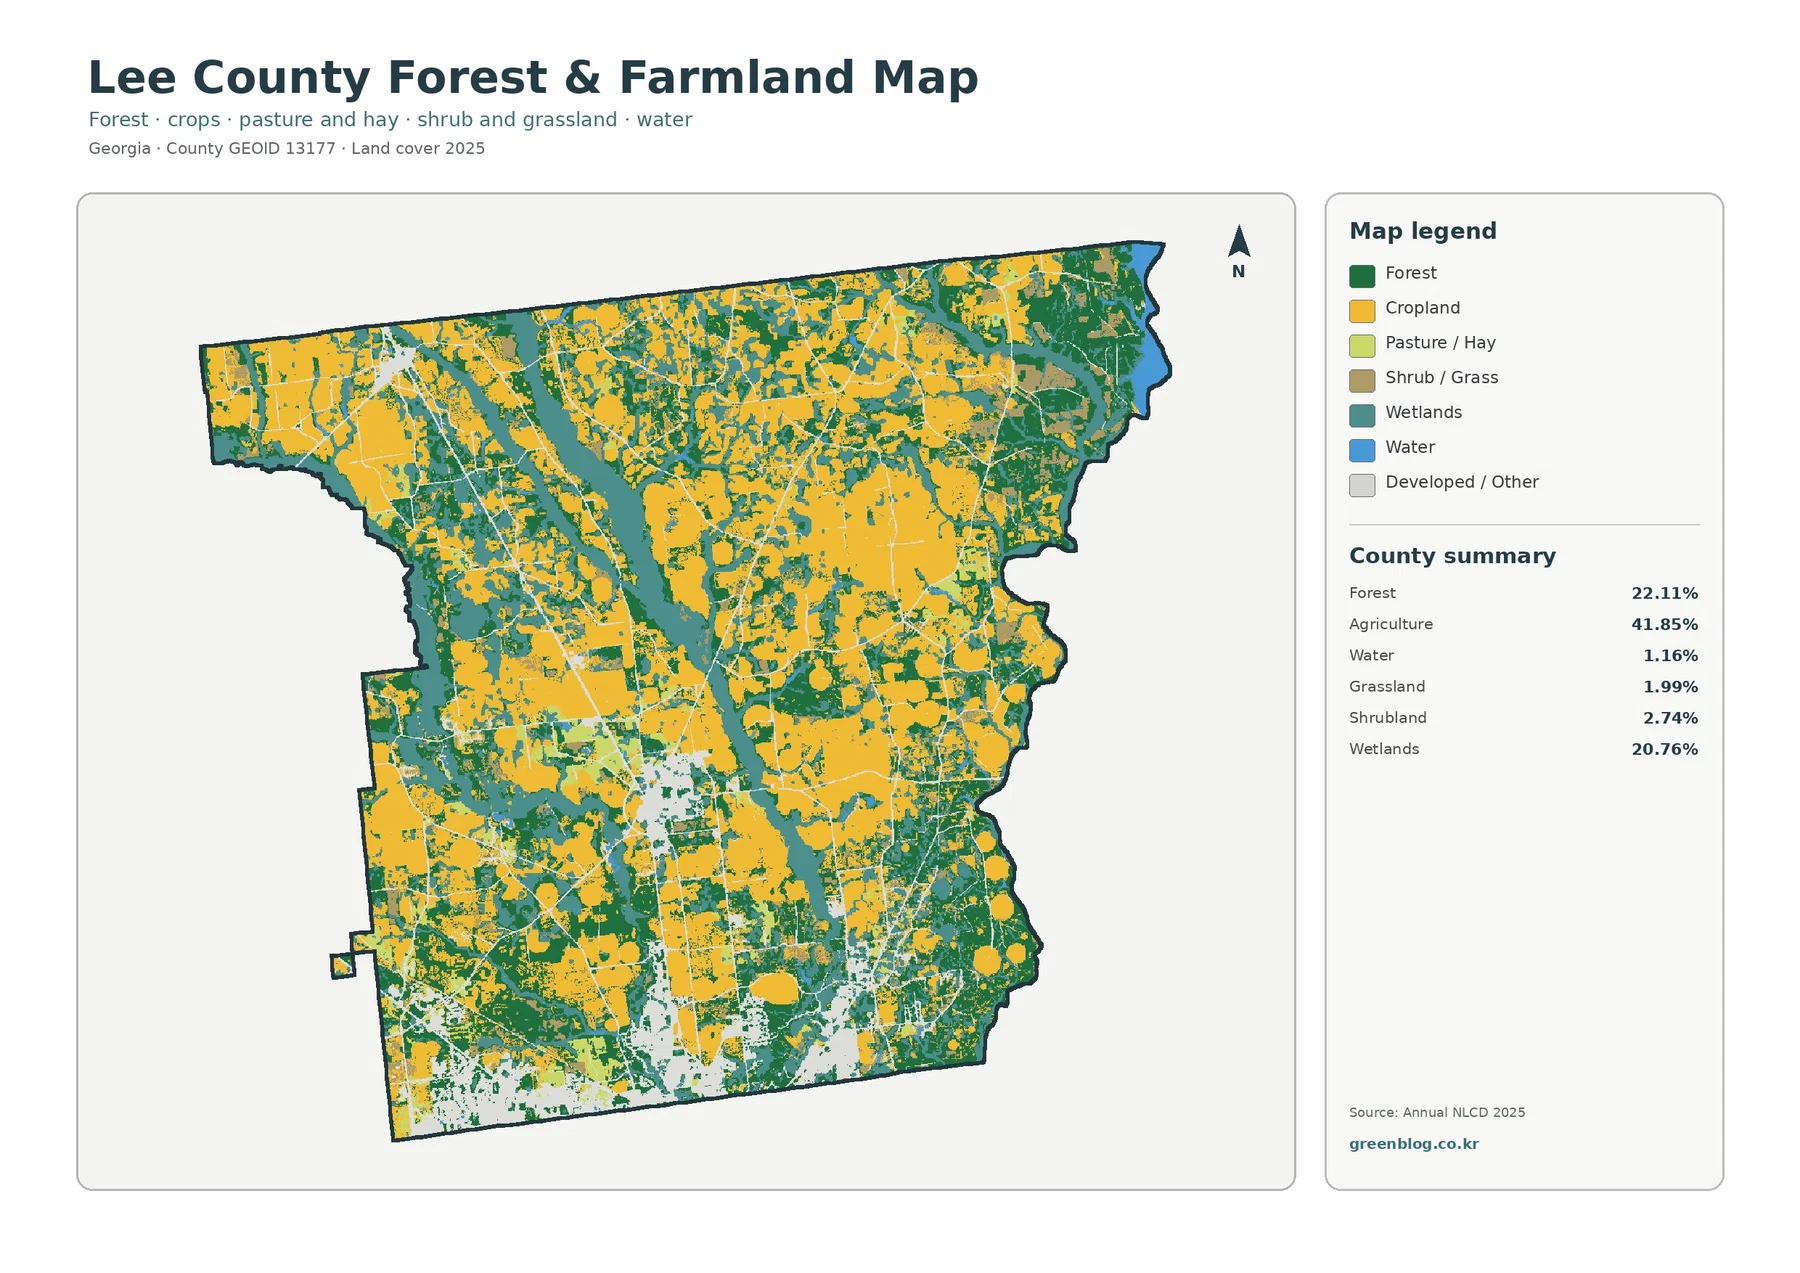
Reducing the developed colors makes the agricultural dominance even clearer. Cropland forms large yellow blocks across the north, east, and central portions, while forest and wetlands repeatedly interrupt those fields. The western half contains more complex wetland patterns, and the eastern edge contains several substantial forest blocks. The resulting landscape is a patchwork rather than a single broad crop plain.
UGA Extension’s Lee County office supports commercial agriculture through production meetings and field assistance. Its recent county impact material specifically mentions cotton, peanuts, grains, and pecans. That local information confirms the importance of agriculture in the county, but it does not allow individual yellow cells to be labeled by crop. Annual NLCD groups surface cover into broad classes rather than producing a crop-by-crop inventory.
The 1985–2025 comparison shows 21.47% class difference, with agriculture loss the largest listed component
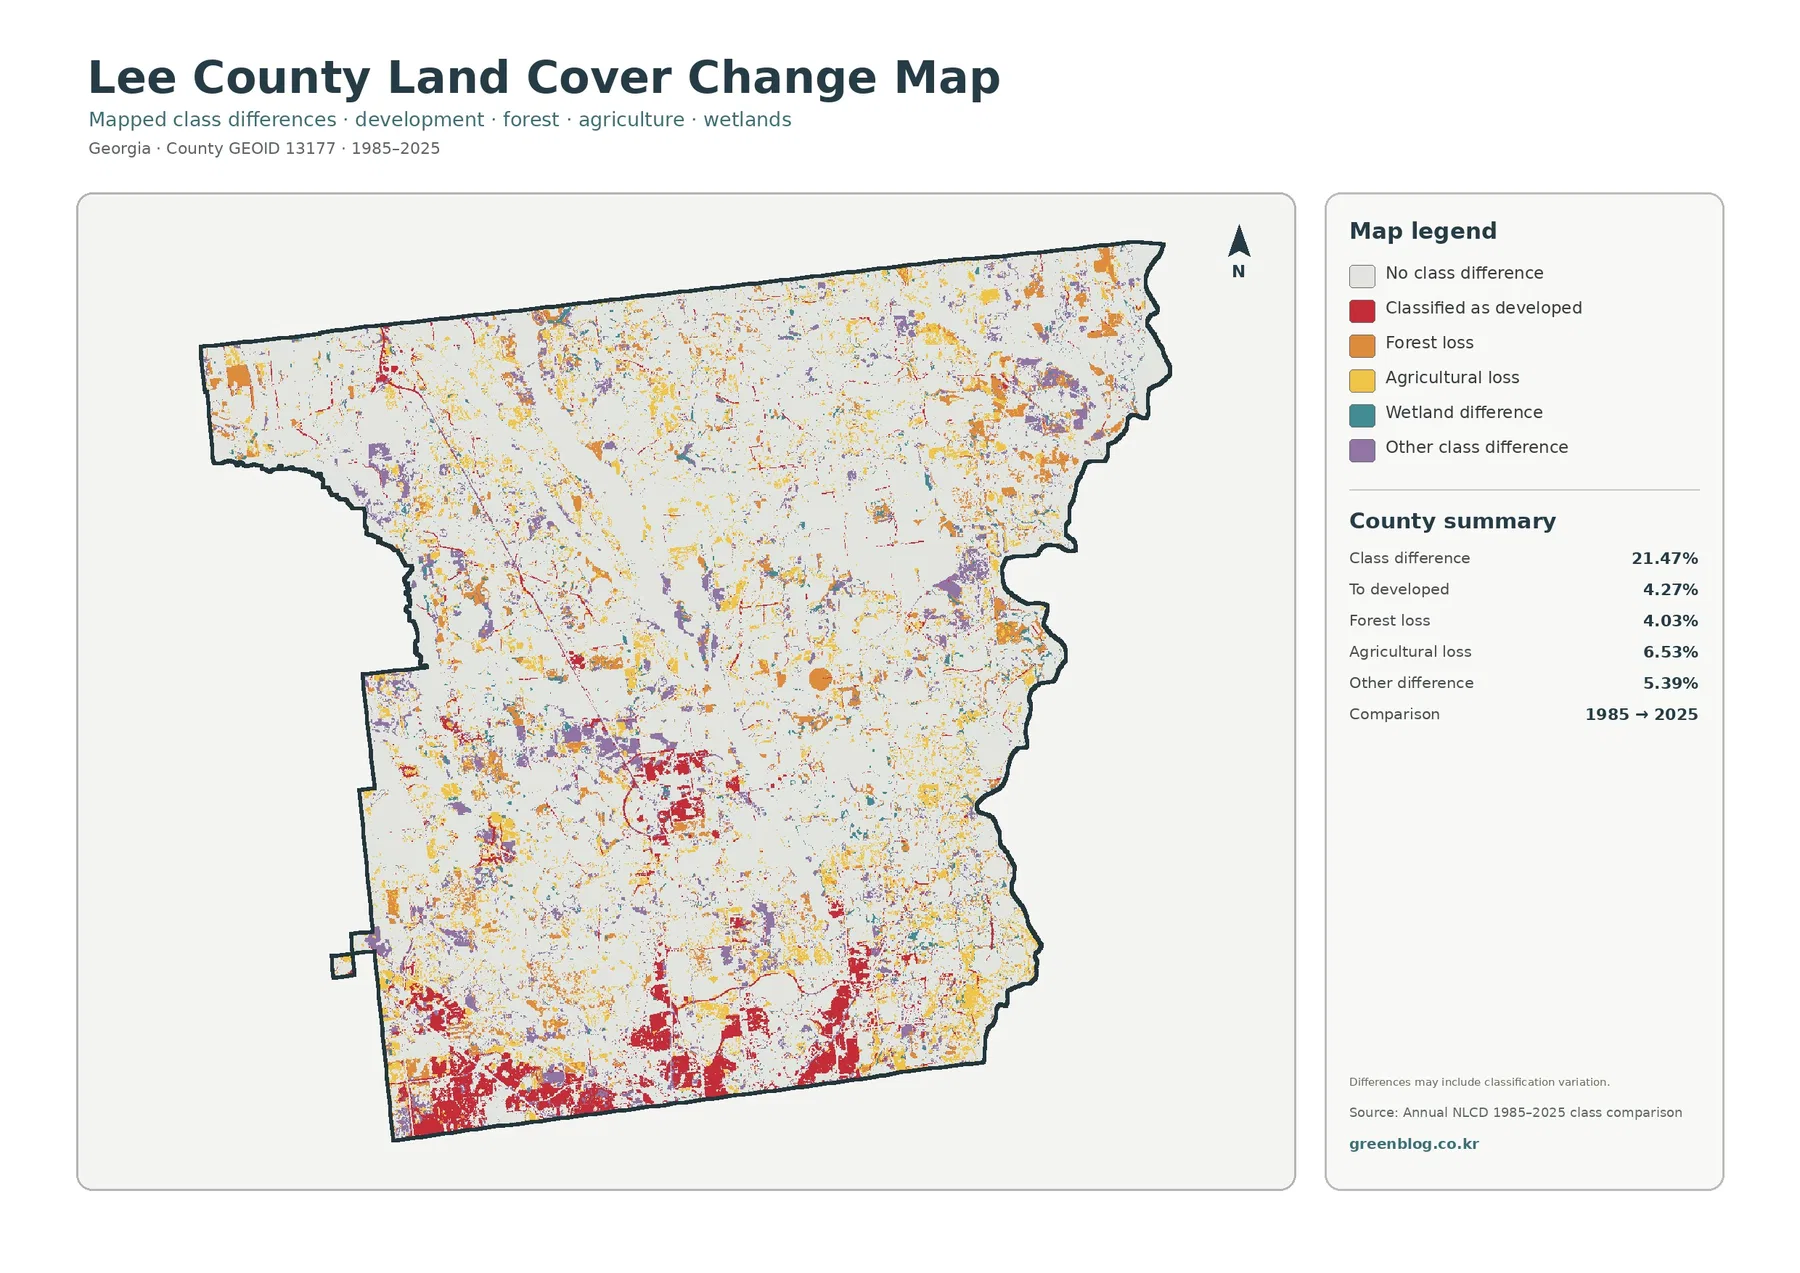
The total class difference between the two endpoints is 21.47%. That percentage describes cells assigned different classes in 1985 and 2025. It does not mean that 21.47% of Lee County was damaged, cleared, or permanently transformed. The map also warns that classification variation may be included, which matters when imagery date, seasonal conditions, mixed pixels, and model decisions differ.
The printed summary lists 6.53% agricultural loss, 4.27% classified to developed, 4.03% forest loss, and 5.39% other difference. Red developed-change cells are concentrated most strongly along the southern edge and around the central built cluster. Agricultural-loss and forest-loss colors are more dispersed through the interior, so the map does not support describing the county’s long-term difference as development alone.
Download the four original JPG map views
Start with the 2025 land-cover map when you need one image that summarizes agriculture, forest, wetlands, and developed areas. Use the vegetation view for a closer rural comparison, the impervious map for roofs and pavement, and the endpoint map when discussing 1985–2025 class differences. Keeping each view tied to one question makes the figures easier to explain.
Frequently Asked Questions
What is the largest land-cover class in Lee County?
Agriculture is the largest class in the supplied 2025 summary at 41.85%. Forest follows at 22.11% and wetlands at 20.76%, so most of the county is a mix of working farmland, wooded areas, and wet ground rather than developed land.
Why is developed land 9.33% while mean impervious cover is only 1.86%?
Developed classes can include lawns, trees, yards, and bare soil around roads and buildings. Fractional impervious cover isolates rooftops, pavement, parking areas, and similar hard surfaces, so its countywide average is much lower than the broader developed share.
Does the 21.47% class difference mean that much of Lee County was damaged?
No. It is the share of cells assigned different classes at the 1985 and 2025 endpoints. The summary separately lists 6.53% agricultural loss, 4.27% classified to developed, 4.03% forest loss, and 5.39% other difference. Timing and cause require additional evidence.
Sources and Reference Data
- MRLC Annual NLCD Data – official access to annual land-cover and comparison products
- USGS Annual NLCD Land Cover Classification – definitions for agriculture, forest, wetlands, developed land, and related surface classes
- U.S. Census Bureau TIGER/Line Shapefiles – authoritative geographic layers for county boundaries, places, and road comparison
- Lee County Government – About – official context on the Albany metropolitan area, rural setting, growth, and county history
- UGA Extension – Lee County Impact – local agriculture context including cotton, peanuts, grains, pecans, and a large suburban population
Map File Information
The ZIP contains four original JPG maps for comparing Lee County's 41.85% agricultural cover, forest and wetlands, Leesburg and the Albany-metro development edge, impervious surfaces, and 1985–2025 class differences.
- Included Files: Use only the versions confirmed in the article and supplied images
- File Type: Use the confirmed download contents
- Intended Use: Printing, education, presentations, and map-based projects
Related Maps
- Appling County Georgia Land Cover Map
- Atkinson County Georgia Land Cover Map
- Bacon County Georgia Land Cover Map
Green Map creates custom-edited map images using open geographic data sources such as geoBoundaries, Natural Earth, OpenStreetMap, and government open data.
These maps are edited visual materials, not raw data files, and are provided for education, documents, presentations, and graphic reference.