Forest and agriculture account for most of Lamar County in the supplied 2025 data. Forest covers 48.44%, agriculture 25.90%, and developed land 10.88%. The largest built concentration sits in the central-southern part of the county around the Barnesville area, while farm blocks and wooded tracts continue around it. This Lamar County Georgia Land Cover Map explains that mixed rural pattern without treating the county as one uniform surface.
The page includes current land cover, a forest-and-farmland view, fractional impervious surface, and a 1985–2025 endpoint comparison. Their WebP images can be read with the discussion, and the four original 2480 × 1754 JPG maps are available together in one ZIP. They are suited to county profiles, classroom work, presentations, and broad environmental comparison when used at the map’s intended scale.
Table of Contents
Forest leads the county, but farm blocks keep the map visually mixed
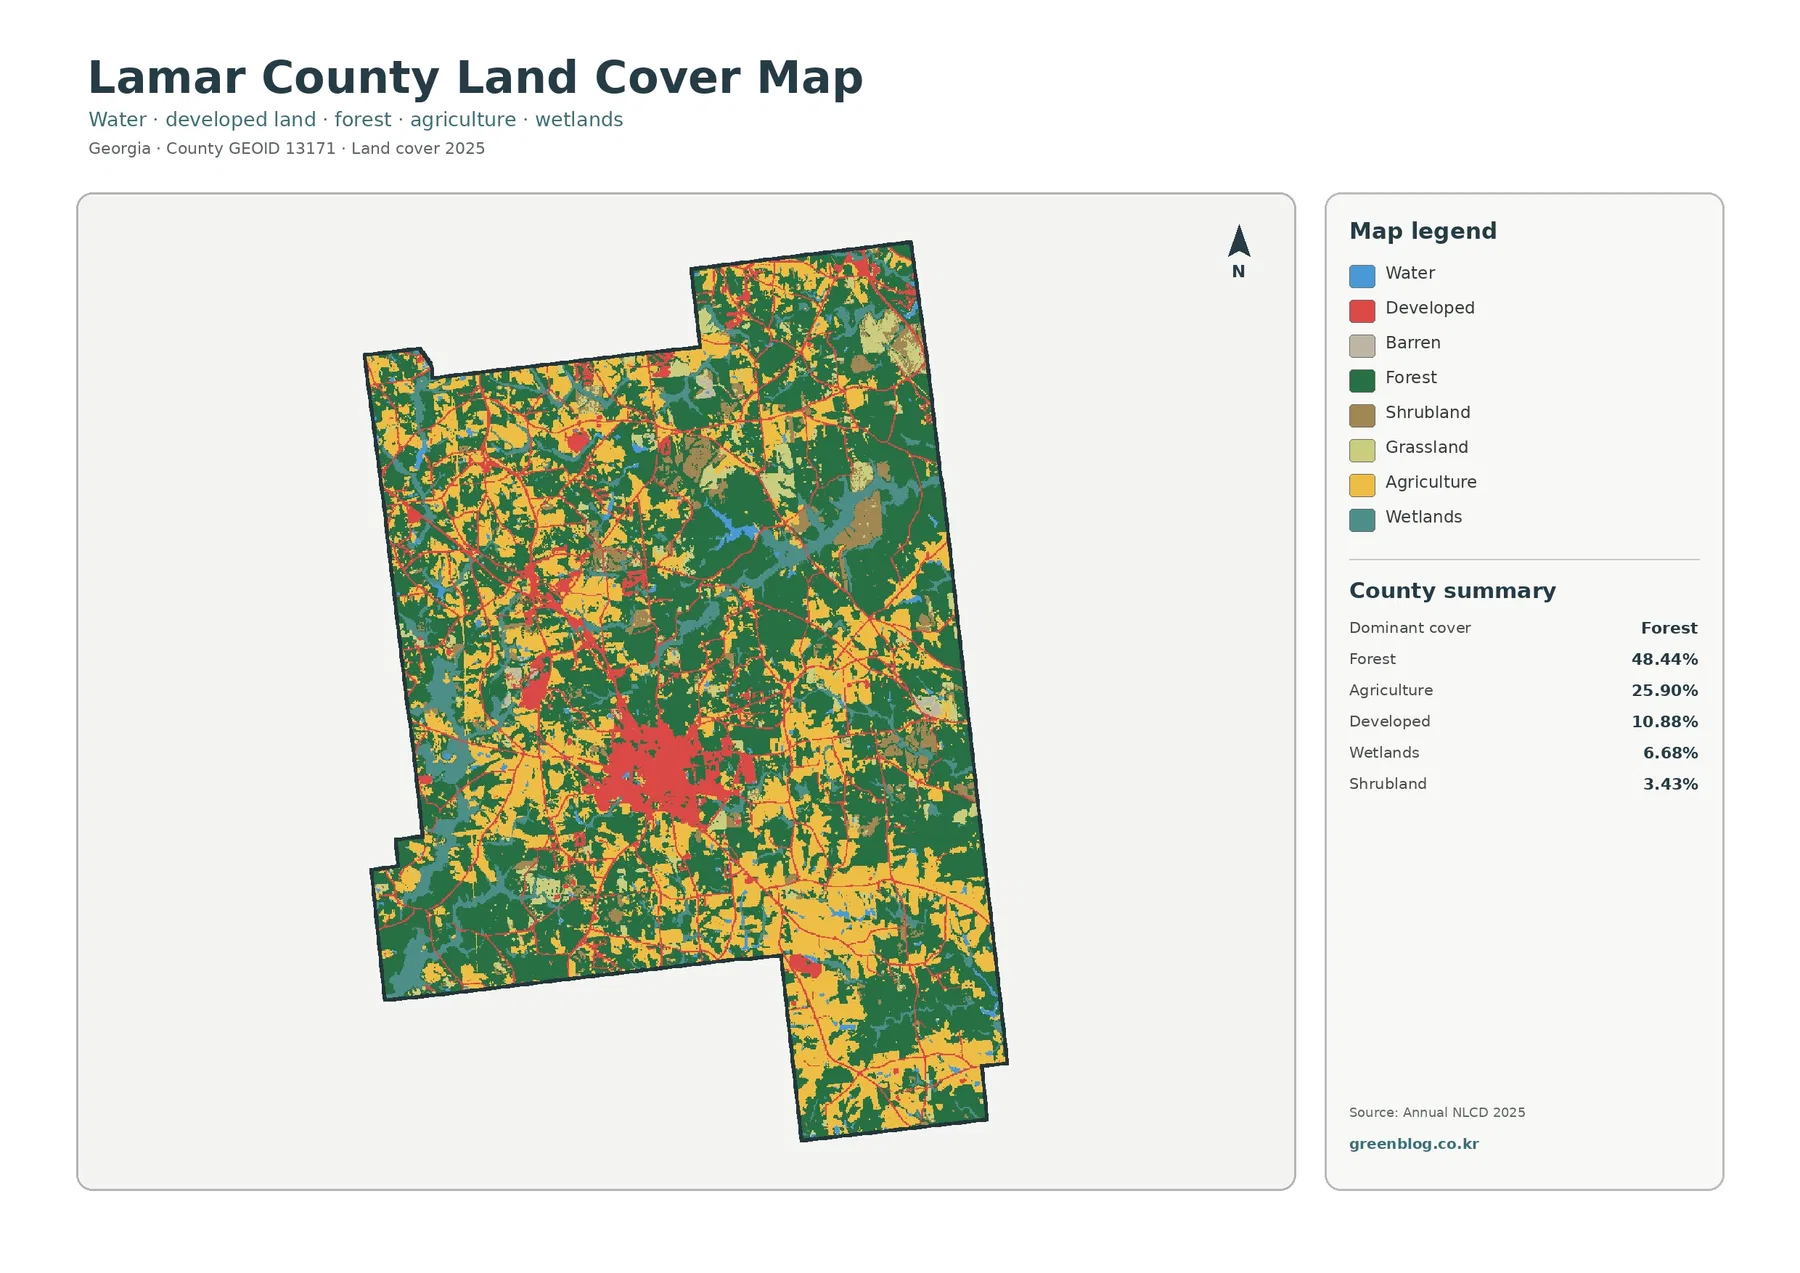
Dark green forest occupies large sections of the county, especially toward the east and northeast, and it also forms broad blocks in the southwest and around the central area. At 48.44%, forest is the largest single class, yet the county does not read as an uninterrupted wooded mass. Yellow agricultural cells break the forest frequently, red development forms a strong central cluster, and teal wetland areas appear in several lower and western sections.
Agriculture covers 25.90%. Larger yellow blocks are common in the southern and southeastern portions of the county, while smaller farm patches occur farther north and west. The pattern is dispersed rather than one continuous agricultural plain. Forest and agriculture repeatedly meet along irregular edges, which makes the countywide image useful for showing where wooded and open working landscapes alternate over short distances.
Developed land represents 10.88%. Its percentage is much smaller than forest or agriculture, but concentration makes it easy to notice. A broad red cluster occupies the central-southern portion, with thin red lines radiating outward. Smaller clusters and linear traces appear in the north and west. The county is therefore better described as a rural forest-and-farm landscape organized around one primary built center and several smaller developed corridors.
Lamar County government lists Barnesville and Milner as the county’s cities, and county administration and the UGA Extension office are located in Barnesville. Those official references make Barnesville a useful place name for the largest central-southern built concentration. The supplied maps do not print municipal boundaries, so individual red cells should not be treated as a precise City of Barnesville outline.
Wetlands account for 6.68%, shrubland 3.43%, and the vegetation-focused map reports 3.22% grassland and 1.24% open water. These smaller categories matter because they interrupt the two dominant classes. Teal wetlands are especially noticeable in the west and southwest and in branching patches elsewhere. Blue open water is much less extensive, which is expected because wetland vegetation and open water are mapped as different surface types.
The vegetation view separates southern farm blocks from larger eastern woods
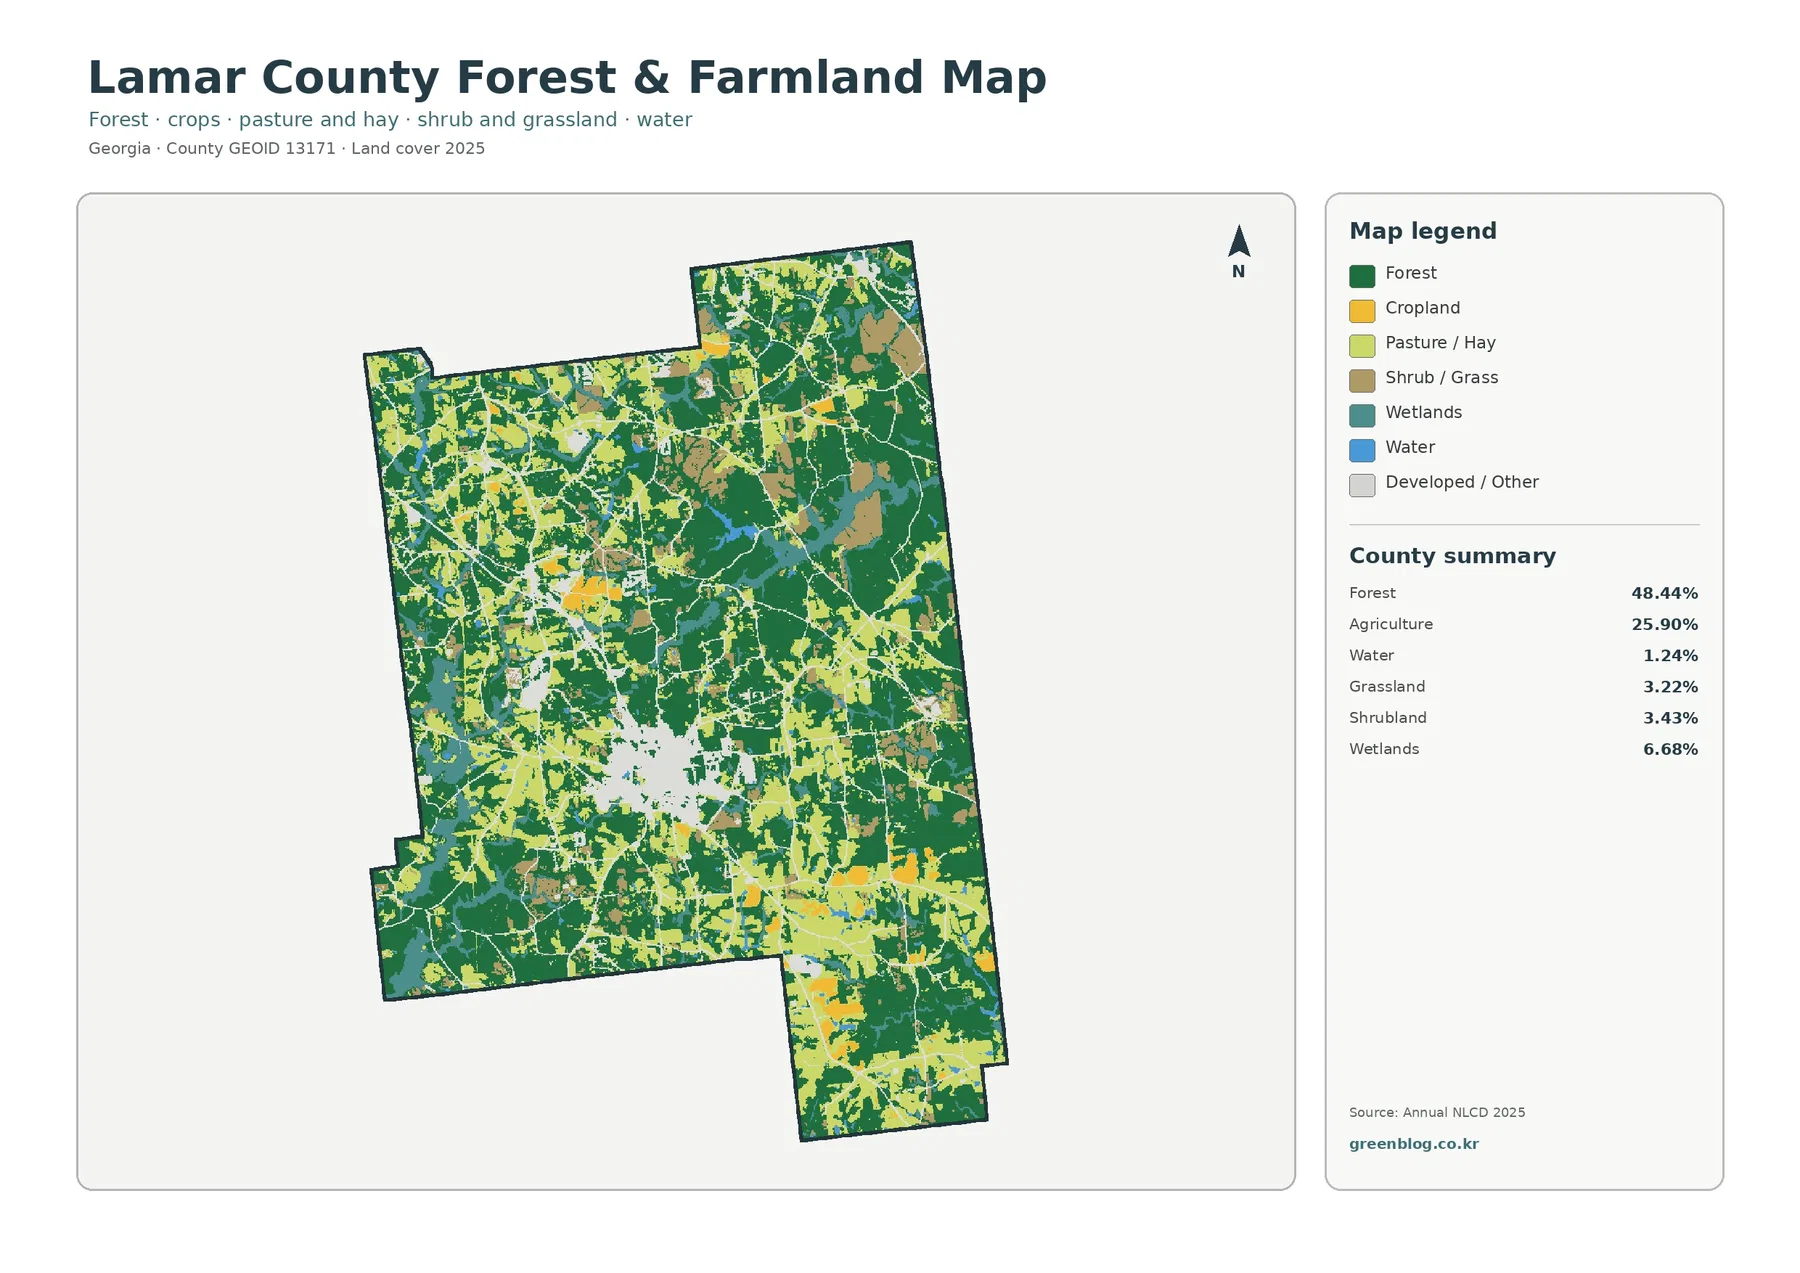
With the strong developed color reduced, the county’s rural structure becomes easier to follow. Large forest blocks dominate much of the east and northeast. The south and southeast contain more broad agricultural patches, while the center and west show a finer mixture of forest, cropland, pasture or hay, shrub and grass cover, wetlands, and the remaining developed or other surfaces.
The map distinguishes cropland from pasture or hay, which helps explain the 25.90% agriculture total. Yellow cropland forms some of the larger open blocks, especially in the south. Light green pasture or hay is more dispersed and often lies beside forest, development, or other agricultural areas. Together they show that the county’s agricultural surface is not one visually uniform class even though it is summarized under a single agriculture percentage in the countywide view.
Impervious cover reveals where the developed share becomes actual hard surface
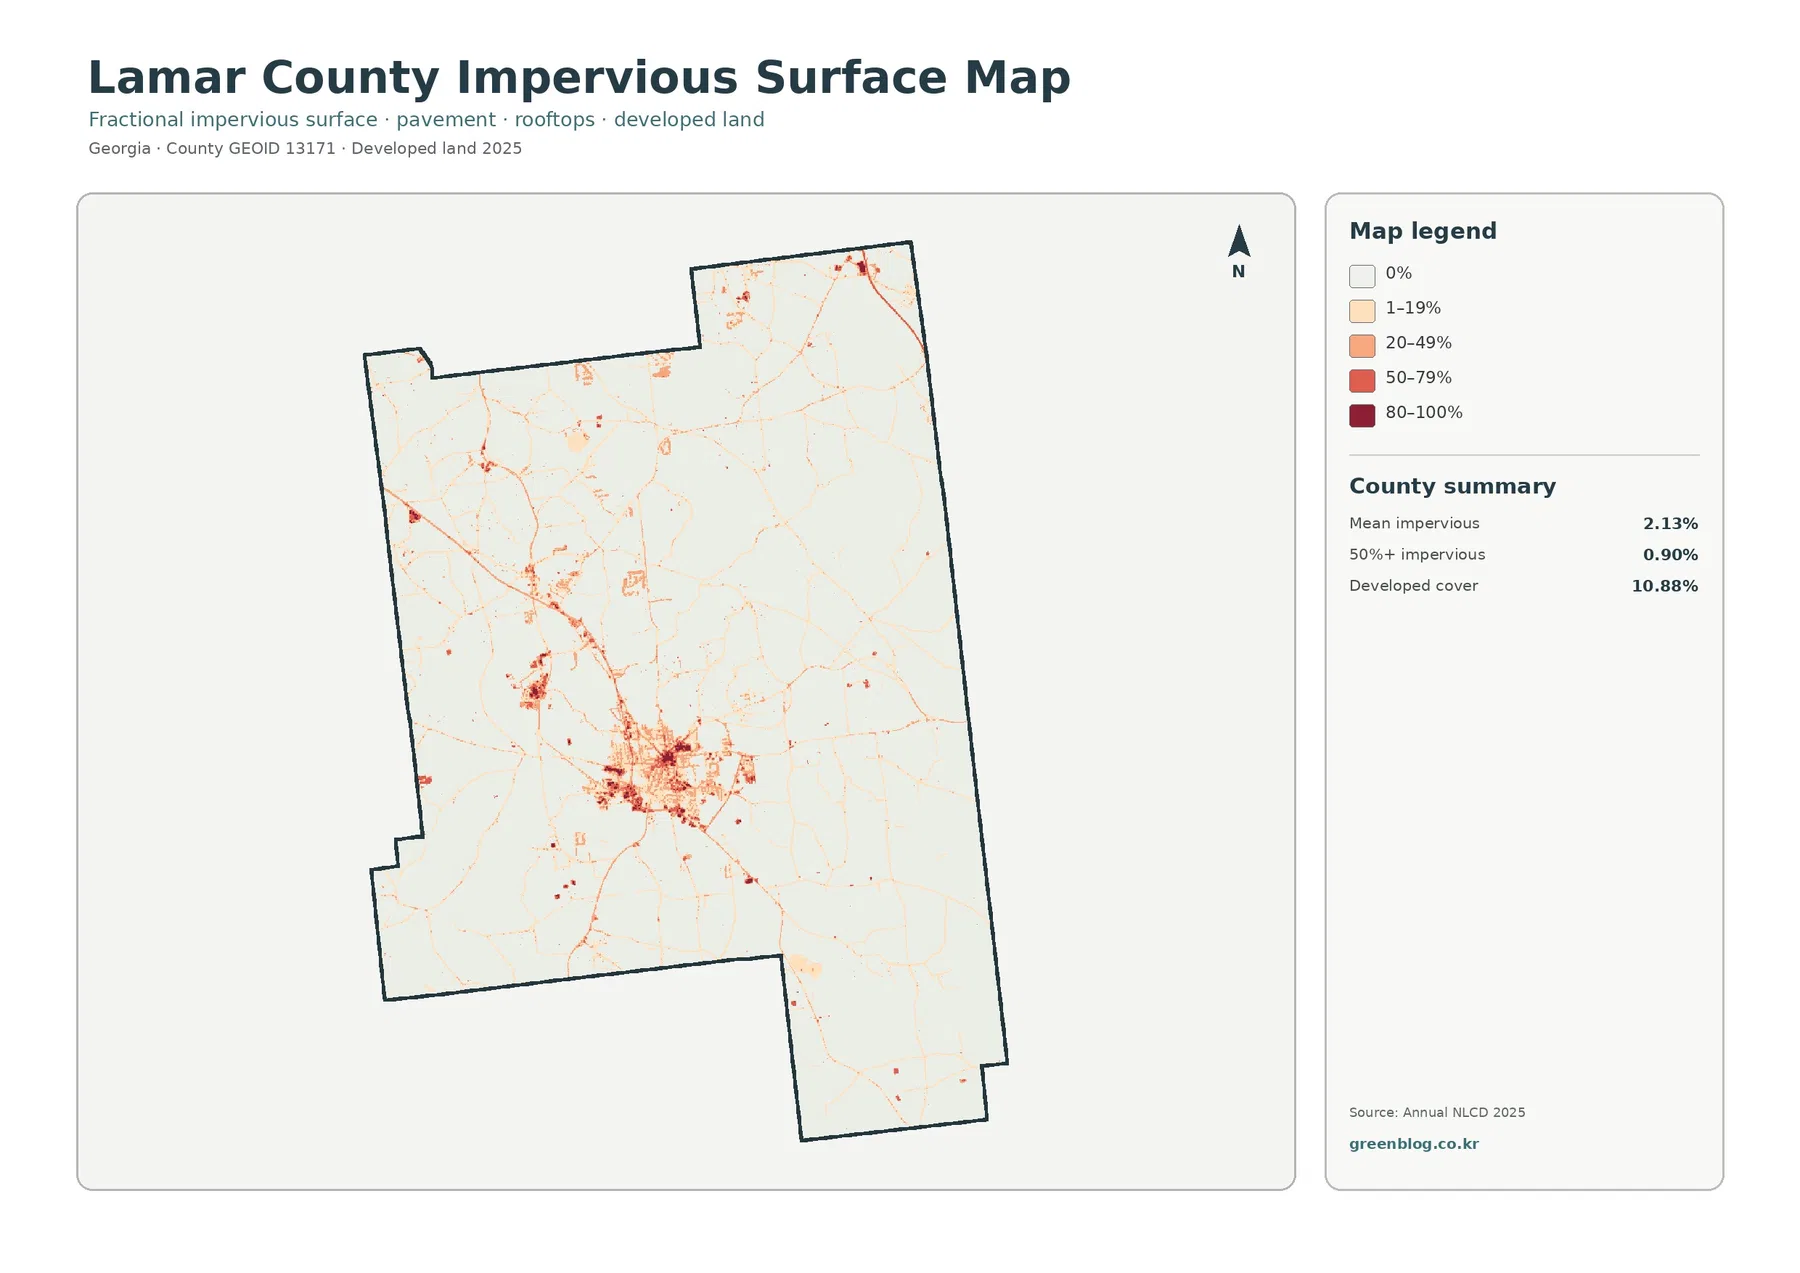
The strongest impervious tones occur inside the Barnesville-area concentration, where dark red and orange patches are surrounded by lighter developed surfaces. Thin lines extend outward through otherwise pale rural areas. A few smaller high-intensity locations appear north and west, but most of the county remains in the zero or low-percentage categories. The map therefore makes the difference between a built center and the surrounding countryside more obvious than the general land-cover view.
Mean impervious cover is 2.13%, and 0.90% of the county is mapped at 50% impervious surface or higher. Those values are well below the 10.88% developed share. Developed land can include lawns, trees, bare soil, yards, and other permeable surfaces around buildings and roads. The impervious layer isolates roofs, pavement, parking lots, and comparable hard materials rather than treating every developed cell as fully paved.
The 1985–2025 endpoint map shows 29.94% class difference, not 29.94% damage
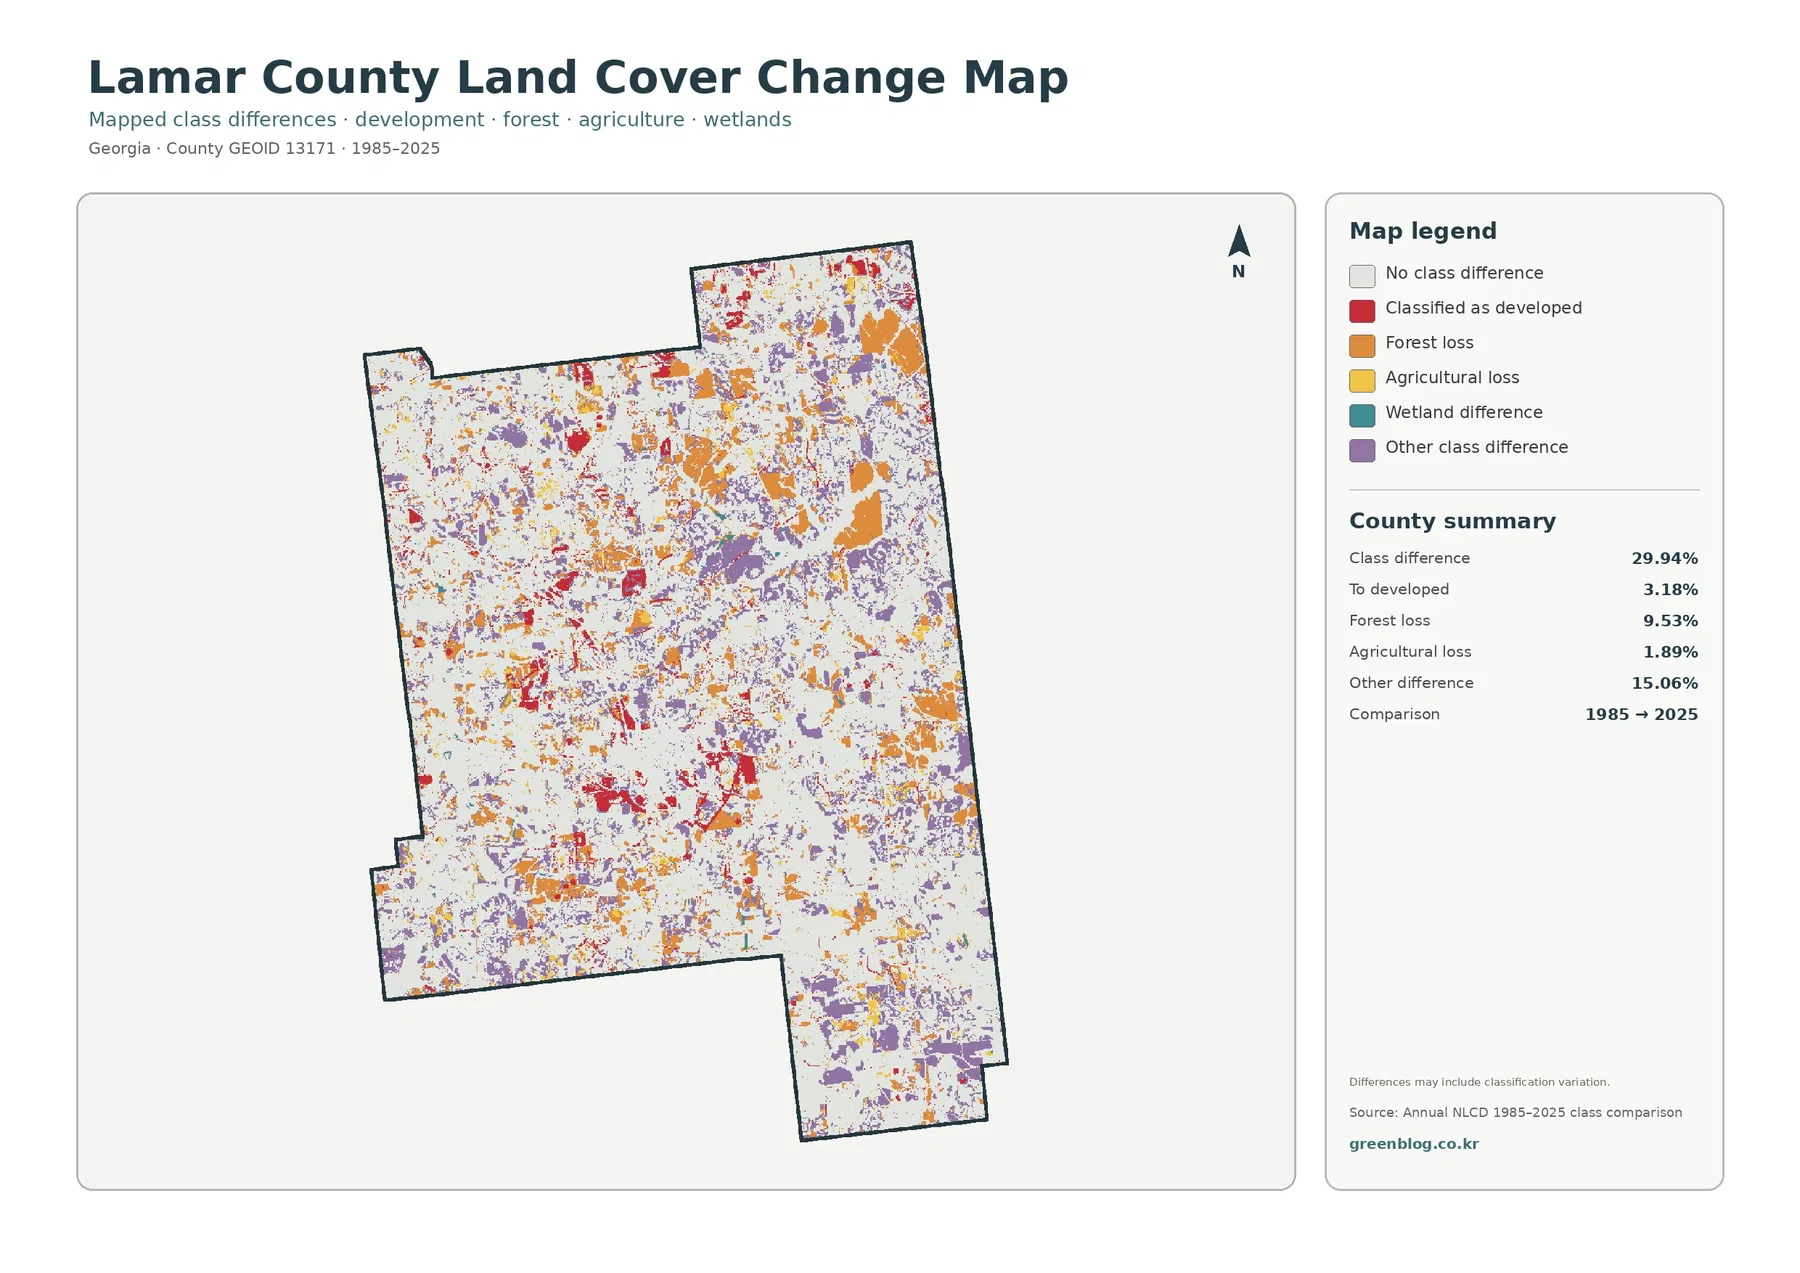
The total class difference between the 1985 and 2025 endpoints is 29.94%. It represents cells that received different classifications in the two endpoint years. It does not mean that 29.94% of Lamar County was destroyed, urbanized, cleared, or permanently changed. The map notes that classification variation may be included, which matters when imagery conditions, seasons, mixed pixels, and model decisions differ.
The printed summary lists 3.18% classified to developed, 9.53% forest loss, 1.89% agricultural loss, and 15.06% other difference. Red developed-change cells are noticeable around the present central built concentration and along several linear areas. Orange forest-loss and purple other-difference cells are distributed much more broadly, including a few large orange patches in the northeastern part of the county.
Thirty-meter cells are appropriate for county patterns, not parcel boundaries
Annual NLCD is a raster product based on Landsat imagery at 30-meter resolution. Each square cell receives a predominant land-cover class even when trees, grass, water, pavement, and a small building share the same space. Narrow streams, tiny ponds, thin forest strips, and scattered houses can therefore look wider, narrower, or less continuous than they are on the ground.
Each downloadable JPG measures 2480 × 1754 pixels. That size works for screens, reports, lessons, presentation graphics, and many ordinary print layouts. The package does not identify the files as meeting an A3 high-resolution reference, so test a proof before making a large poster and preserve the original aspect ratio. Surveys, permitting, zoning, wetland jurisdiction, and property boundaries require authoritative records.
The download contains four original JPG map views
The ZIP contains the 2025 land-cover map, forest-and-farmland map, impervious-surface and developed-land map, and the 1985–2025 land-cover comparison. Start with the countywide view for context, then add the vegetation, hard-surface, or endpoint-difference map that directly supports the topic being explained.
Frequently Asked Questions
What is the largest land-cover class in Lamar County?
Forest is the largest class in the supplied 2025 summary at 48.44%, followed by agriculture at 25.90%. The two classes dominate the countywide area, but the Barnesville-area built cluster, southern farm blocks, wetlands, grassland, and smaller developed corridors create substantial local variation.
Why is developed land 10.88% when mean impervious cover is only 2.13%?
Developed classes can include grass, trees, yards, bare soil, and other permeable surfaces around buildings and roads. Fractional impervious cover isolates rooftops, pavement, parking areas, and similar hard surfaces, so its countywide average is much lower than the broader developed-land share.
Does the 29.94% 1985–2025 class difference mean that much land was damaged?
No. It is the percentage of cells assigned different classes at the two endpoints. The summary separately lists 3.18% classified to developed, 9.53% forest loss, 1.89% agricultural loss, and 15.06% other difference. Timing and cause require intermediate imagery and local evidence.
Sources and Reference Data
- MRLC Annual NLCD Data – official access to annual land-cover, change, and related national products
- USGS Annual NLCD Land Cover Classification – definitions for forest, agriculture, wetlands, developed land, and other surface classes
- U.S. Census Bureau TIGER/Line Shapefiles – authoritative county boundaries and geographic layers for place and transportation comparison
- Lamar County Government – Resources & Information – official links for Barnesville, Milner, and local county resources
- UGA Extension – Lamar County Agriculture & Natural Resources – local information on agriculture, soils, ponds, crops, livestock, timber, and natural resources
Map File Information
The ZIP contains four original JPG maps for comparing Lamar County's 48.44% forest cover, 25.90% agriculture, Barnesville-area development, hard surfaces, and 1985–2025 class differences.
- Included Files: Use only the versions confirmed in the article and supplied images
- File Type: Use the confirmed download contents
- Intended Use: Printing, education, presentations, and map-based projects
Related Maps
- Appling County Georgia Land Cover Map
- Atkinson County Georgia Land Cover Map
- Bacon County Georgia Land Cover Map
Green Map creates custom-edited map images using open geographic data sources such as geoBoundaries, Natural Earth, OpenStreetMap, and government open data.
These maps are edited visual materials, not raw data files, and are provided for education, documents, presentations, and graphic reference.