Forest is the largest mapped cover in Johnson County in the supplied 2025 summary, but the county is not a single continuous block of woods. Forest accounts for 32.95%, agriculture for 21.55%, and wetlands for 18.18%, with grassland and shrubland adding another substantial share. This Johnson County Georgia Land Cover Map set makes that mixed rural landscape easier to compare while also showing a compact developed concentration near the middle of the county.
The page includes four views: 2025 land cover, forest and farmland, impervious surface and developed land, and a 1985–2025 endpoint comparison. The WebP maps can be viewed with the discussion, and the four original 2480 × 1754 JPG files are available together in one ZIP below. They are suited to county profiles, environmental lessons, presentations, and broad comparisons of rural and built surfaces.
Table of Contents
Forest leads the county, while farms and wetlands break it into a varied mosaic
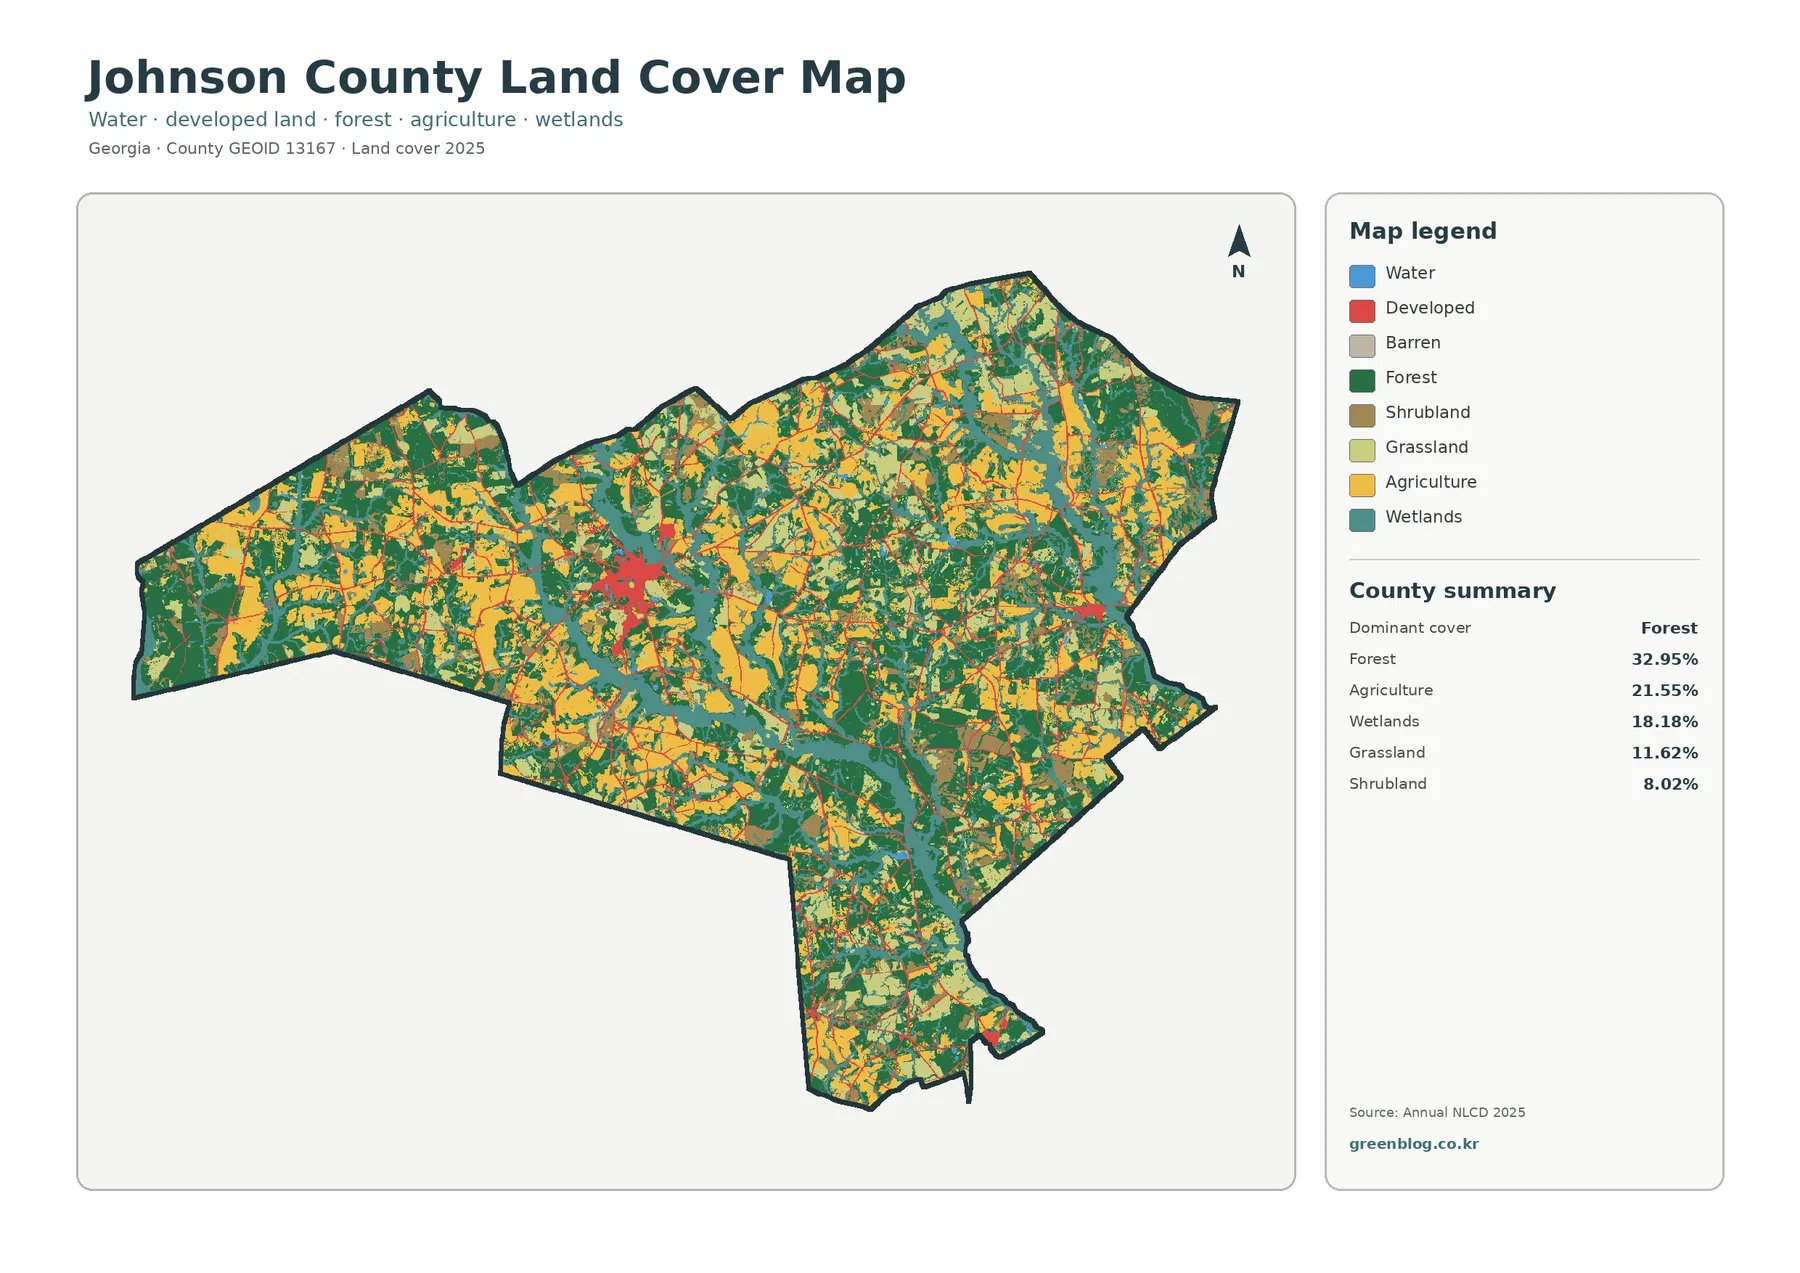
Dark green forest appears throughout the county, but yellow agricultural areas and teal wetlands repeatedly divide the wooded cover. Forest, agriculture, and wetlands together make up 72.68% of the supplied summary. That combined share explains most of the image, yet the three classes are interwoven rather than separated into simple east-west or north-south zones. Large forest patches are common in the west, center, south, and east, while farm blocks occur in many of the openings between them.
Wetlands are especially noticeable as branching and elongated teal areas through the middle and southeastern portions, with additional patches elsewhere. Some narrow sections resemble drainage-connected corridors, while broader areas occupy larger low-looking zones between forest and farmland. The map is useful for finding these broad relationships, but the wetland class is a satellite-based land-cover category. It does not draw a regulatory wetland boundary, flood zone, property line, or ownership limit.
Grassland represents 11.62% and shrubland 8.02%, for a combined 19.64%. Their lighter green and brown shades appear in many transition areas around forest, farms, and development. Open water is only 0.60% in the focused vegetation summary, so blue water occupies far less of the county than teal wetland cover. Barren land is present in the general legend but appears only as a very small part of the visible countywide pattern, and the package does not provide a separate exact percentage for it.
A compact central built area stands apart from the surrounding rural cover
Developed land does not spread evenly across Johnson County. The most obvious red concentration lies slightly west of the county’s center, and smaller red marks follow thin lines or occur as isolated pockets farther away. Official county and UGA Extension offices are both located in Wrightsville, which provides useful local context for the largest central cluster. The map itself does not label municipal limits, however, so an individual red cell should not be assigned to Wrightsville or another municipality without a separate boundary layer.
Beyond that central concentration, forest, farms, wetlands, grassland, and shrubland quickly become the dominant surfaces again. This makes Johnson County look very different from a heavily urbanized county where developed colors merge into a wide continuous field. Here, built cover is better understood as a limited center and a network of smaller traces inside a predominantly rural landscape. The impervious map later in the article helps separate the broad developed class from the places that are actually covered by large amounts of pavement or rooftops.
Forest and farmland sit side by side rather than forming separate halves
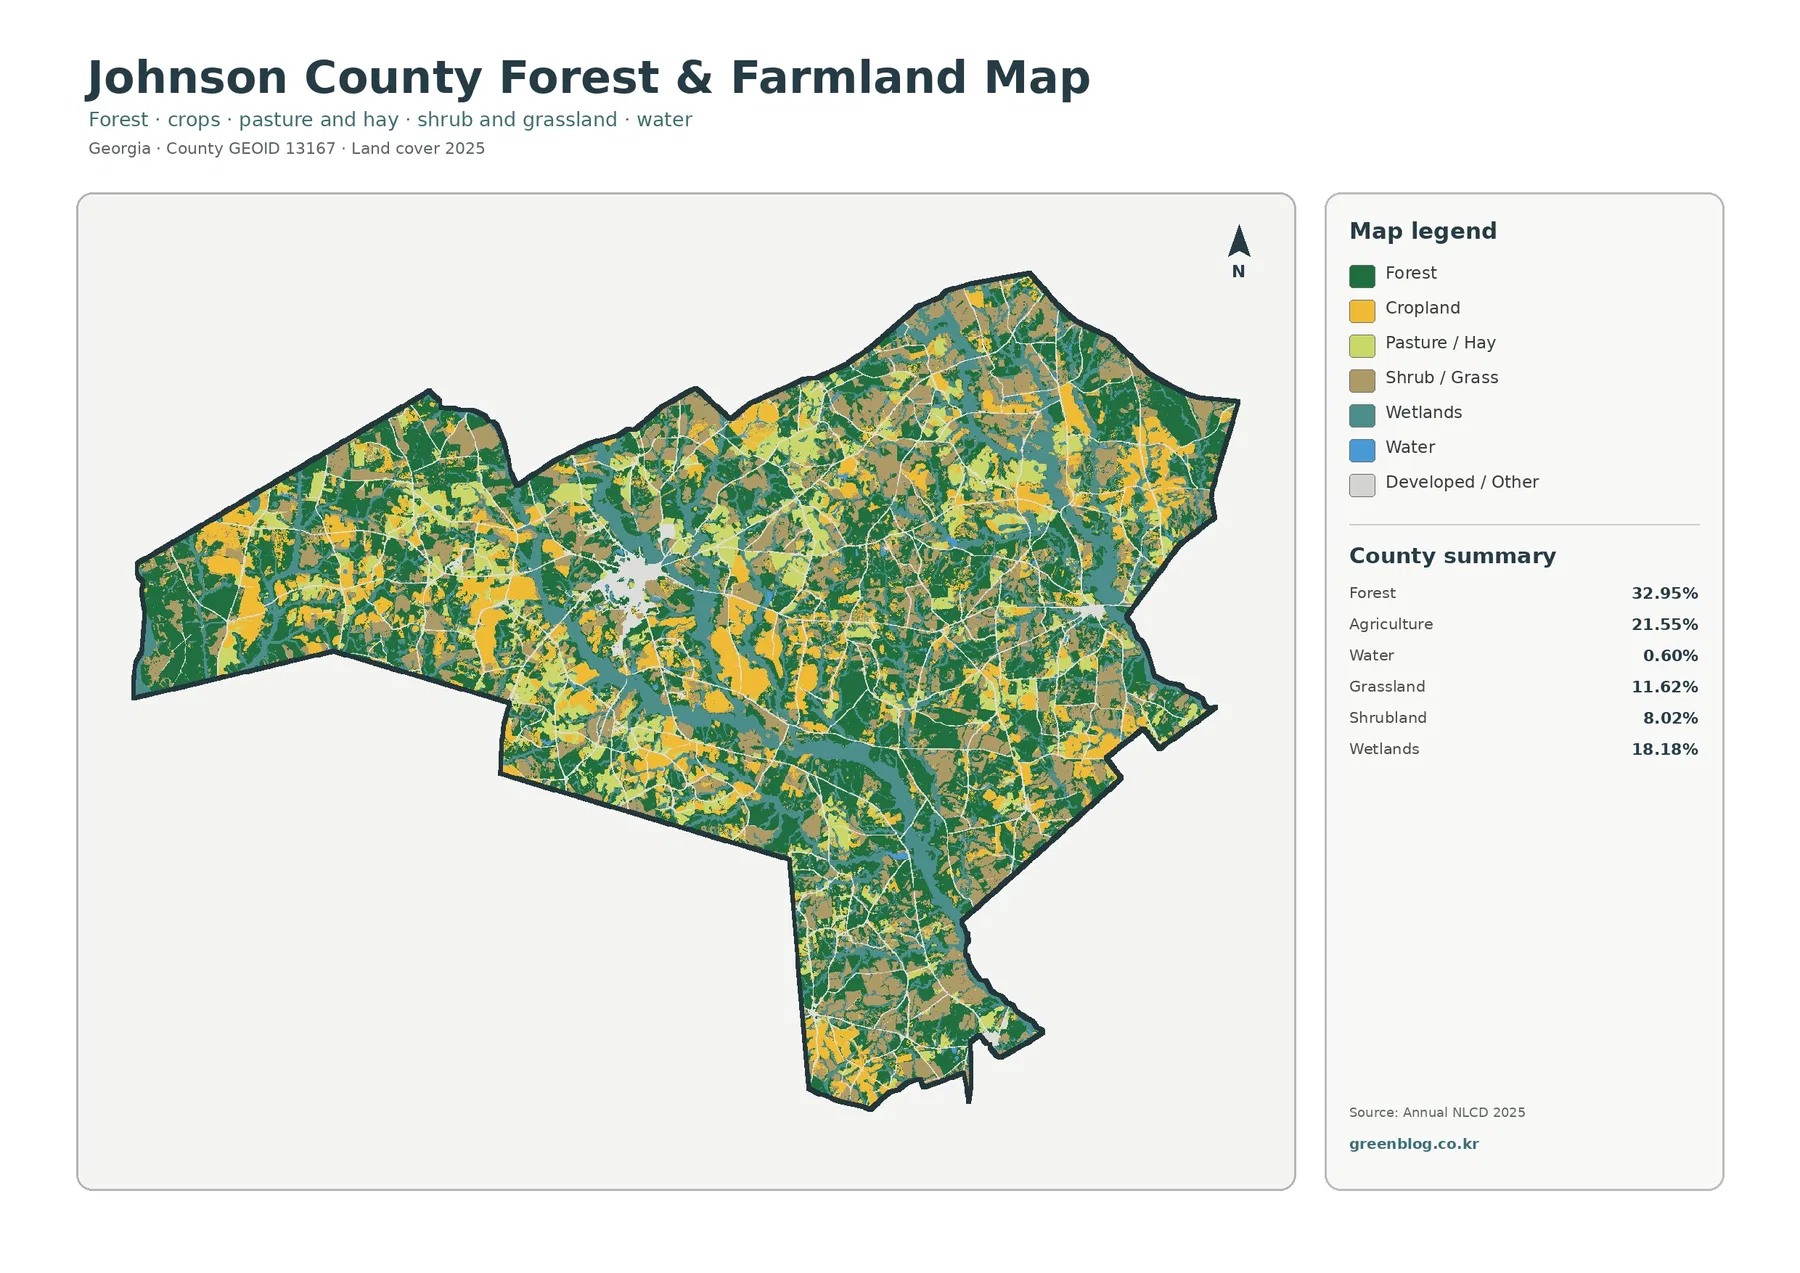
The vegetation-focused map reduces the visual emphasis of developed and miscellaneous surfaces, making the forest-farm relationship easier to follow. Forest covers 32.95%, while agriculture covers 21.55%. Yellow farm blocks occur across the county instead of forming one uninterrupted agricultural belt. Green forest surrounds many of those blocks and also forms larger tracts between them, so a viewer can see frequent transitions from working land to woodland over relatively short distances.
Johnson County’s local agricultural context supports treating those classes as more than decorative colors. UGA Extension’s Johnson County impact page identifies timber, beef cattle, and forage production as leading parts of the local agricultural economy and reports more than $43 million in farm gate value. The map cannot convert those activities into acreage or identify a particular crop or pasture, but the large shares of forest, agriculture, and grassland provide useful landscape context for the official local description.
Wetlands continue to occupy 18.18% and often lie directly beside forest or agricultural cover. In several parts of the county, teal areas thread between green and yellow blocks rather than remaining at the outer boundary. That arrangement matters when the map is used for an environmental lesson or a county profile because it shows that farmland is part of a broader network of wooded and wet surfaces. It would be misleading to present the agricultural class alone and describe the rest of the county as unused land.
Grassland and shrubland are also important here because together they cover nearly one-fifth of the supplied summary. These classes can include open vegetation and transitional surfaces that do not fit neatly into forest or cropland. Annual NLCD uses 30-meter raster cells, so one cell receives a predominant category even when trees, grass, a narrow road, and bare soil occur close together. Narrow edges and small features can therefore appear simplified, fragmented, or slightly wider than they are on the ground.
Mean impervious cover is only 1.23%, despite 7.02% developed land
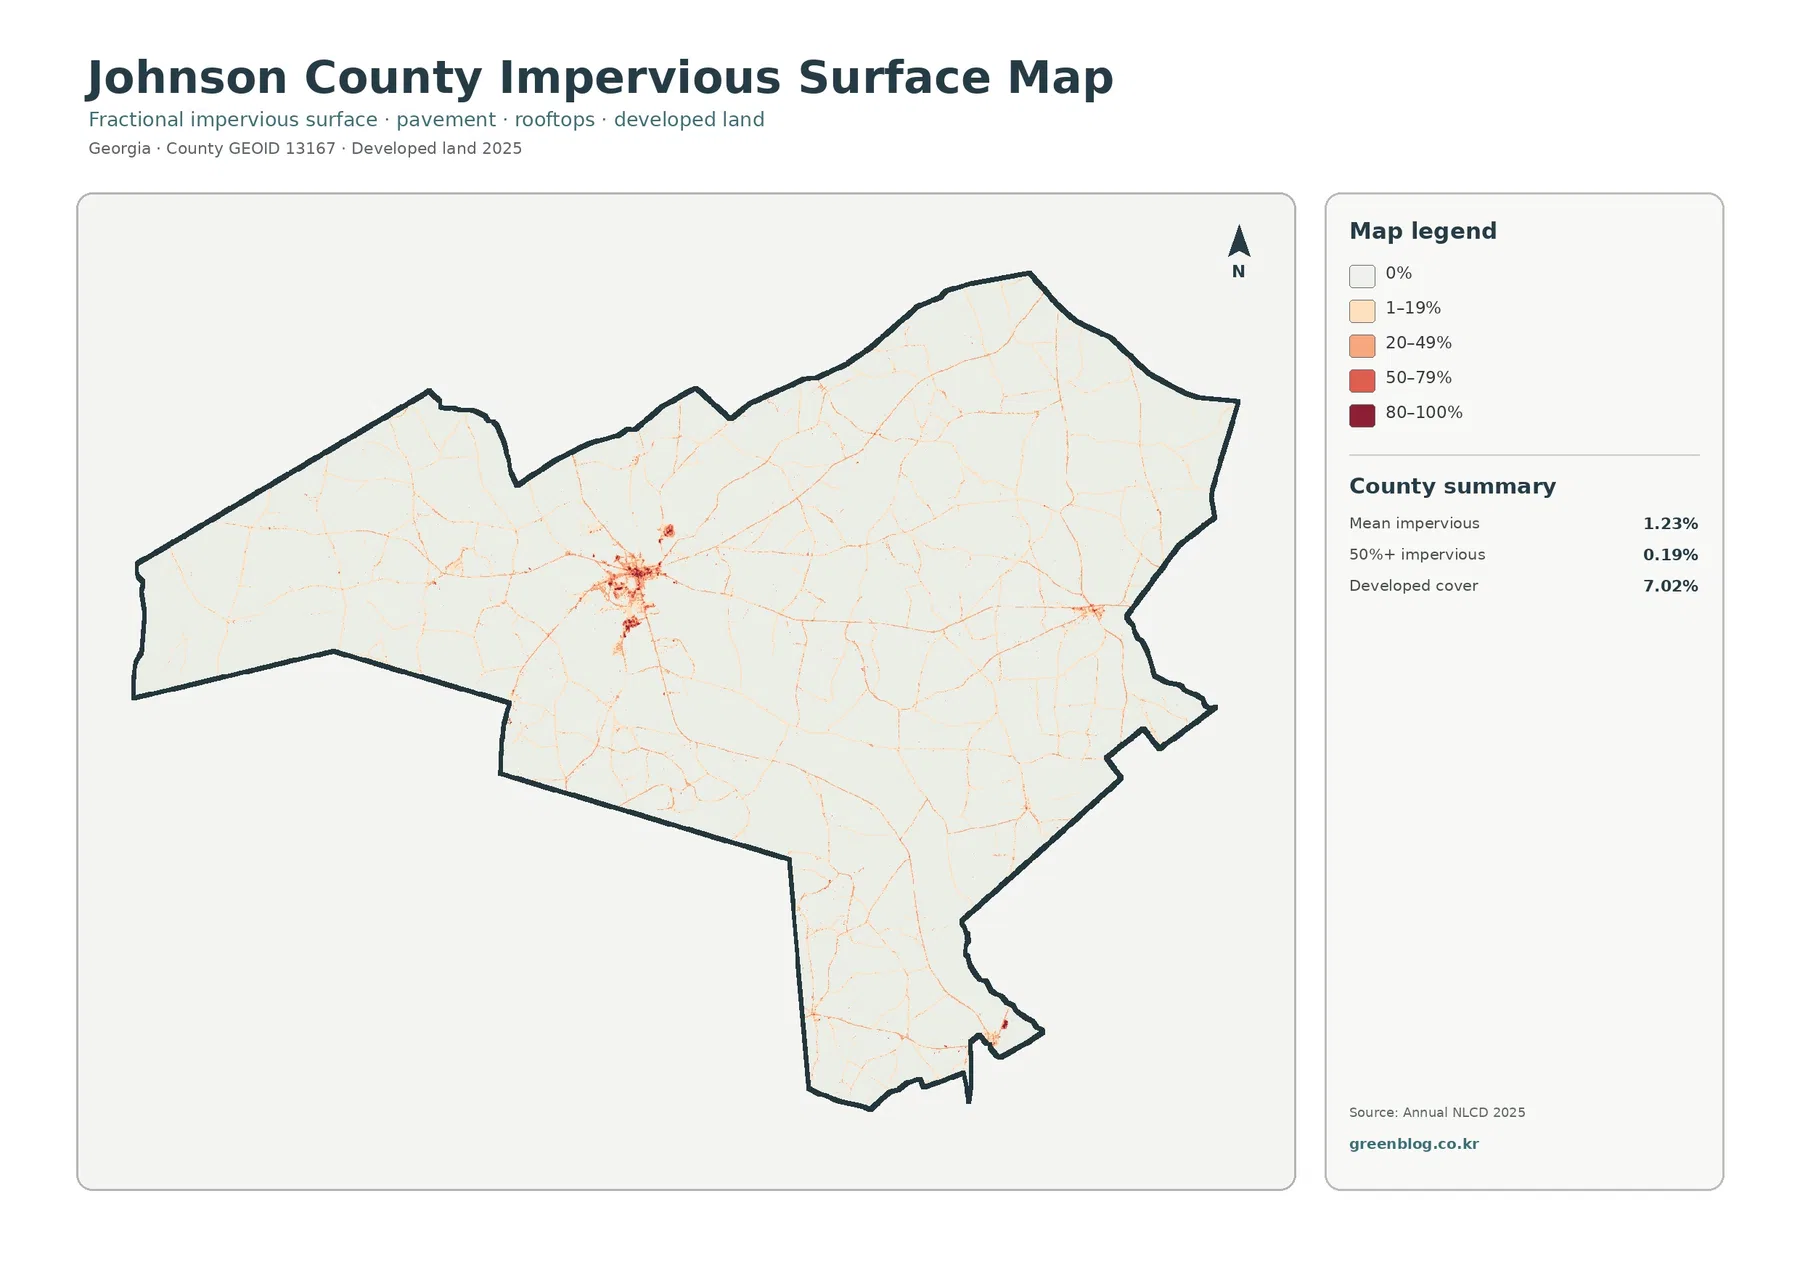
Developed cover is 7.02%, but mean impervious cover is much lower at 1.23%. Only 0.19% of the county is mapped at 50% or greater impervious surface. Those numbers describe different things. A developed land-cover class can contain homes, roads, lawns, trees, and open soil, while the impervious layer focuses more directly on hard materials such as rooftops, pavement, and parking areas that do not readily absorb water.
The strongest impervious tones are concentrated in the same general central area that stands out on the land-cover map. Pale linear traces extend away from it, while most of the county remains very light. A smaller concentration appears toward the eastern side, but it is much less extensive than the central cluster. Because road names are not printed, a thin line that resembles a transportation route should not be labeled as a specific highway from this image alone.
A countywide average of 1.23% can hide these local contrasts. The center contains a much greater density of hard surface than broad rural areas, even though the county as a whole has little impervious cover. The map is useful for comparing where hard surfaces are concentrated, but it is not a flood-risk map. Rainfall, drainage, elevation, soils, streams, wetlands, and infrastructure all affect runoff. Johnson County’s 18.18% wetland share makes that broader context particularly important when discussing water movement.
The 42.80% endpoint difference needs careful interpretation
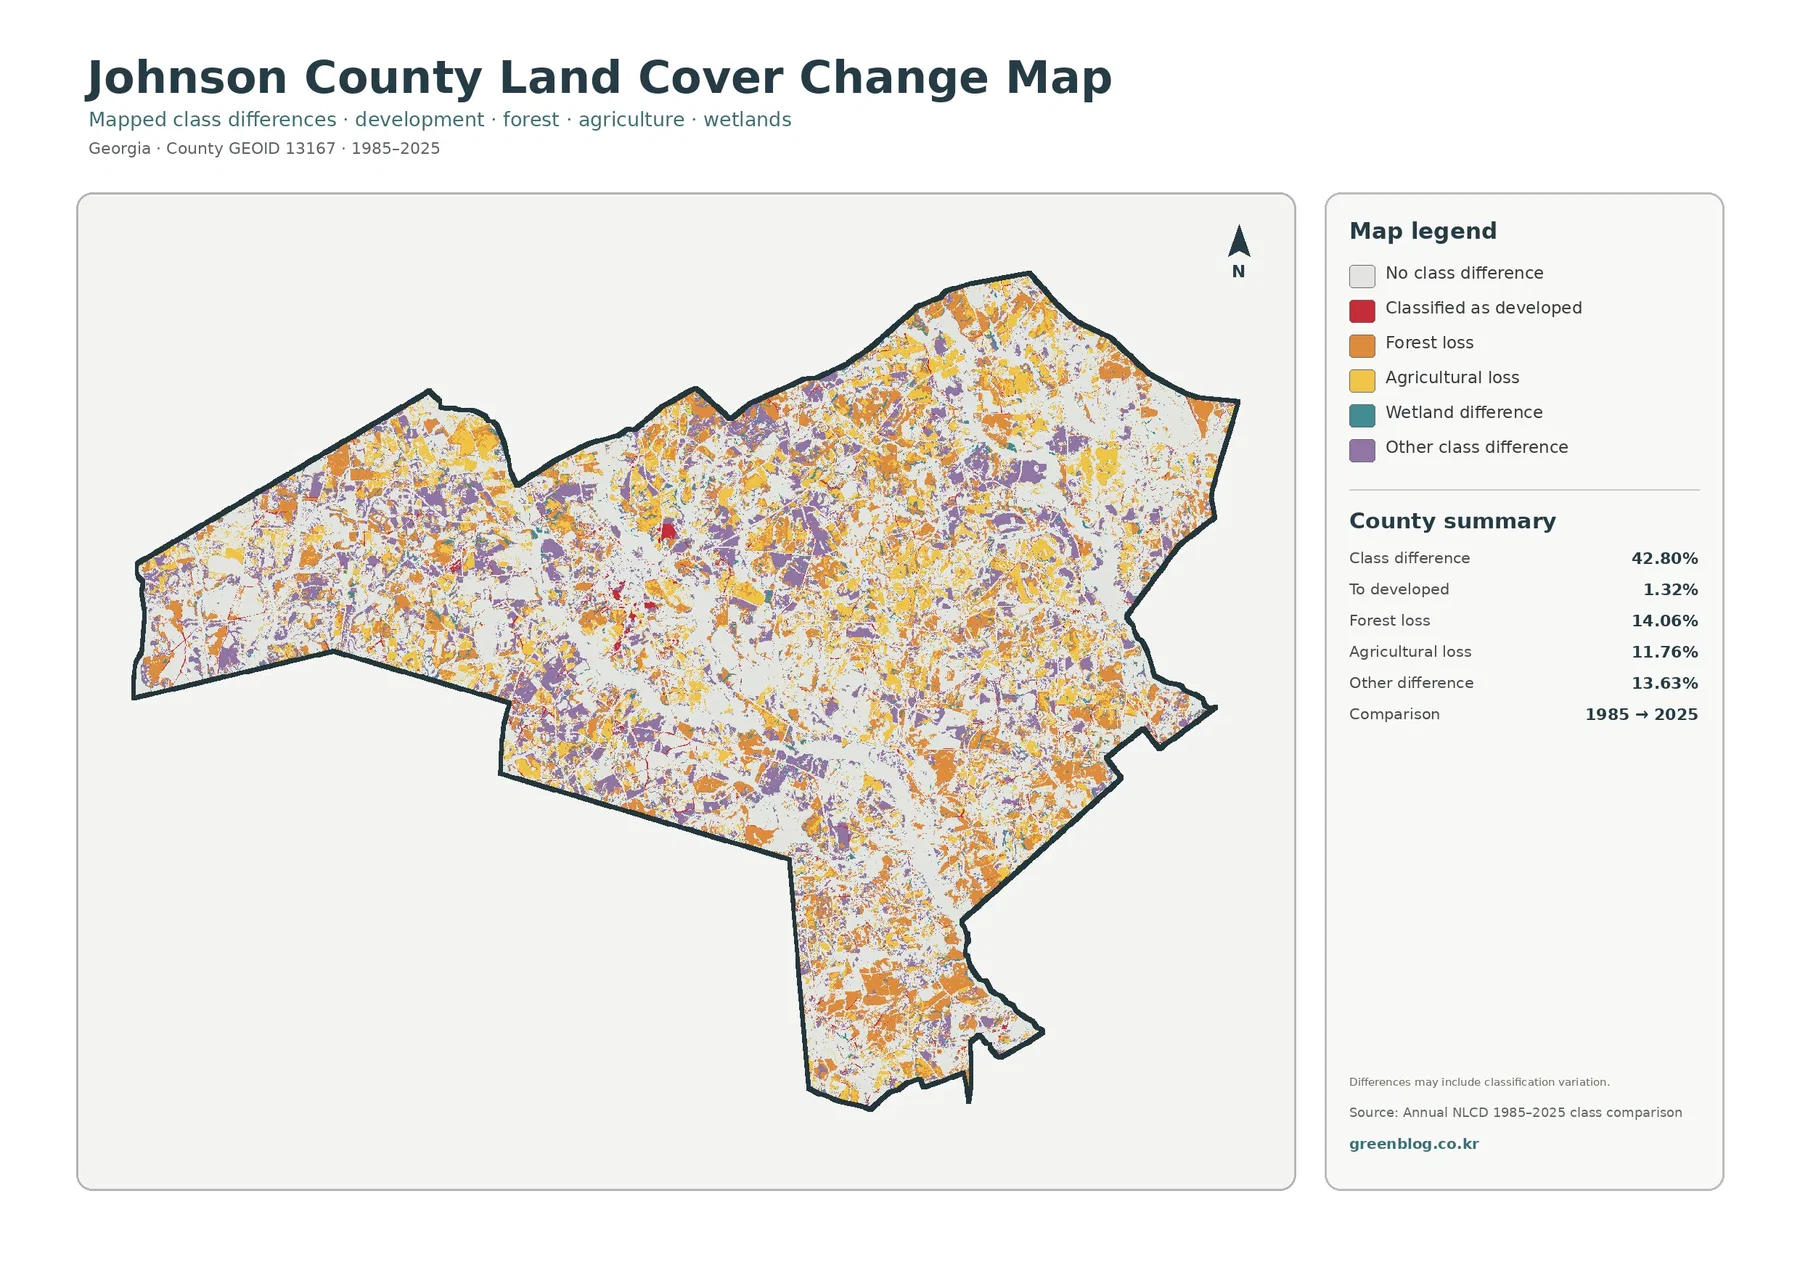
The headline value on the change map is a 42.80% class difference between the 1985 and 2025 endpoints. That does not mean 42.80% of Johnson County was damaged, cleared, or developed. It means that this share of mapped cells received different endpoint labels. The map also warns that classification variation may be included, which is important when imagery dates, seasonal conditions, mixed pixels, or class boundaries differ between the two observations.
The supplied summary lists 1.32% as classified to developed, 14.06% as forest loss, 11.76% as agricultural loss, and 13.63% as other class difference. Orange forest-loss cells and yellow agricultural-loss cells are scattered widely rather than limited to one corner. Purple other-difference patches are also common across the west, center, and east. Red developed-change cells occupy a much smaller share and are easiest to notice around the central built concentration and a few smaller linear features.
Wetland difference appears in the legend, but the map does not print a separate exact percentage for it. Subtracting the listed categories from 42.80% and presenting the remainder as an official wetland-change rate would overstate what the package verifies. The same caution applies to causes. A cell marked as forest loss only says that a forest label at the earlier endpoint became another class in 2025; it does not distinguish harvest, clearing, storm effects, regrowth cycles, agriculture, or classification error.
For presentations, the current 2025 map should usually come before the change map. Viewers can first learn where forest, agriculture, wetlands, and the central developed area are located. They can then compare the endpoint-difference colors without mistaking red change cells for all present-day development. If a large orange or yellow cluster matters to a project, intermediate aerial imagery and local records are needed to establish when the shift occurred and what actually caused it.
How to choose among the four Johnson County maps
The 2025 land-cover map is the best starting point for a general county profile. It shows the 32.95% forest share together with substantial agriculture, wetlands, grassland, shrubland, and the compact built center. A lesson or report can use this image to introduce the county before moving to a narrower question. It also keeps the relationship between rural cover and development visible instead of treating any one class in isolation.
Choose the forest-and-farmland view when the question concerns working land, woodland, open vegetation, wetlands, or water. It is particularly useful for discussing the official UGA Extension description of timber, cattle, and forage production without claiming that one land-cover color equals one agricultural commodity. Choose the impervious map when the focus is rooftops, pavement, or the difference between developed land and hard-surface intensity. The contrast between 7.02% developed cover and 1.23% mean impervious cover is the clearest reason to use that view.
The 1985–2025 map belongs in projects that specifically need endpoint comparison. It can help identify areas worth examining more closely, but it should not be used as a stand-alone record of why land changed. In planning or environmental work, treat it as a screening layer and compare any important location with newer aerial imagery, official plans, property information, field observations, and subject-specific data. That approach preserves the map’s value without asking it to answer questions outside its design.
Scale, date, and classification limits matter when the map is enlarged
Annual NLCD is a raster dataset built from 30-meter cells. Each cell is generalized to a predominant cover category, so a narrow stream, thin tree line, small parking lot, or tiny field may be reduced, interrupted, or absorbed into a neighboring class. The dark county outline is useful for orientation, but the colored cell boundaries are not parcel boundaries. Enlarging the JPG makes the pixels easier to see; it does not create survey-level detail that was not present in the source data.
The current maps represent the supplied 2025 observation year. Construction, timber activity, vegetation recovery, crop rotation, or changes in standing water after that observation may not appear. Seasonal conditions can also affect how mixed surfaces are classified. These limitations are especially relevant to the 42.80% endpoint difference, where a large number should not be interpreted as a single continuous forty-year conversion without checking intermediate years.
Land cover describes what is on the surface. It does not establish zoning, ownership, legal land use, building rights, taxable parcels, or regulatory wetland boundaries. Georgia’s Department of Community Affairs provides the official comprehensive-plan collection for Johnson County, Wrightsville, and Kite, while county government and other agencies provide current administrative information. Those sources are better choices when a decision depends on legal boundaries or adopted planning policy.
Download the four original JPG map files
The ZIP contains one original JPG for each view discussed here: the 2025 land-cover map, forest and farmland map, impervious surface and developed land map, and 1985–2025 land-cover change map. Each image measures 2480 × 1754 pixels. The files work well for screens, documents, classroom handouts, and ordinary presentation layouts, but the package does not identify them as meeting a high-resolution A3 print standard. A proof print is recommended before making a large poster.
Using every map at once is not necessary. Start with the countywide land-cover view, add the forest-and-farmland map when rural cover is the main subject, or add the impervious view when the compact developed center matters. Place the endpoint-difference map after the current map if long-term comparison is part of the discussion. Keeping the same county outline and a similar display size makes the differences among the four views easier for readers to follow.
Frequently Asked Questions
What is the largest land-cover class in Johnson County?
Forest is the largest class in the supplied 2025 summary at 32.95%. Agriculture follows at 21.55% and wetlands at 18.18%. The map therefore shows a mixed rural county rather than a landscape dominated almost entirely by one cover type.
Why is developed cover 7.02% when mean impervious surface is only 1.23%?
Developed land can include buildings and roads together with lawns, trees, bare soil, and other surfaces that still absorb water. The impervious layer focuses on roofs, pavement, parking areas, and similar hard surfaces. In Johnson County, the highest values are concentrated in a small central cluster, so the countywide mean remains low.
Does the 42.80% class difference mean that much of the county was damaged?
No. It is the share of cells with different classifications at the 1985 and 2025 endpoints. The summary lists 1.32% classified to developed, 14.06% forest loss, 11.76% agricultural loss, and 13.63% other difference, while wetland difference is mapped without a separate printed percentage. Timing and cause require intermediate imagery and local evidence.
Sources and Reference Data
- MRLC Annual NLCD Data – official access to annual land-cover data and related products
- USGS Annual NLCD Land Cover Classification – definitions for forest, agriculture, wetlands, developed land, and other mapped cover classes
- U.S. Census Bureau TIGER/Line Shapefiles – official county-boundary reference for Johnson County
- UGA Extension Johnson County – Our Impact – county-specific context for timber, beef cattle, forage production, and farm gate value
- Georgia Department of Community Affairs – Johnson County Comprehensive Plan – official planning collection for Johnson County, Wrightsville, and Kite
Map File Information
The ZIP contains four original JPG maps for comparing Johnson County's 2025 forest, agriculture, wetlands, compact developed center, hard surfaces, and 1985–2025 endpoint differences.
- Included Files: Use only the versions confirmed in the article and supplied images
- File Type: Use the confirmed download contents
- Intended Use: Printing, education, presentations, and map-based projects
Related Maps
- Appling County Georgia Land Cover Map
- Atkinson County Georgia Land Cover Map
- Bacon County Georgia Land Cover Map
Green Map creates custom-edited map images using open geographic data sources such as geoBoundaries, Natural Earth, OpenStreetMap, and government open data.
These maps are edited visual materials, not raw data files, and are provided for education, documents, presentations, and graphic reference.