Forest, wetlands, and agriculture each cover about one quarter of Jeff Davis County in the supplied 2025 summary. Forest leads at 24.72%, but wetlands at 24.23% and agriculture at 24.11% are almost tied with it. This Jeff Davis County Georgia Land Cover Map is therefore most useful when read as a patchwork of three major surfaces rather than as a county dominated by one land-cover class.
Four views are included: 2025 land cover, forest and farmland, impervious surface and developed land, and a 1985–2025 class-difference map. The WebP maps can be read with the discussion below, while the four original 2480 × 1754 JPG files are available together in one ZIP. The set is suited to county profiles, environmental lessons, farm-and-forest comparisons, and broad screening of mapped change.
Table of Contents
Three nearly equal land-cover shares shape the countywide pattern
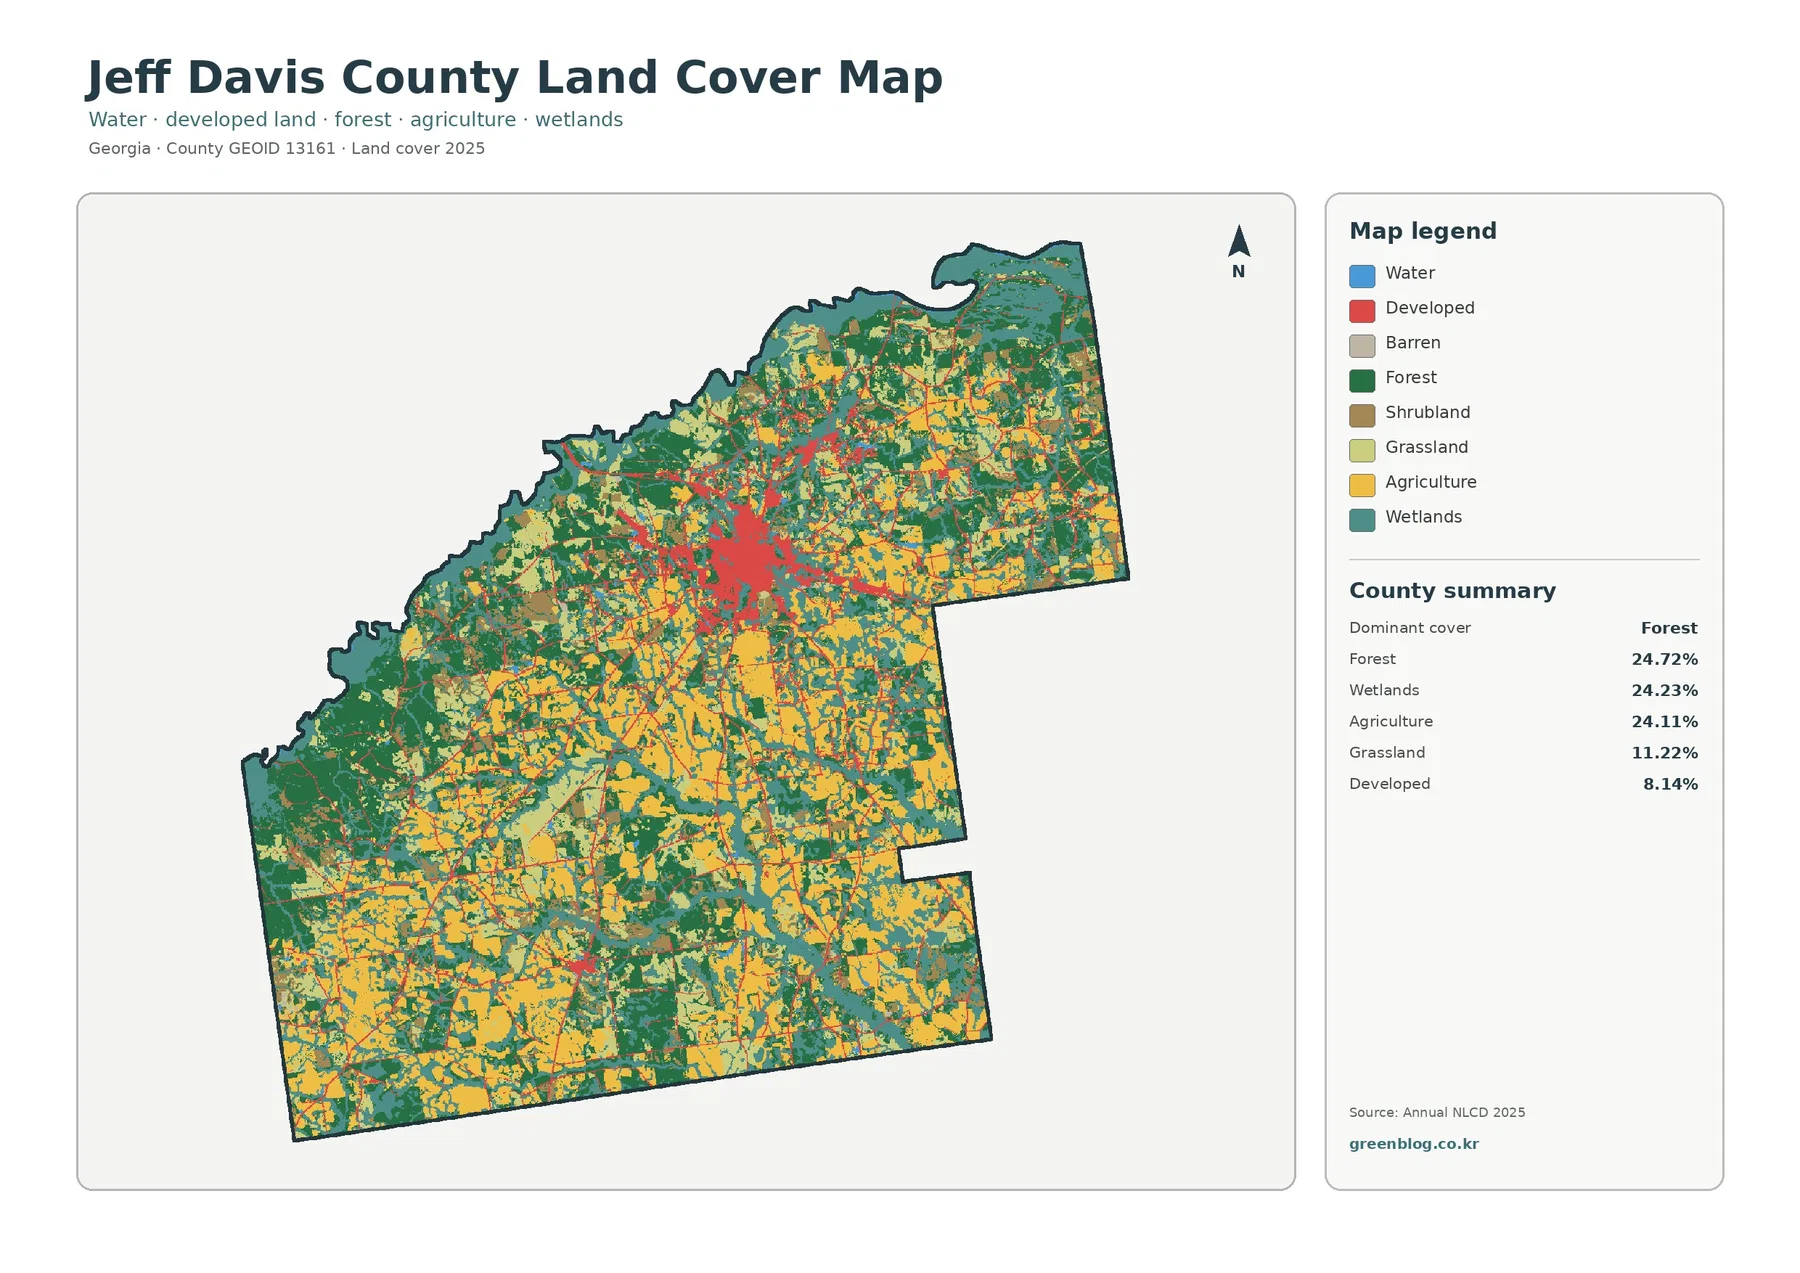
The general map does not contain one broad color that overwhelms everything else. Green forest blocks, yellow agricultural fields, and teal wetlands repeat across the county, often meeting within short distances. Their values differ by less than one percentage point from highest to lowest. Together they account for roughly 73% of the supplied county summary, leaving grassland, developed land, shrubland, water, and small remaining classes to fill the rest.
Large forest patches are especially noticeable along parts of the west and southwest, with additional wooded areas toward the north and east. Agriculture appears as many yellow blocks through the south, southeast, and center rather than as a single continuous farming belt. Wetlands thread between both of those classes and also form broader teal areas, so the map repeatedly shifts among wooded, cultivated, and wet surfaces.
Grassland contributes 11.22%, making it a substantial secondary class. Developed land covers 8.14%, yet it is visually prominent because much of the red color gathers in one large cluster slightly north of the county’s center. Thin red traces spread outward from that cluster and smaller developed marks appear elsewhere. This concentration matters more for interpreting settlement than the countywide percentage alone.
Land cover is a description of the surface detected and classified from imagery. It is not a zoning map, ownership record, parcel survey, or statement about what may legally be built on a property. A developed cell can still contain trees or lawn, and a wetland-class cell is not automatically a regulatory wetland boundary. Property-level questions require current local records and field-specific sources.
A compact hard-surface center stands out around the Hazlehurst area
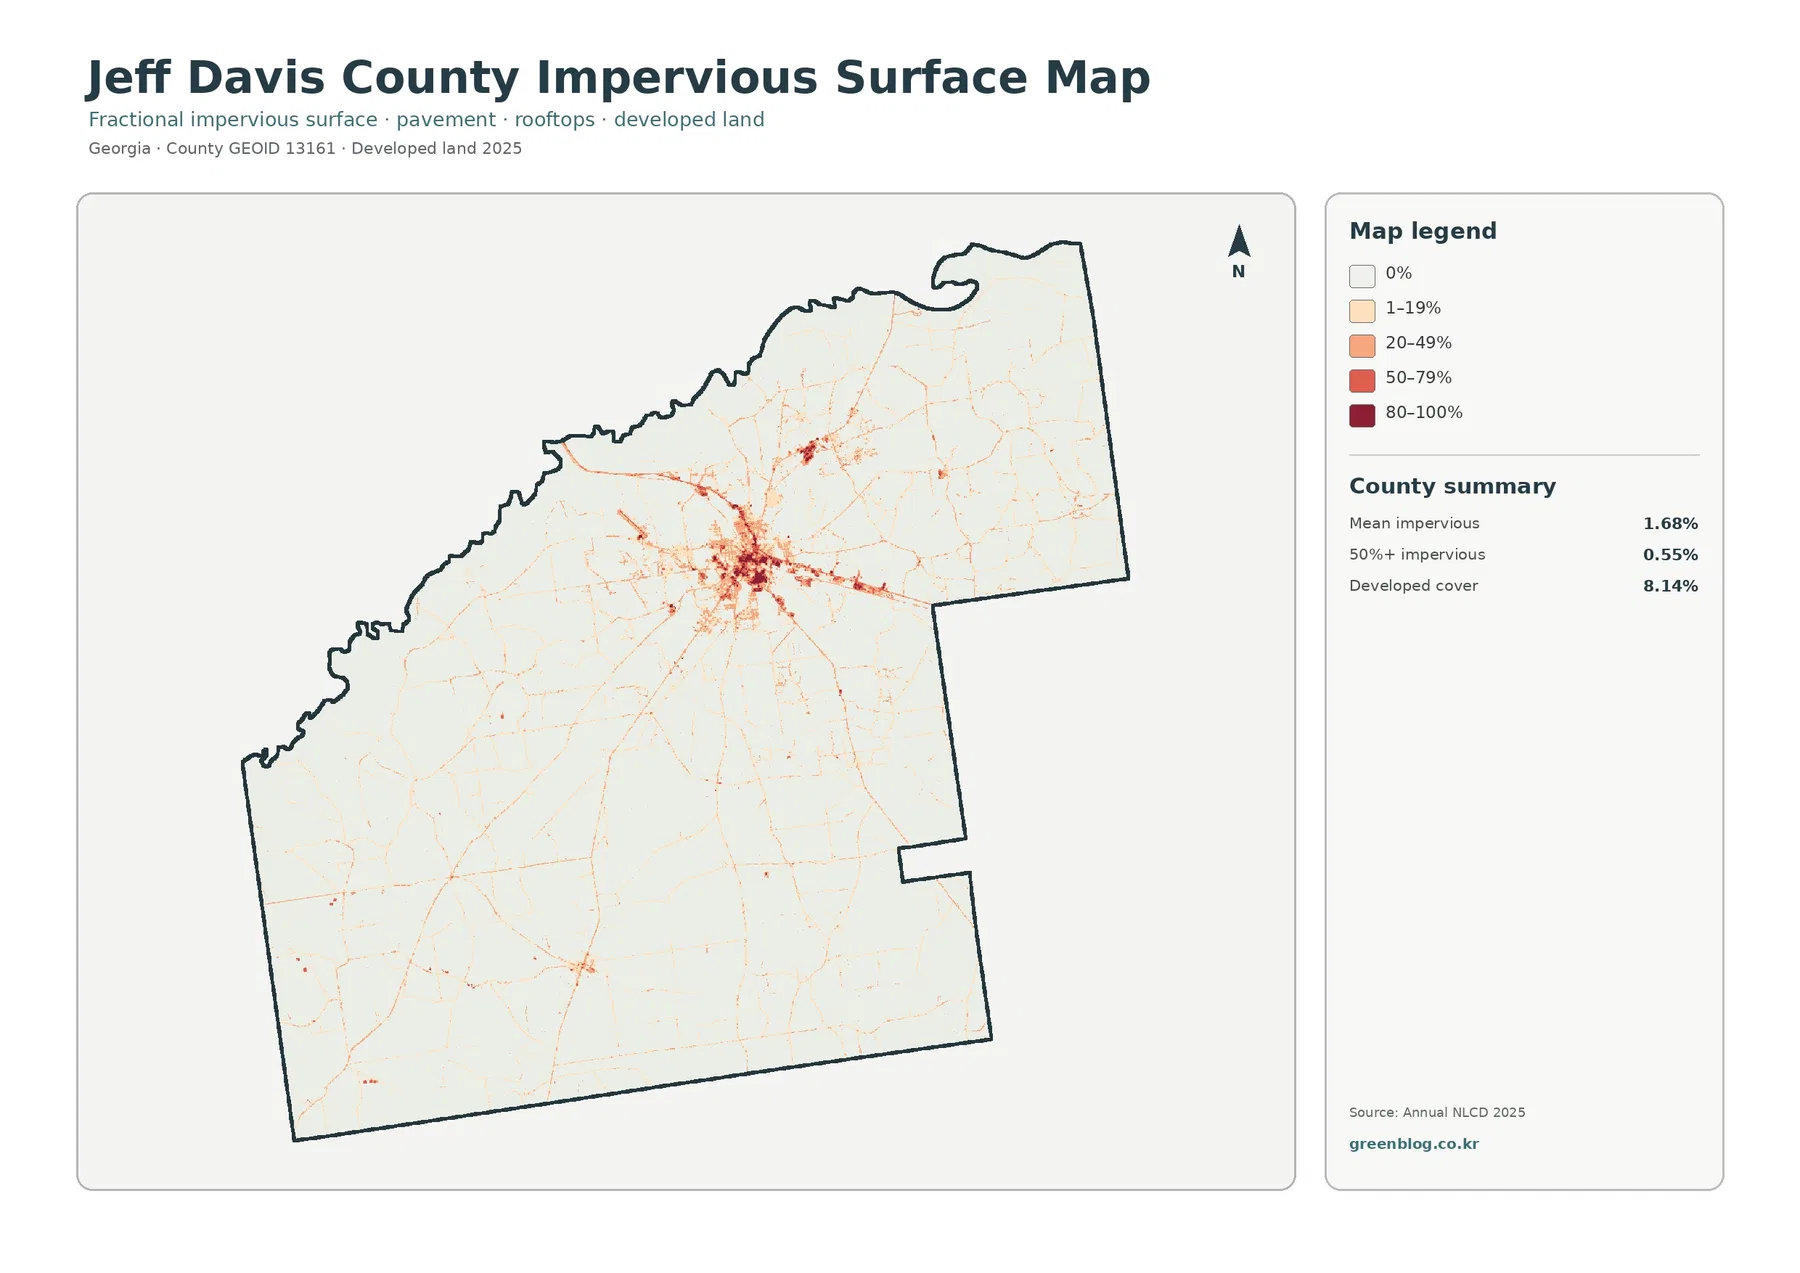
Impervious surface narrows the developed-land question to materials that resist infiltration, such as roofs and pavement. The supplied summary gives Jeff Davis County a mean impervious value of 1.68%, while only 0.55% of the county is mapped at 50% impervious or greater. Those figures are much lower than the 8.14% developed-land share because developed classes can also include yards, trees, bare soil, and other permeable surfaces around buildings and roads.
The darkest values are concentrated in the large upper-central cluster. Jeff Davis County offices and the local UGA Extension office are in Hazlehurst, and the location of that cluster is consistent with the Hazlehurst area. The image, however, does not draw municipal limits or label streets. It should be described as a developed concentration near Hazlehurst rather than treated as an exact city polygon.
From the central concentration, narrow lines of low-to-moderate impervious cover extend in several directions. They resemble transportation corridors at county scale, but no road names are printed on this image. Naming a particular highway from the color pattern alone would go beyond the evidence. A current transportation layer can be added when the purpose is to connect hard surfaces with named routes.
The countywide average can also hide how uneven the surface is. Most rural areas are very light, while a small number of blocks contain much higher percentages. That contrast is useful for explaining settlement concentration, but impervious cover by itself does not prove flood risk or drainage problems. Rainfall, elevation, soils, channels, wetlands, and drainage infrastructure all affect those questions.
Forest and farmland are interwoven with wetlands rather than separated into halves
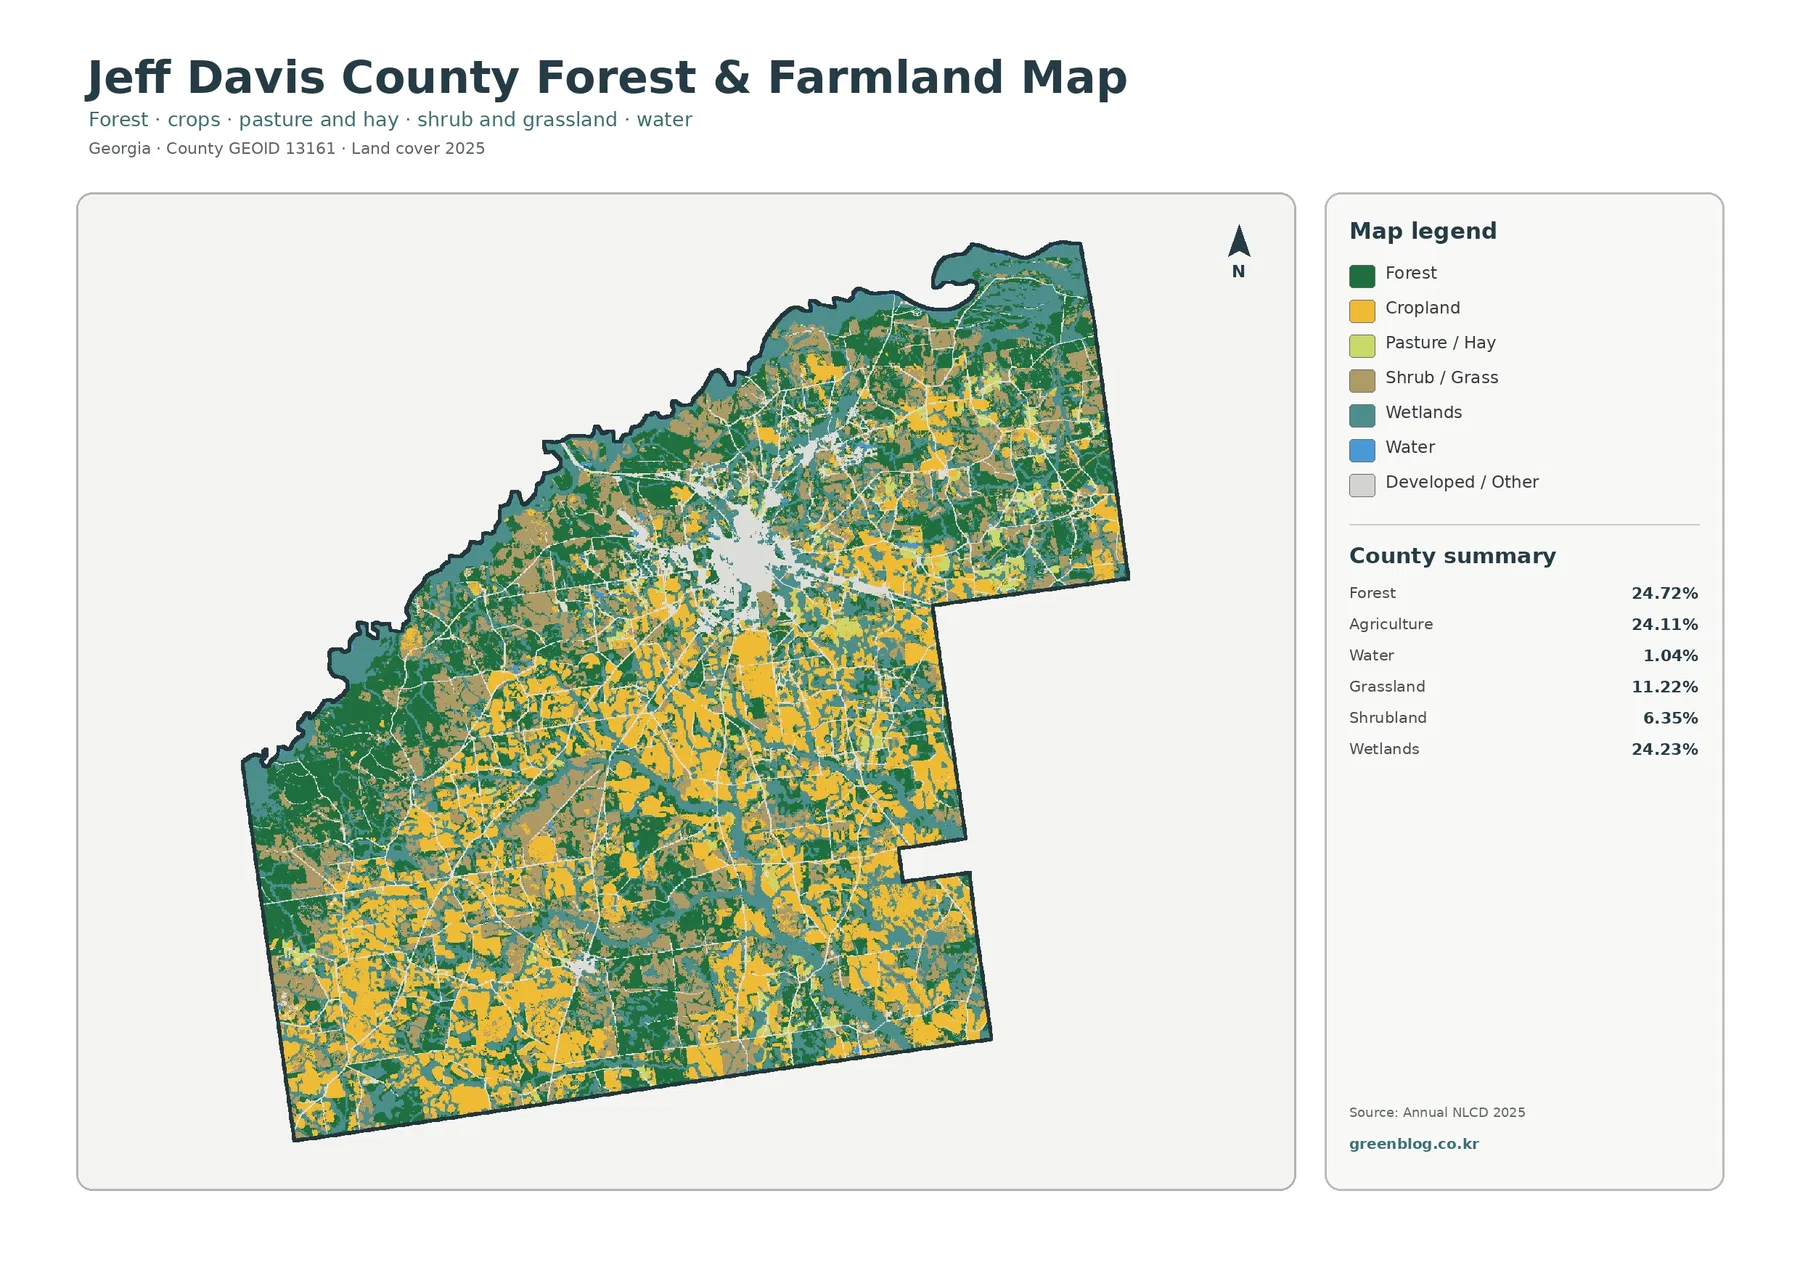
Reducing the visual weight of developed and miscellaneous classes makes the forest-farm-wetland mixture easier to follow. Forest is 24.72%, agriculture 24.11%, and wetlands 24.23%. The focused summary also lists grassland at 11.22%, shrubland at 6.35%, and open water at 1.04%. No single vegetation class forms a simple north-south divide.
Yellow agricultural blocks are broad in parts of the southern and southeastern county and continue into central areas. Dark green forest remains substantial on the western side and reappears in many northern and eastern blocks. Teal wetlands cut through both, sometimes as branching narrow features and sometimes as wider patches. The result is a landscape where field edges, wooded tracts, and wet ground meet repeatedly.
Open water and wetlands should not be merged into one category. Blue water marks exposed water surfaces, while the wetland class can include vegetation and seasonally wet ground. A 1.04% water share can therefore coexist with 24.23% wetlands. The map does not label individual streams, and a teal strip should not be named as a specific creek or river without a hydrography layer.
Official local planning material places Jeff Davis County in southeast Georgia’s Three Rivers region near the Ocmulgee, Oconee, and Altamaha river system. That regional setting is useful context for a county with extensive mapped wetlands, but it does not identify every wetland cell. The supplied image should still be read from its own legend, with named waterways added only from a separate verified map.
UGA Cooperative Extension’s Jeff Davis County agriculture and natural-resources program provides local services such as soil testing, water testing, and research-based farm information. That confirms agriculture and natural resources are active local concerns, but it does not turn the 24.11% agriculture class into a crop inventory. The land-cover map cannot identify individual crop species, ownership, farm boundaries, or forestry management plans.
The 1985–2025 map records a large amount of endpoint class difference
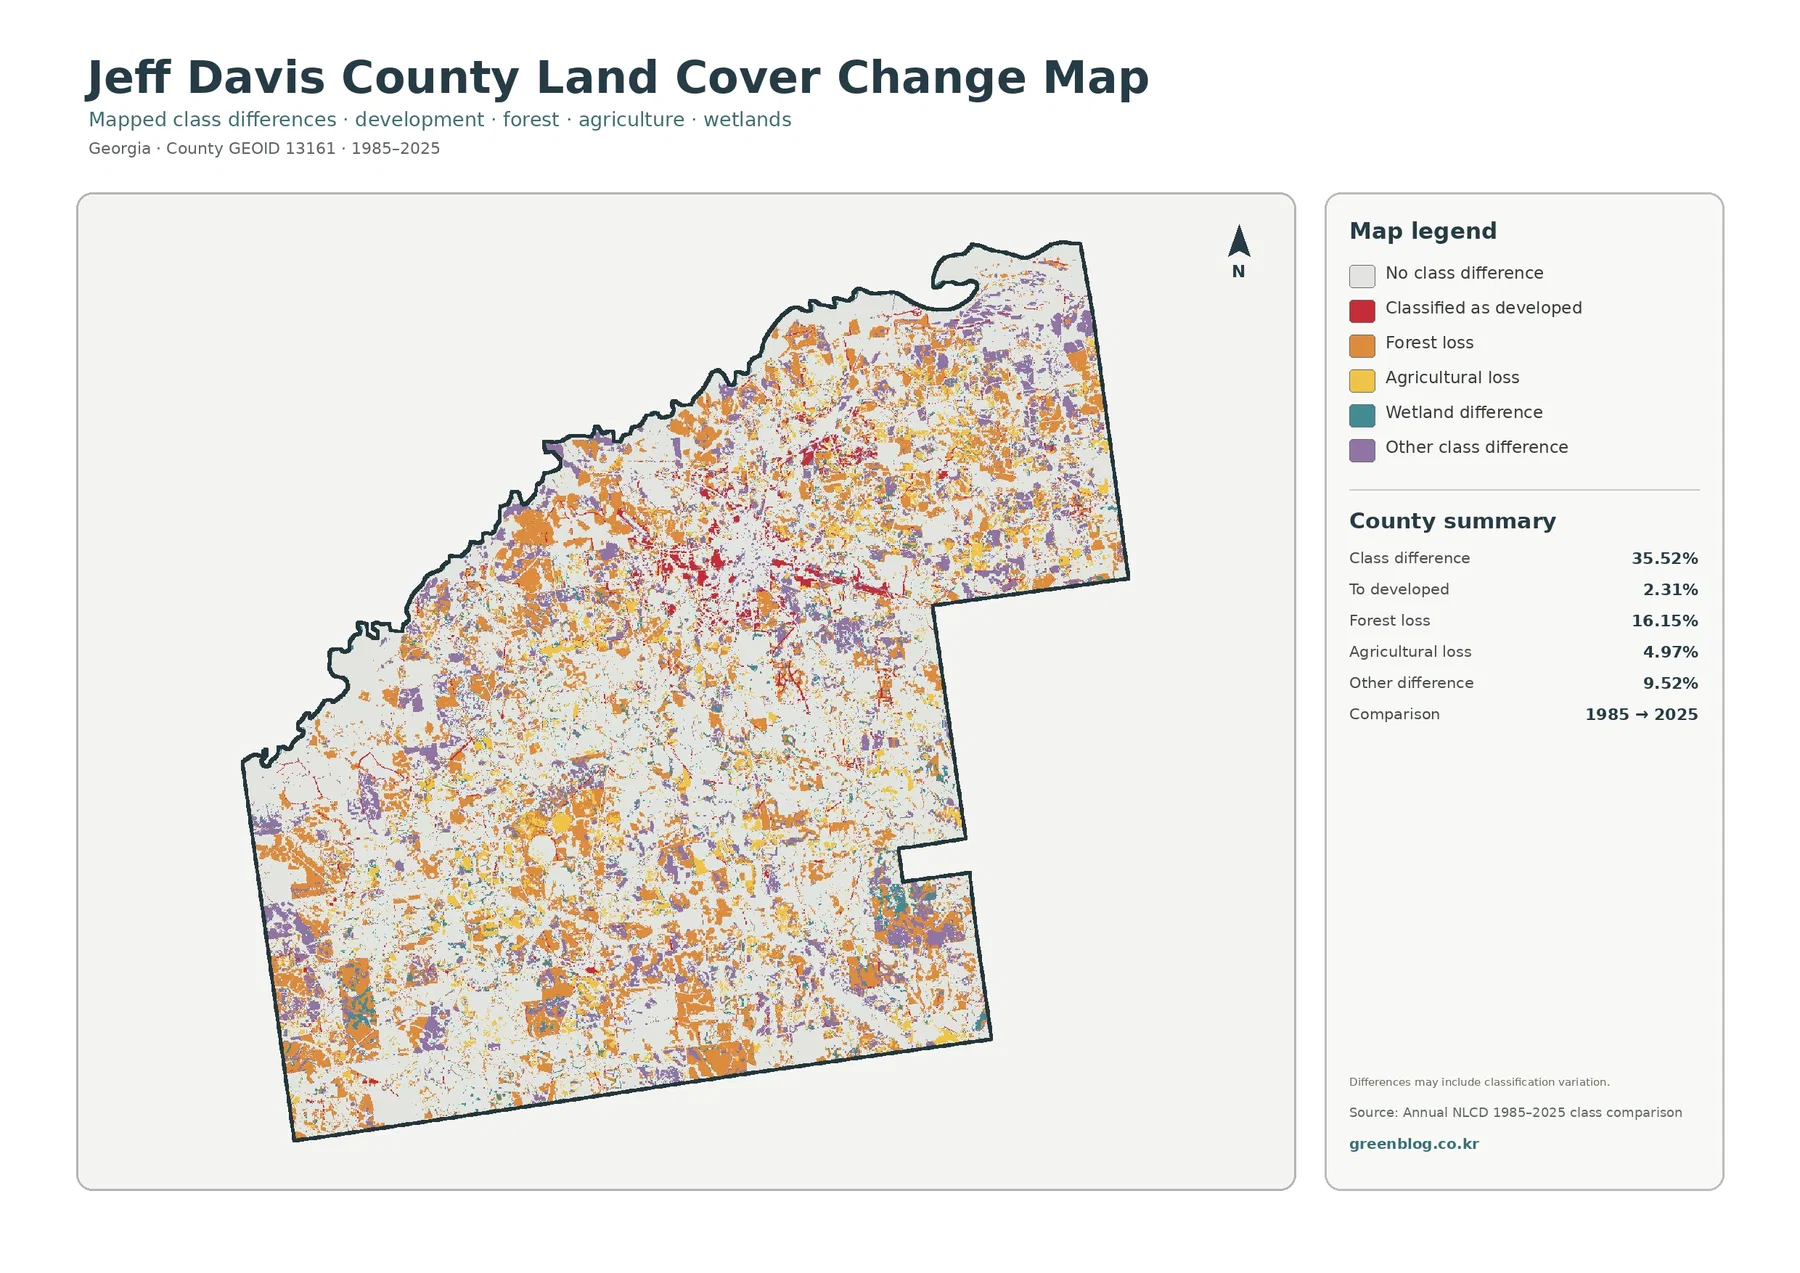
The change summary reports a total class difference of 35.52%. That number is the share of cells carrying different labels at the 1985 and 2025 endpoints. It is not a measure of damaged land, and it does not mean the same acreage was changing continuously for forty years. The map itself warns that classification variation may be included, which is important when imagery dates, seasonal conditions, or mixed pixels differ.
Among the printed categories, forest loss is the largest at 16.15%. Cells classified as developed account for 2.31%, agricultural loss for 4.97%, and other class difference for 9.52%. Orange forest-loss marks are scattered widely across the county. Red development-change cells are more concentrated around the central developed area and along several narrow traces, while purple differences occur in many separate patches.
The legend includes wetland difference, but the summary does not print a separate percentage for it. It would be misleading to derive a remainder and present that value as an official wetland-change rate. The teal change cells can be located visually, but an exact percentage needs the underlying data or a supplied statistic.
“Forest loss” also needs careful wording. It means a cell classified as forest at the earlier endpoint received another class at the later endpoint. It does not identify timber harvest, storm damage, farm expansion, construction, regrowth cycles, or classification error as the cause. Intermediate Annual NLCD years, aerial imagery, forestry records, and local evidence are needed before a particular cluster receives an explanation.
Jeff Davis County Extension reports significant agricultural impacts from Hurricane Helene in 2024. That is an important local event, but the endpoint map alone cannot assign any orange or other-colored cell to the storm. Event attribution requires before-and-after imagery at an appropriate date and scale. Keeping that distinction prevents a real local event from being used as an unsupported explanation for a map pattern.
Hazlehurst and Denton provide local context without becoming map labels
Georgia Department of Community Affairs planning pages treat Jeff Davis County together with its municipalities, Hazlehurst and Denton. Hazlehurst is the county seat and the location of county administrative offices, while Denton is the smaller municipality. Those facts help a reader understand why one developed concentration is much more prominent than other built marks, but the land-cover images are not municipal maps.
For that reason, it is better to use the countywide imagery to discuss concentration and contrast rather than to trace city limits by eye. The red and dark impervious cells around Hazlehurst show a strong built center. Smaller marks elsewhere can indicate roads, structures, or other developed surfaces, but a dot should not automatically be assigned to Denton or any named community unless a verified place layer confirms it.
The same caution applies to the county’s river-region identity. Local history places Hazlehurst west of the Ocmulgee-Oconee confluence that forms the Altamaha, yet the supplied maps do not print those river names. Regional geography can explain why wetlands are an important topic, but it cannot substitute for a labeled hydrography map when the exact course of a river or creek matters.
Use the four maps as a sequence, not as interchangeable pictures
For a county introduction, start with the 2025 land-cover overview. It immediately establishes the near-balance among forest, wetlands, and agriculture and places the main developed concentration inside that rural mosaic. The forest-and-farmland view is the better second choice when the discussion turns to vegetation, farm blocks, open ground, wetlands, and water.
Choose the impervious map when the question is specifically about hard surfaces. The difference between 8.14% developed land and 1.68% mean impervious cover is useful because it shows that “developed” does not mean every square meter is paved. Use the change map last when discussing long-term classification differences; its red cells are not a map of all present-day development.
Annual NLCD is a raster product based on 30-meter cells. One cell receives a predominant land-cover class even when trees, grass, water, pavement, and a building share the same area. Thin roads, drainage ditches, small ponds, narrow forest strips, and field edges can look wider, narrower, or more broken than they are on the ground. Enlarging the image cannot restore parcel detail that was never present in the source cells.
The current view represents the supplied 2025 observation year. Later construction, timber activity, vegetation recovery, or changes in standing water may not appear. Use these maps for broad comparison and visual explanation, then consult current aerial imagery, parcel records, wetland inventories, flood data, or field surveys for decisions that depend on precise boundaries.
Each downloadable JPG measures 2480 × 1754 pixels. That works well for screens, reports, presentations, and many ordinary print layouts. The asset manifest does not mark the files as meeting an A3 high-resolution reference, so a large poster should be proofed before final printing. Upscaling may make the file larger, but it will not create new geographic detail.
A simple question-to-map rule keeps a presentation clear: use the overview for current countywide cover, the vegetation view for forest-farm-wetland relationships, the impervious view for hard-surface intensity, and the endpoint comparison for 1985–2025 class differences. This avoids forcing one image to answer questions it was not designed to answer.
What is included in the four-JPG download
The ZIP contains one JPG for each view discussed above: 2025 land cover, forest and farmland, impervious surface and developed land, and 1985–2025 land-cover change. Used together, the four files make it easier to move from the county’s overall forest-wetland-farm balance to the concentrated Hazlehurst-area development, hard-surface intensity, and mapped endpoint differences.
Frequently Asked Questions
Which land-cover class is largest in Jeff Davis County?
Forest is the largest in the supplied 2025 summary at 24.72%, but wetlands at 24.23% and agriculture at 24.11% are very close. The county is better described as a three-way mixture than as a landscape dominated by one class. Grassland adds 11.22% and developed land 8.14%.
Does the large developed cluster show the exact boundary of Hazlehurst?
No. Its location is consistent with the Hazlehurst area, where county offices and local services are concentrated, but the land-cover image does not draw municipal limits. Red cells describe developed surface classes. An official city-boundary or parcel layer is required for exact jurisdictional limits.
Does 35.52% class difference mean that more than a third of the county was damaged?
No. It is the share of cells with different classifications at the 1985 and 2025 endpoints, and classification variation may be included. The printed categories include 16.15% forest loss, 2.31% classified as developed, 4.97% agricultural loss, and 9.52% other difference. Timing and cause require intermediate imagery and local evidence.
Sources and Reference Data
- MRLC Annual NLCD Data – official access point for annual land-cover and comparison products
- USGS Annual NLCD Land Cover Classification – definitions for forest, wetlands, developed land, agriculture, and related classes
- U.S. Census Bureau TIGER/Line Shapefiles – official county-boundary reference for Jeff Davis County
- UGA Cooperative Extension – Jeff Davis County Agriculture & Natural Resources – local agriculture, natural-resource, soil-testing, and water-testing information
- UGA Cooperative Extension – Jeff Davis County Our Impact – local reporting on Hurricane Helene impacts and Extension response in the county
- Georgia Department of Community Affairs – Jeff Davis County Comprehensive Plan – official planning resources covering Jeff Davis County with Hazlehurst and Denton
Map File Information
The ZIP contains four original JPG maps for comparing Jeff Davis County's forest, wetlands, agriculture, Hazlehurst-area development, impervious surface, and 1985–2025 class differences.
- Included Files: Use only the versions confirmed in the article and supplied images
- File Type: Use the confirmed download contents
- Intended Use: Printing, education, presentations, and map-based projects
Related Maps
- Appling County Georgia Land Cover Map
- Atkinson County Georgia Land Cover Map
- Bacon County Georgia Land Cover Map
Green Map creates custom-edited map images using open geographic data sources such as geoBoundaries, Natural Earth, OpenStreetMap, and government open data.
These maps are edited visual materials, not raw data files, and are provided for education, documents, presentations, and graphic reference.