Jackson County in northeast Georgia has a land-cover pattern that is neither simply rural nor continuously built up. The 2025 summary places forest first at 44.59%, followed by agriculture at 27.88% and developed cover at 19.78%. The four maps on this page separate those layers so you can compare the countywide mix, forest and farm areas, impervious surfaces, and mapped class differences between 1985 and 2025.
All four original JPG maps are available together in one download. The set is useful when you need a clean county reference for a report, classroom activity, presentation, or your own side-by-side comparison rather than a single screenshot with every topic combined.
Table of Contents
Development appears in distinct clusters rather than as one continuous urban area
One of the clearest features in Jackson County is the way developed land is grouped. Large concentrations appear in the southwest, west-central part of the county, and northeast, while thinner developed lines connect many smaller patches. Forest and agricultural cover remain between those centers, so the built pattern reads as several separated concentrations rather than a solid urban blanket.
That pattern fits the county’s transportation and planning context. Official planning documents repeatedly identify Interstate 85 and the Braselton, Jefferson, and Commerce areas as important growth and travel locations. The maps on this page do not label individual highways, so they should not be used to assign every red cell to a named road. Still, comparing the land-cover and impervious-surface views makes the corridor-like arrangement of development easy to recognize.
The 2025 countywide map balances forest, farms, and developed land
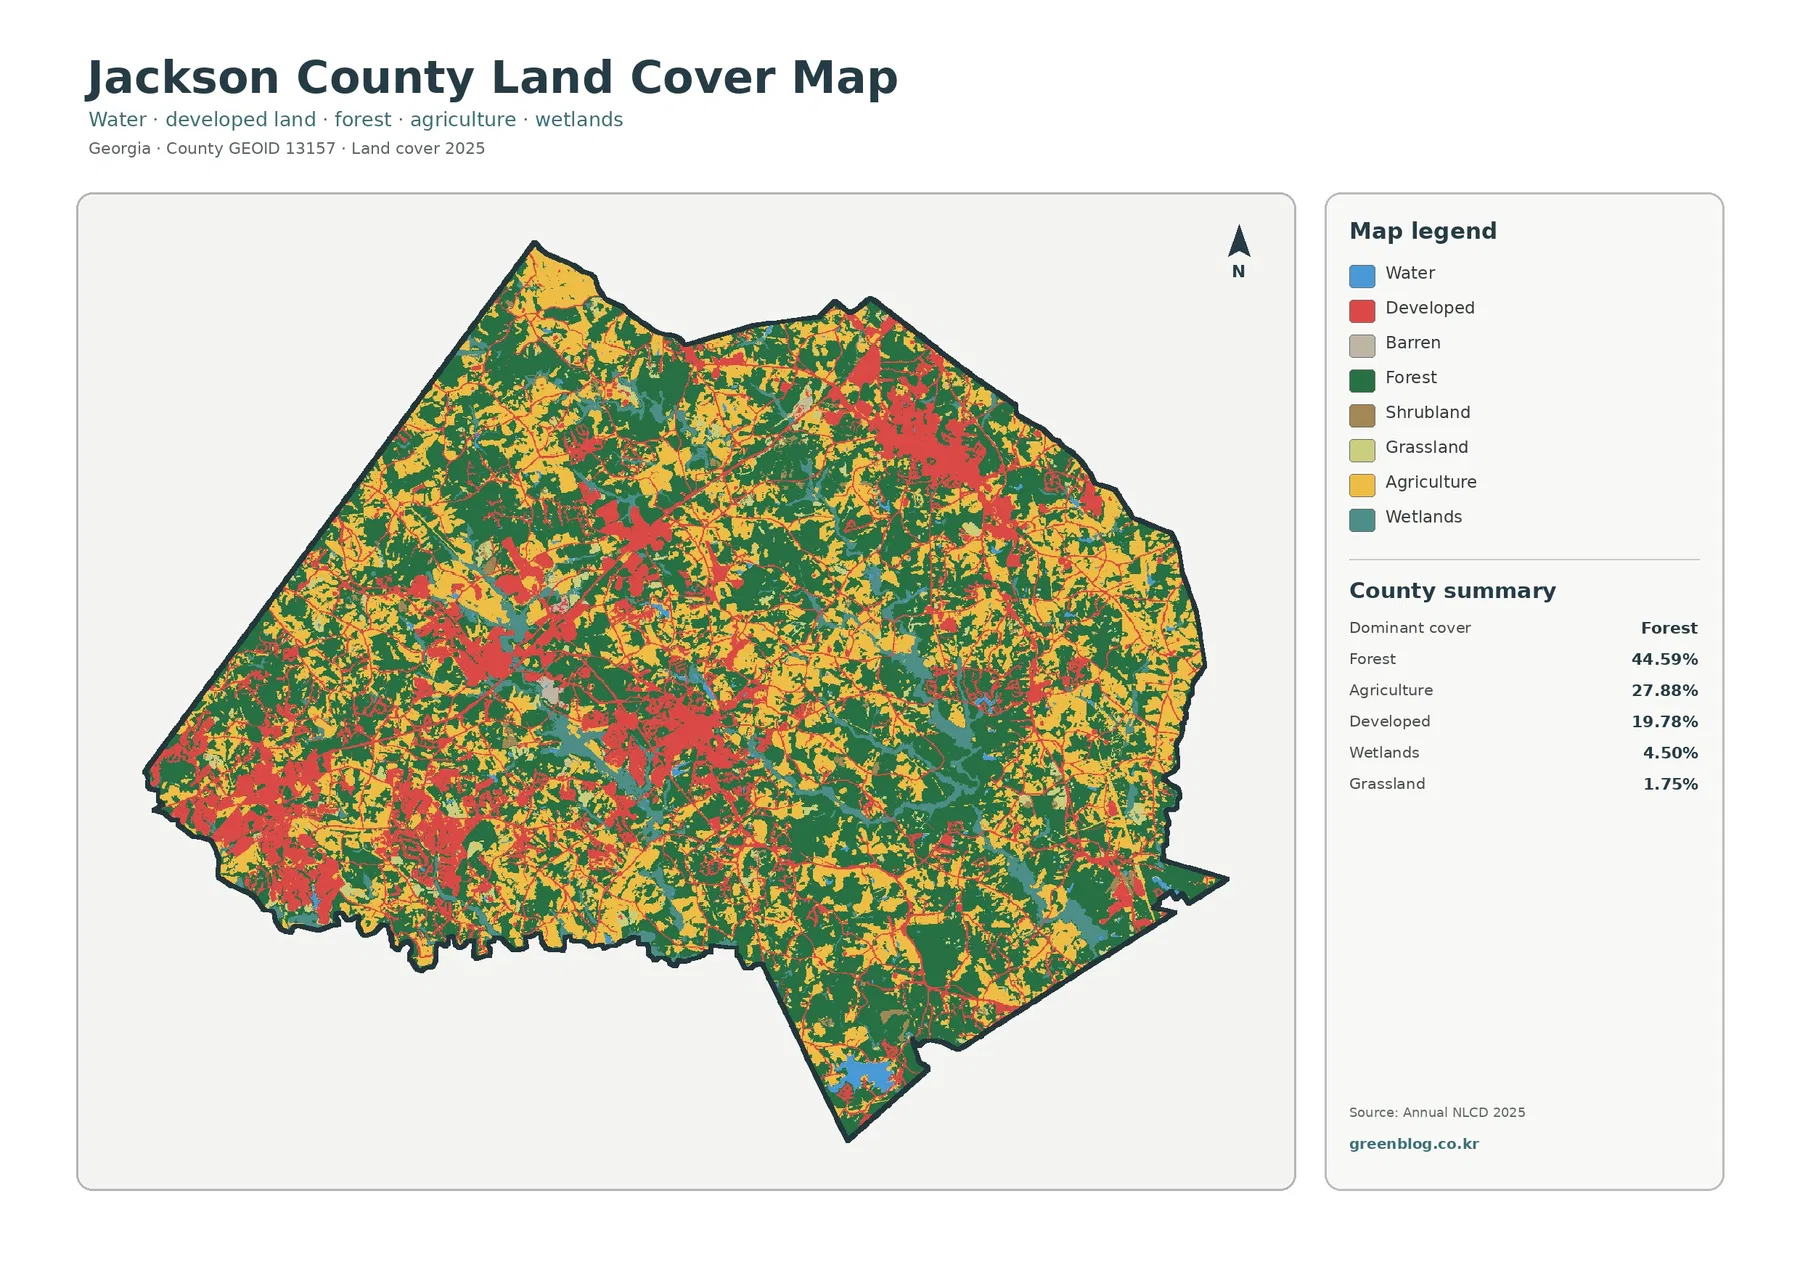
Forest is the dominant class at 44.59%, but it does not form one unbroken block. Broad dark-green areas are especially noticeable across the eastern and southeastern portions of the county, with additional forest patches in the center and northwest. Agricultural cover, shown in yellow, repeatedly breaks into and around those wooded areas. The result is a fine-grained mix across much of the county rather than a sharp forest-versus-farm divide.
Developed cover accounts for 19.78%. Because it is concentrated, that percentage looks very different depending on where you focus. The southwest contains one of the strongest red groupings, west-central Jackson County contains another series of connected built patches, and the northeast has a broad developed concentration. Between these areas, smaller roads and settlements create thinner red lines through forest and farm cover.
A forest-and-farmland view makes the rural mosaic easier to separate
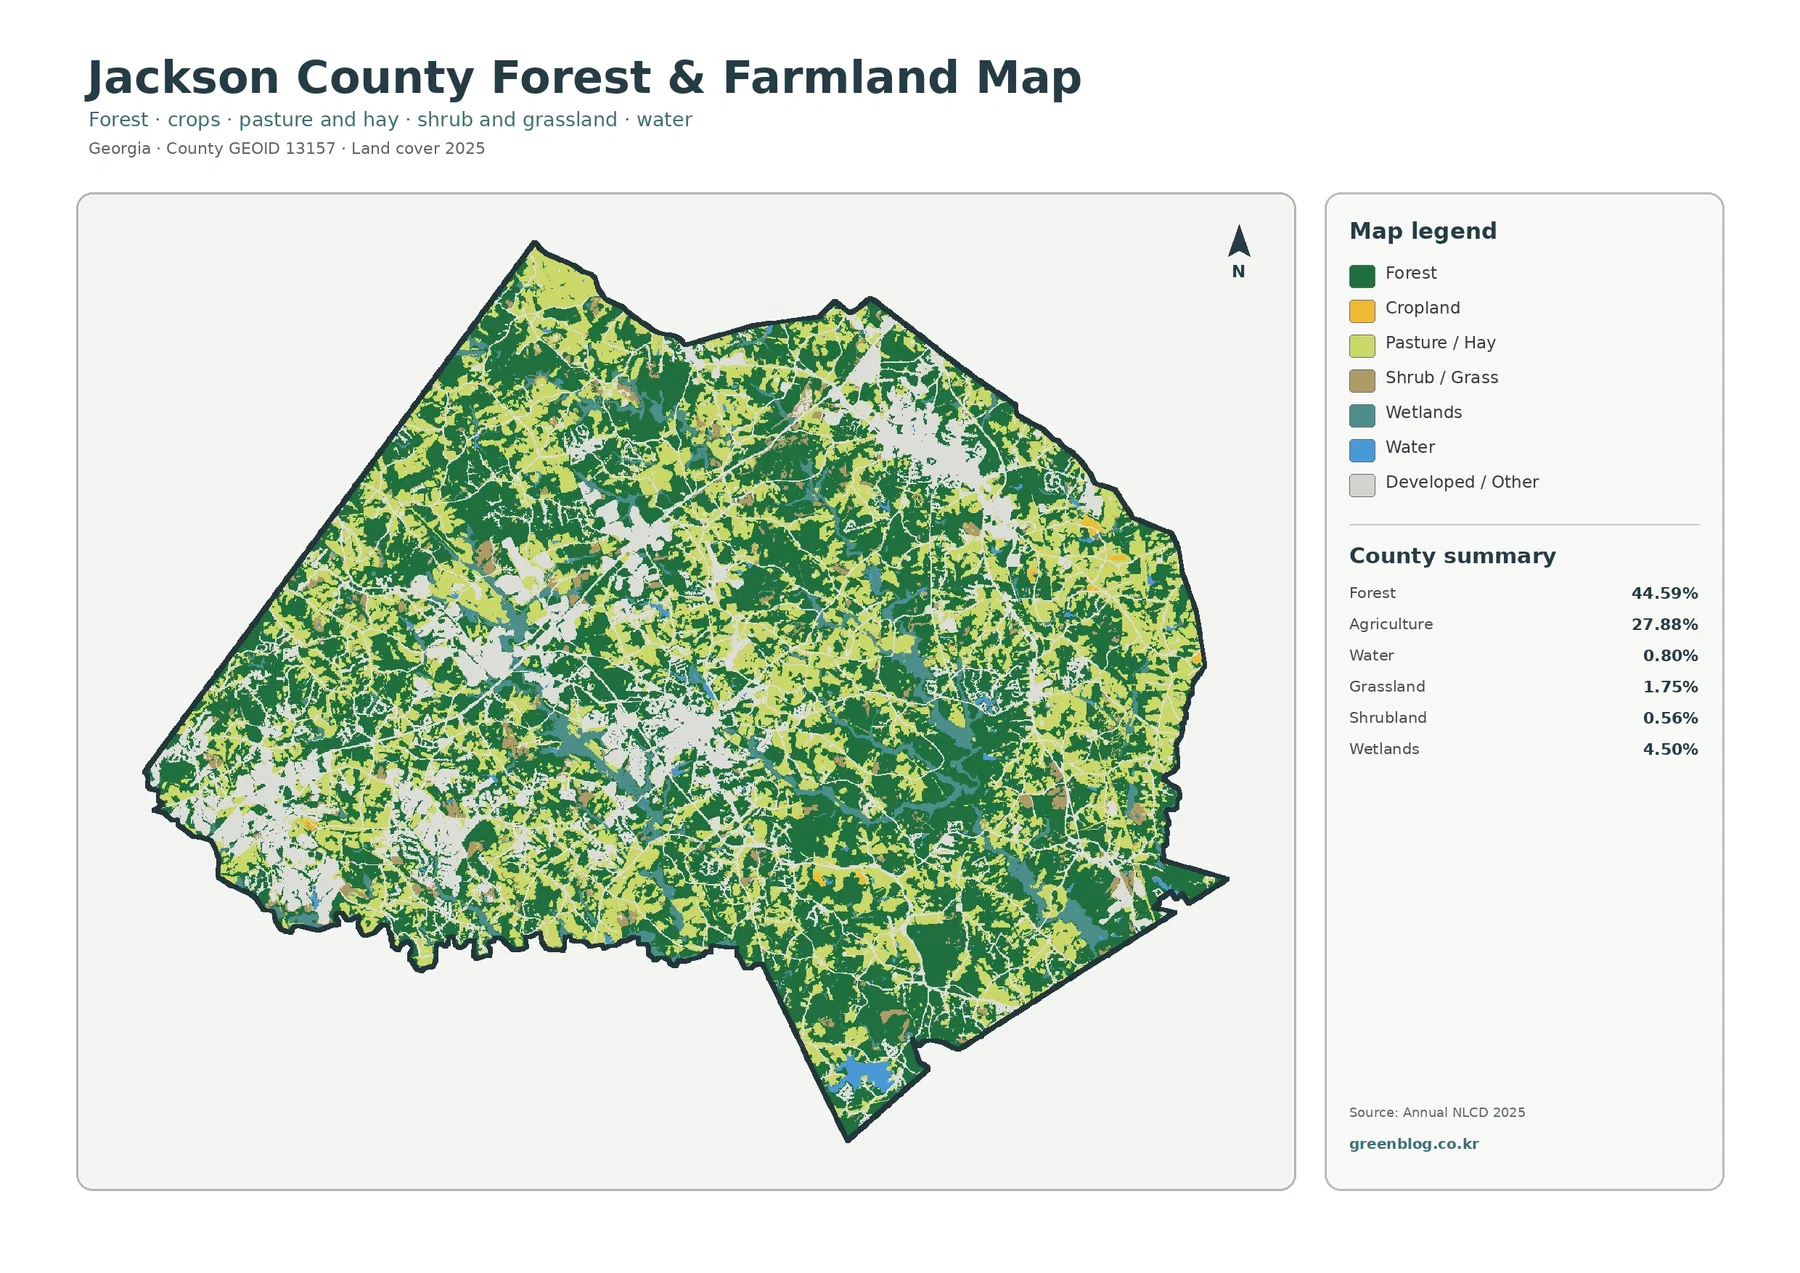
Removing most of the developed detail from the foreground changes how the county reads. Dark-green forest remains extensive in the southeast and east, but large wooded pieces also appear farther north and west. Cropland and pasture or hay are spread through the county in many separate fields. There is no single farm belt occupying one side of Jackson County; instead, agricultural openings are interwoven with woods and settled areas.
In the west and southwest, the light developed-or-other background interrupts forest and farmland more often. The southeast has larger continuous forest patches, while northern and eastern sections contain many transitions between woods and agricultural openings. This contrast is useful for a presentation because it shows where the county still has relatively broad wooded areas and where the land is more fragmented by development or other cover.
Impervious surfaces reveal the strongest built footprints
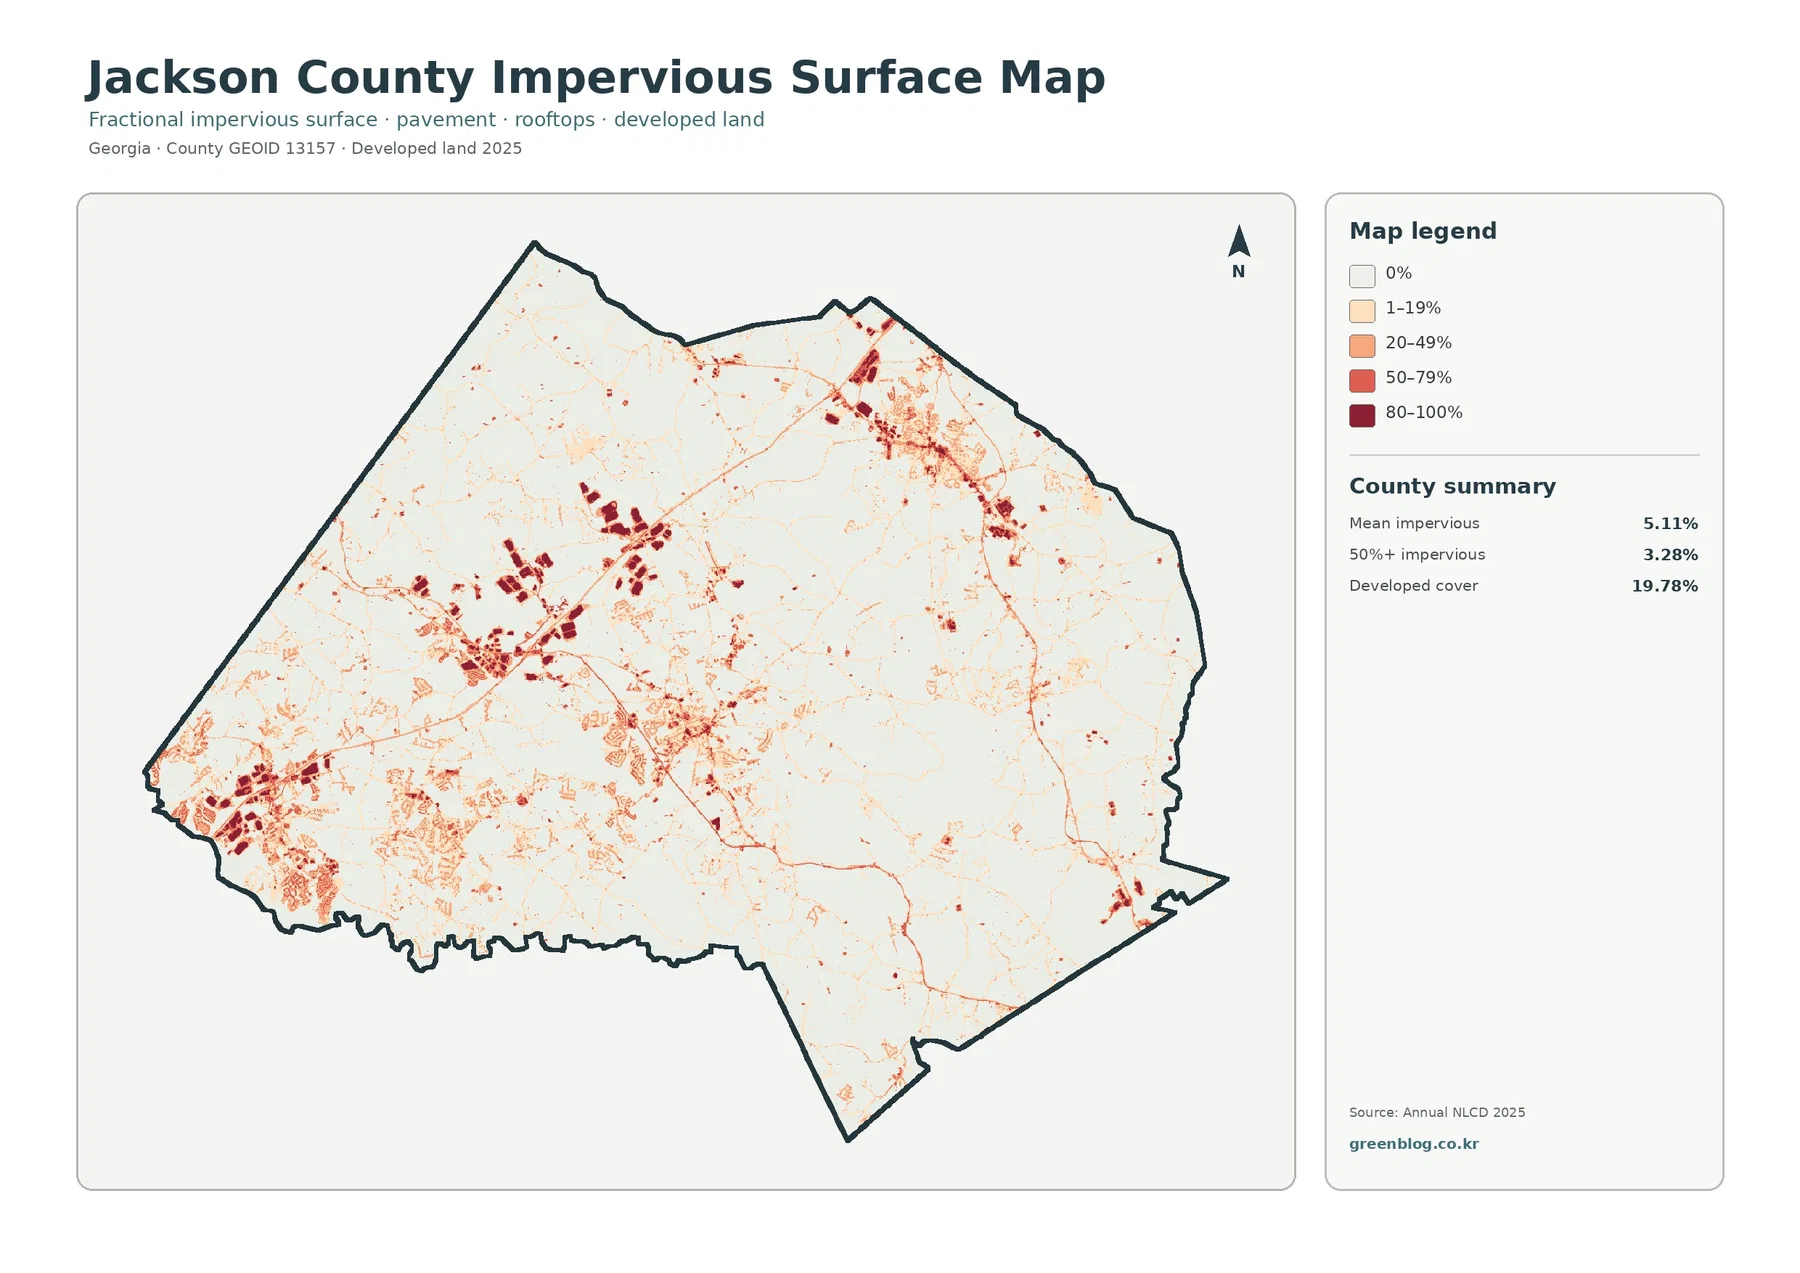
Impervious surface means ground covered by materials such as pavement and rooftops that do not readily absorb rainfall. Jackson County has a mean impervious value of 5.11%, and 3.28% of the mapped area falls in cells that are at least 50% impervious. Those values are much lower than the 19.78% developed-cover share because a developed land-cover class can still contain lawns, trees, bare soil, and other permeable surfaces.
The darkest impervious cells are strongly concentrated. Large blocks stand out in the southwest, several west-central clusters are linked by thinner developed lines, and the northeast contains another prominent concentration. Much of the east and southeast stays very light on this map even where the general land-cover map includes small roads or scattered development. That makes the impervious layer a better choice when the question is not merely “where is development?” but “where is the hard built surface most intense?”
The 1985–2025 comparison highlights where mapped classes differ
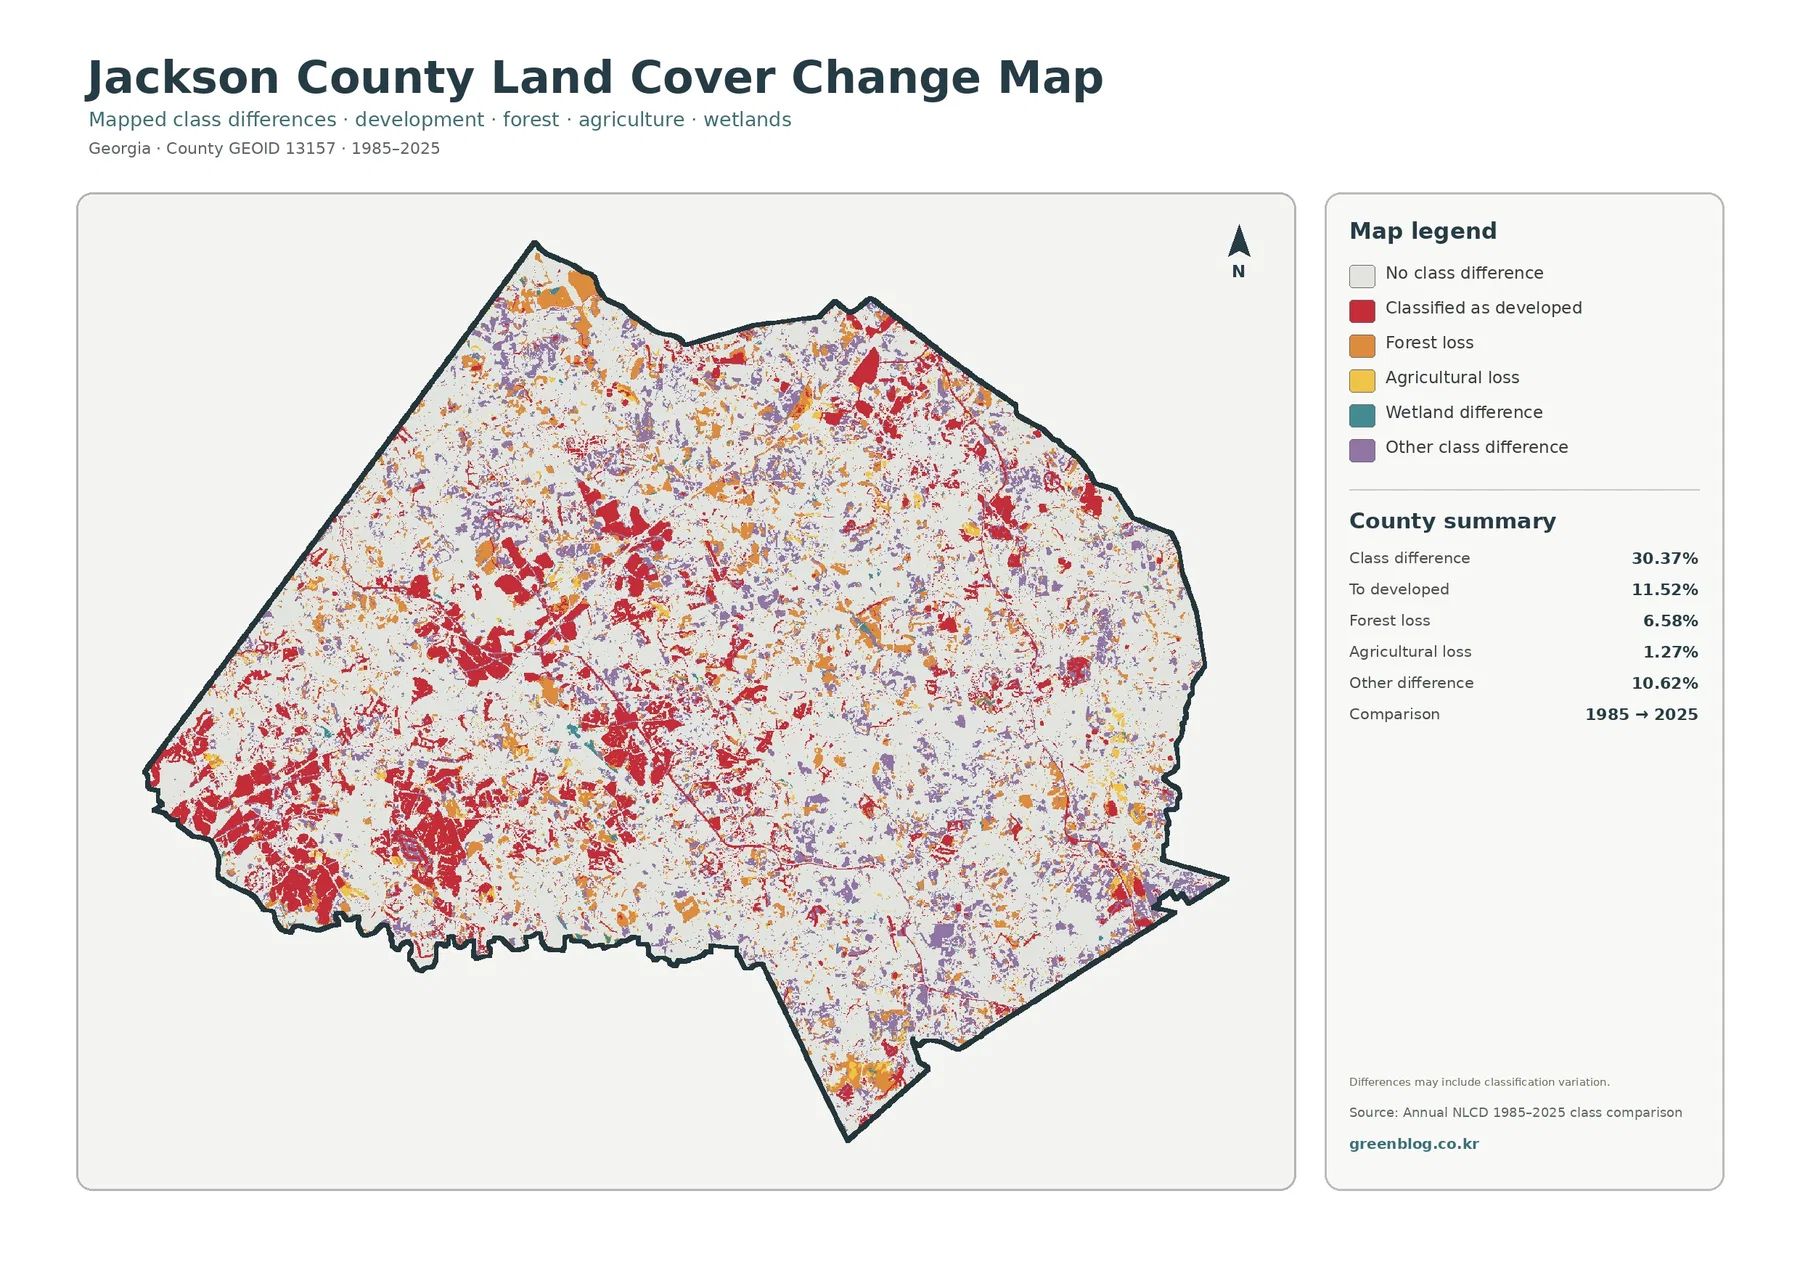
The change map compares Annual NLCD classifications for 1985 and 2025. Its summary reports class differences across 30.37% of the county. Within the displayed categories, 11.52% is mapped as a change to developed, 6.58% as forest loss, 1.27% as agricultural loss, and 10.62% as other class difference. The legend also includes wetland difference. These are classification comparisons, not a parcel-by-parcel history of every physical change.
Areas classified as changing to developed are especially prominent in the southwest and west-central portions of Jackson County, with another major group in the northeast. Those locations broadly overlap the strongest present-day developed and impervious patterns. Looking at the two maps together is more informative than using either one alone: the change layer indicates where the long-term classification moved toward developed cover, while the impervious layer shows where hard surfaces are concentrated in the current map.
Forest-loss colors are more scattered. Orange patches appear across the northwest, north, center, and other parts of the county rather than forming only one urban-size block. Some sit near developed changes, while others are surrounded by agricultural or remaining forest cover. The map cannot tell you whether a particular orange patch represents permanent conversion, timber activity followed by regrowth, a different vegetation stage, or classification variation. A causal explanation would require yearly imagery or local records.
Wetlands and river corridors add context that area percentages can hide
The county comprehensive plan specifically addresses river-corridor protection for the North Oconee, Middle Oconee, and Mulberry rivers. This official planning context is helpful when discussing why streamside landscapes matter locally. It is also a reminder that land-cover classification and regulatory boundaries are different products. An NLCD wetland cell is not a legal wetland determination, and the map cannot replace a survey, jurisdictional review, or current county zoning information.
Choosing the right map for a specific question
Use the general land-cover map when you want one balanced picture of the county. It is the best starting point for seeing the 44.59% forest share alongside agriculture, development, wetlands, and water. For a class presentation, it also makes it easy to explain why countywide percentages and local concentration can tell different stories.
The impervious map is the clearest option for built intensity. It emphasizes rooftops and pavement rather than every land-cover cell that happens to be classified as developed. For the I-85 growth context, this is often the most revealing companion map because the strongest clusters and connecting lines stand out against a mostly light background.
Reading the maps without treating them as parcel surveys
Annual NLCD is a raster product, meaning the landscape is divided into grid cells and each cell is assigned a classification or value. Real ground surfaces can be more complicated than one cell label. Along forest edges, small roads, narrow streams, or mixed residential areas, several surface types may fall within the same cell. The displayed class is therefore a generalized representation, not a surveyed boundary.
Observation date matters as well. The 2025 land-cover and impervious maps describe the mapped condition for that data year, so later construction, clearing, farming changes, or vegetation recovery may not appear. The 1985–2025 comparison only contrasts the selected classifications. A place may have changed several times during those four decades and still end in a class similar to the starting condition.
Land cover is also different from zoning, ownership, and legal land use. A forest-colored area is not automatically protected land, and an agriculture-colored area is not proof that a particular crop is currently being produced. Developed cover does not tell you whether the legal zoning is residential, commercial, or industrial. For those questions, consult Jackson County Planning & Zoning and current local GIS records.
Frequently Asked Questions
What is the largest land-cover class in Jackson County?
Forest is the largest 2025 class at 44.59%. Agriculture follows at 27.88%, and developed cover accounts for 19.78%. The map shows that forest is widespread rather than confined to one corner, with especially broad patches in the east and southeast as well as substantial wooded areas elsewhere in the county.
Which map is best for seeing the I-85 development pattern?
Start with the impervious-surface map if you want the strongest built footprint. Its darker cells make major concentrations in the southwest, west-central area, and northeast easier to separate from lightly developed surroundings. The general land-cover map is better when you also want to see the forest and agricultural cover around those developed clusters.
Does the 30.37% class-difference value mean that exactly 30.37% of the land physically changed?
No. The change map compares classifications for 1985 and 2025, and its note warns that differences may include classification variation. Values such as 11.52% mapped to developed and 6.58% forest loss are useful for locating broad patterns, but a parcel-level history requires additional annual imagery, records, or field verification.
Map File Information
The four original Jackson County land-cover maps are packaged together so you can use the JPG files outside the web page.
- Included Versions: land cover, forest and farmland, impervious/developed land, and land-cover change
- File Type: one ZIP containing four JPG images
- Intended Use: printing, classroom material, county comparison, presentations, and reference graphics
Related Maps
- Appling County Georgia Land Cover Map
- Atkinson County Georgia Land Cover Map
- Bacon County Georgia Land Cover Map
Sources and references
- MRLC Annual NLCD Data – official access point for the land-cover dataset used as the map source
- USGS Annual NLCD Land Cover Classification – definitions and guidance for interpreting land-cover classes
- Jackson County Comprehensive Plan – local context for growth, agricultural and forestry areas, and protected river corridors
- UGA Extension: Jackson County Agriculture & Natural Resources – county-level agricultural and natural-resource information
Green Map creates custom-edited map images using open geographic data sources such as geoBoundaries, Natural Earth, OpenStreetMap, and government open data.
These maps are edited visual materials, not raw data files, and are provided for education, documents, presentations, and graphic reference.