Forest dominates Dawson County in the supplied 2025 data, covering 74.73% of the county. Development is much smaller overall, yet it becomes conspicuous in the southeast and around Dawsonville. This Dawson County Georgia Land Cover Map page compares that forested setting with agriculture, built land, water, hard surfaces, and mapped class differences over time.
Four map views are included: 2025 land cover, forest and farmland, impervious surface and developed land, and a 1985–2025 class comparison. The WebP previews are placed beside the discussion, while the four original 2480 × 1754-pixel JPG maps are available together in one download for county profiles, classroom work, environmental comparisons, and presentation graphics.
Table of Contents
A heavily forested county with a distinctly busier southeast
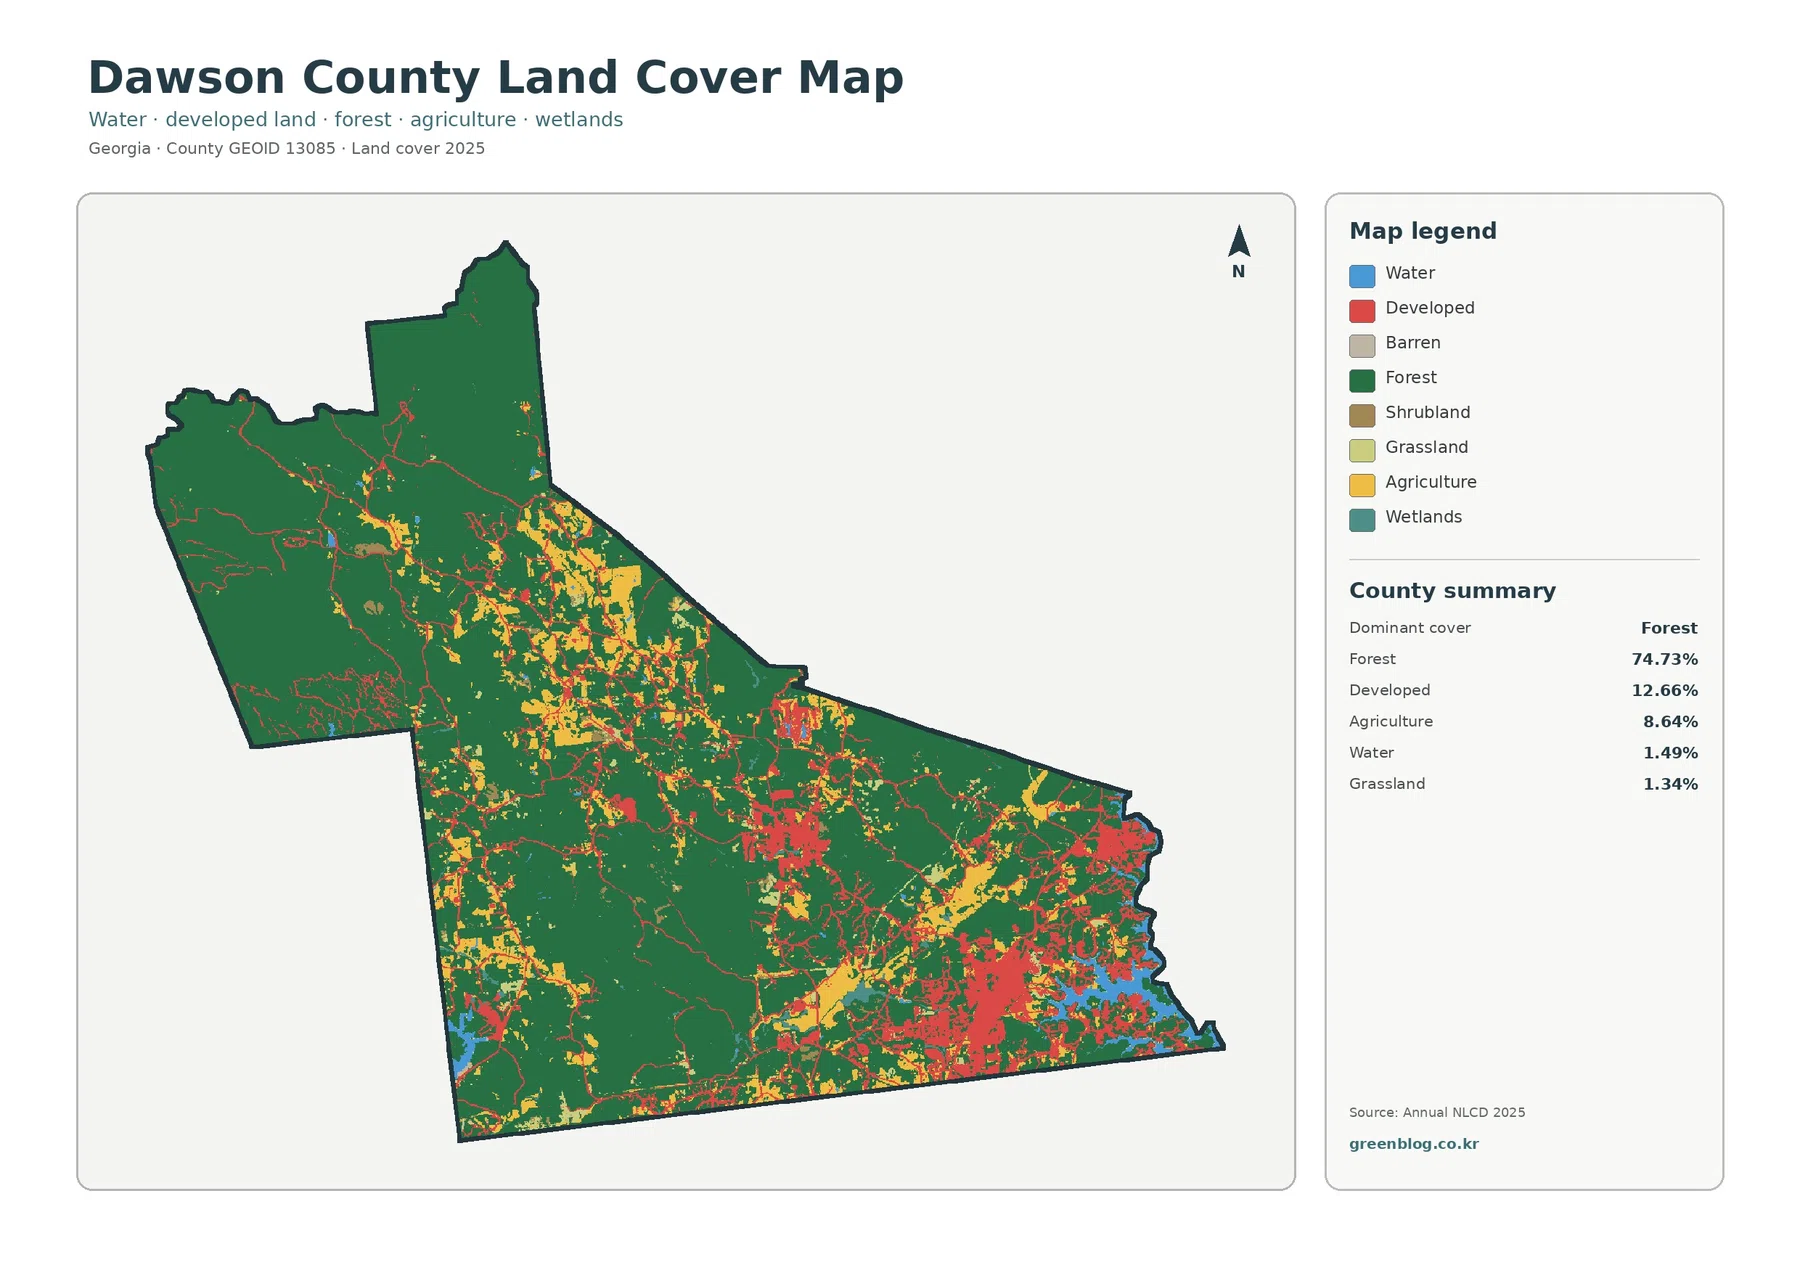
The county summary makes the basic pattern clear. Forest accounts for 74.73% of Dawson County, followed by developed land at 12.66% and agriculture at 8.64%. Water covers 1.49% and grassland 1.34%. The companion forest-and-farmland view also reports shrubland at 0.63% and wetlands at 0.46%. Those percentages describe the whole county, but the map is especially useful because the smaller classes are not spread evenly.
Large, continuous forest areas occupy much of the west and north. Thin developed lines follow roads through those areas, but broad red patches are uncommon. The southeast is different. Developed cells become much more frequent there, and agricultural areas also appear among the forest. A second concentration of built land sits nearer the south-central part of the county around Dawsonville. This contrast keeps the county from looking like a uniform block of forest even though forest is by far the largest class.
Dawson County’s official comprehensive plan provides useful context for this distribution. It identifies growth pressure along major corridors including GA 400, SR 53, SR 136, and SR 9. The southeast cluster on the land-cover map fits that corridor-oriented setting, particularly around GA 400 and SR 53. The map itself does not label zoning districts or individual projects, so the correct interpretation is that developed cover and the major corridor occupy the same part of the county, not that every red cell represents one specific development action.
Water occupies only 1.49% of the mapped area, yet blue cells are noticeable on the eastern and southeastern edge. County planning documents explain that most of Dawson County lies in the Etowah River watershed, while a smaller area east of GA 400 drains toward Lake Lanier in the Chestatee/Chattahoochee basin. That watershed split helps explain why a small countywide water percentage can still matter geographically along the eastern side.
Hard surfaces reveal where development is most concentrated
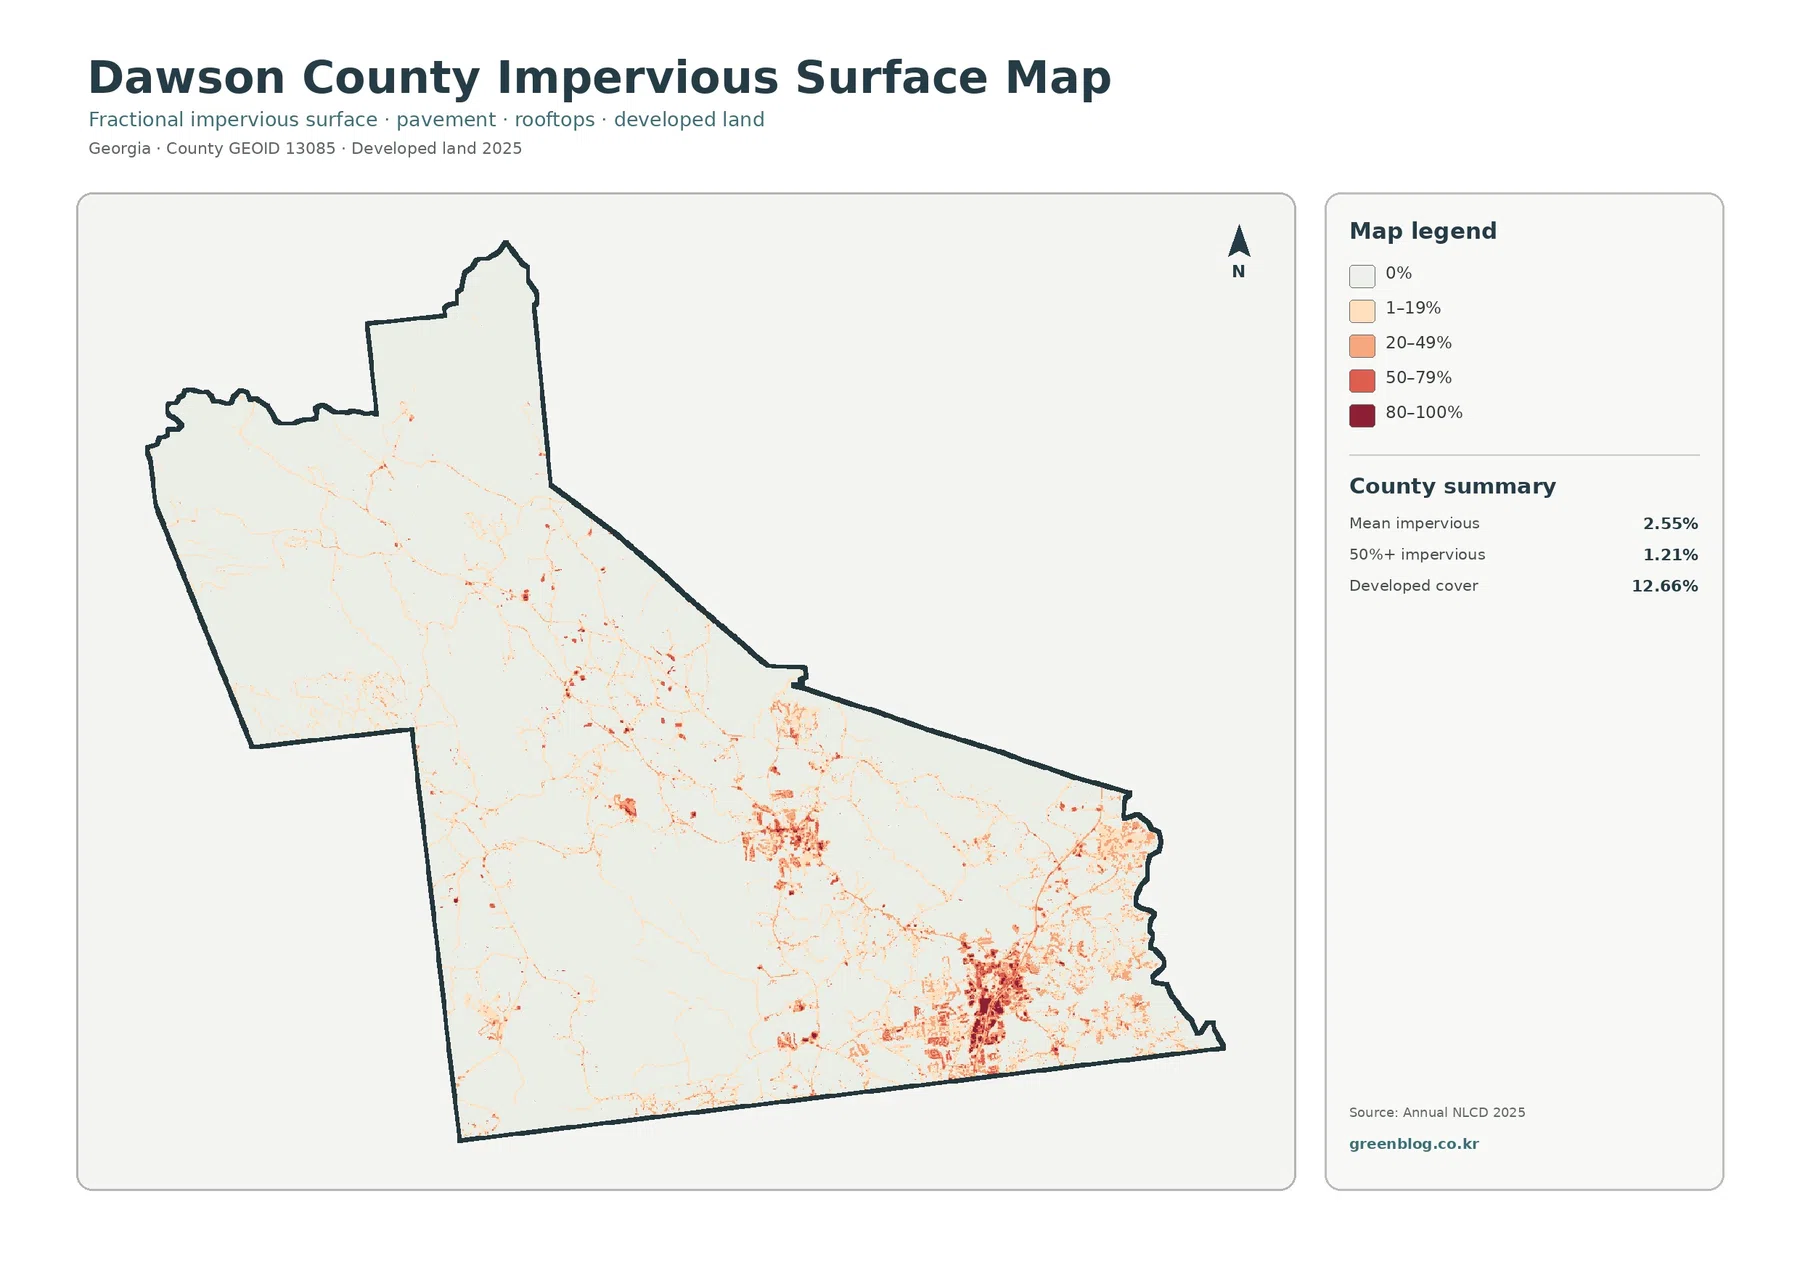
Impervious surface means pavement, rooftops, parking lots, and other materials that do not readily absorb water. Dawson County’s mean impervious value is 2.55%, and only 1.21% of the county falls in the 50%-or-higher impervious category. Both figures are much lower than the 12.66% developed-cover share because developed classes can include lawns, trees, bare soil, and other permeable surfaces around buildings and roads.
The impervious map gives the southeast a very different visual weight than the west. Most of the county remains pale, while stronger orange and red values cluster around the GA 400 corridor and adjacent developed areas. Dawsonville forms another smaller hard-surface center farther west. Between these centers, roads appear as narrow lines rather than broad paved zones. The result is a county where development is easy to identify but occupies a limited footprint relative to the surrounding forest.
Dawson County’s GIS department publishes separate Georgia 400 corridor maps, which confirms the planning importance of this transportation corridor. That official context is useful when reading the impervious surface view, but the land-cover product should still be used at county scale. A dark cell does not provide a building outline, a parcel boundary, or the legal status of a site. It simply indicates a relatively high hard-surface fraction within the underlying raster cell.
This distinction matters for stormwater and development discussions. A county can have a noticeable developed share while maintaining a much smaller countywide hard-surface average. In Dawson County, the concentration of pavement and rooftops in the southeast means runoff-related questions may differ greatly between the GA 400 area and the large forested tracts to the west and north. Detailed drainage design still requires engineering data, current site mapping, and field information rather than this generalized county image.
Forest remains continuous, while farmland breaks into smaller interior patches
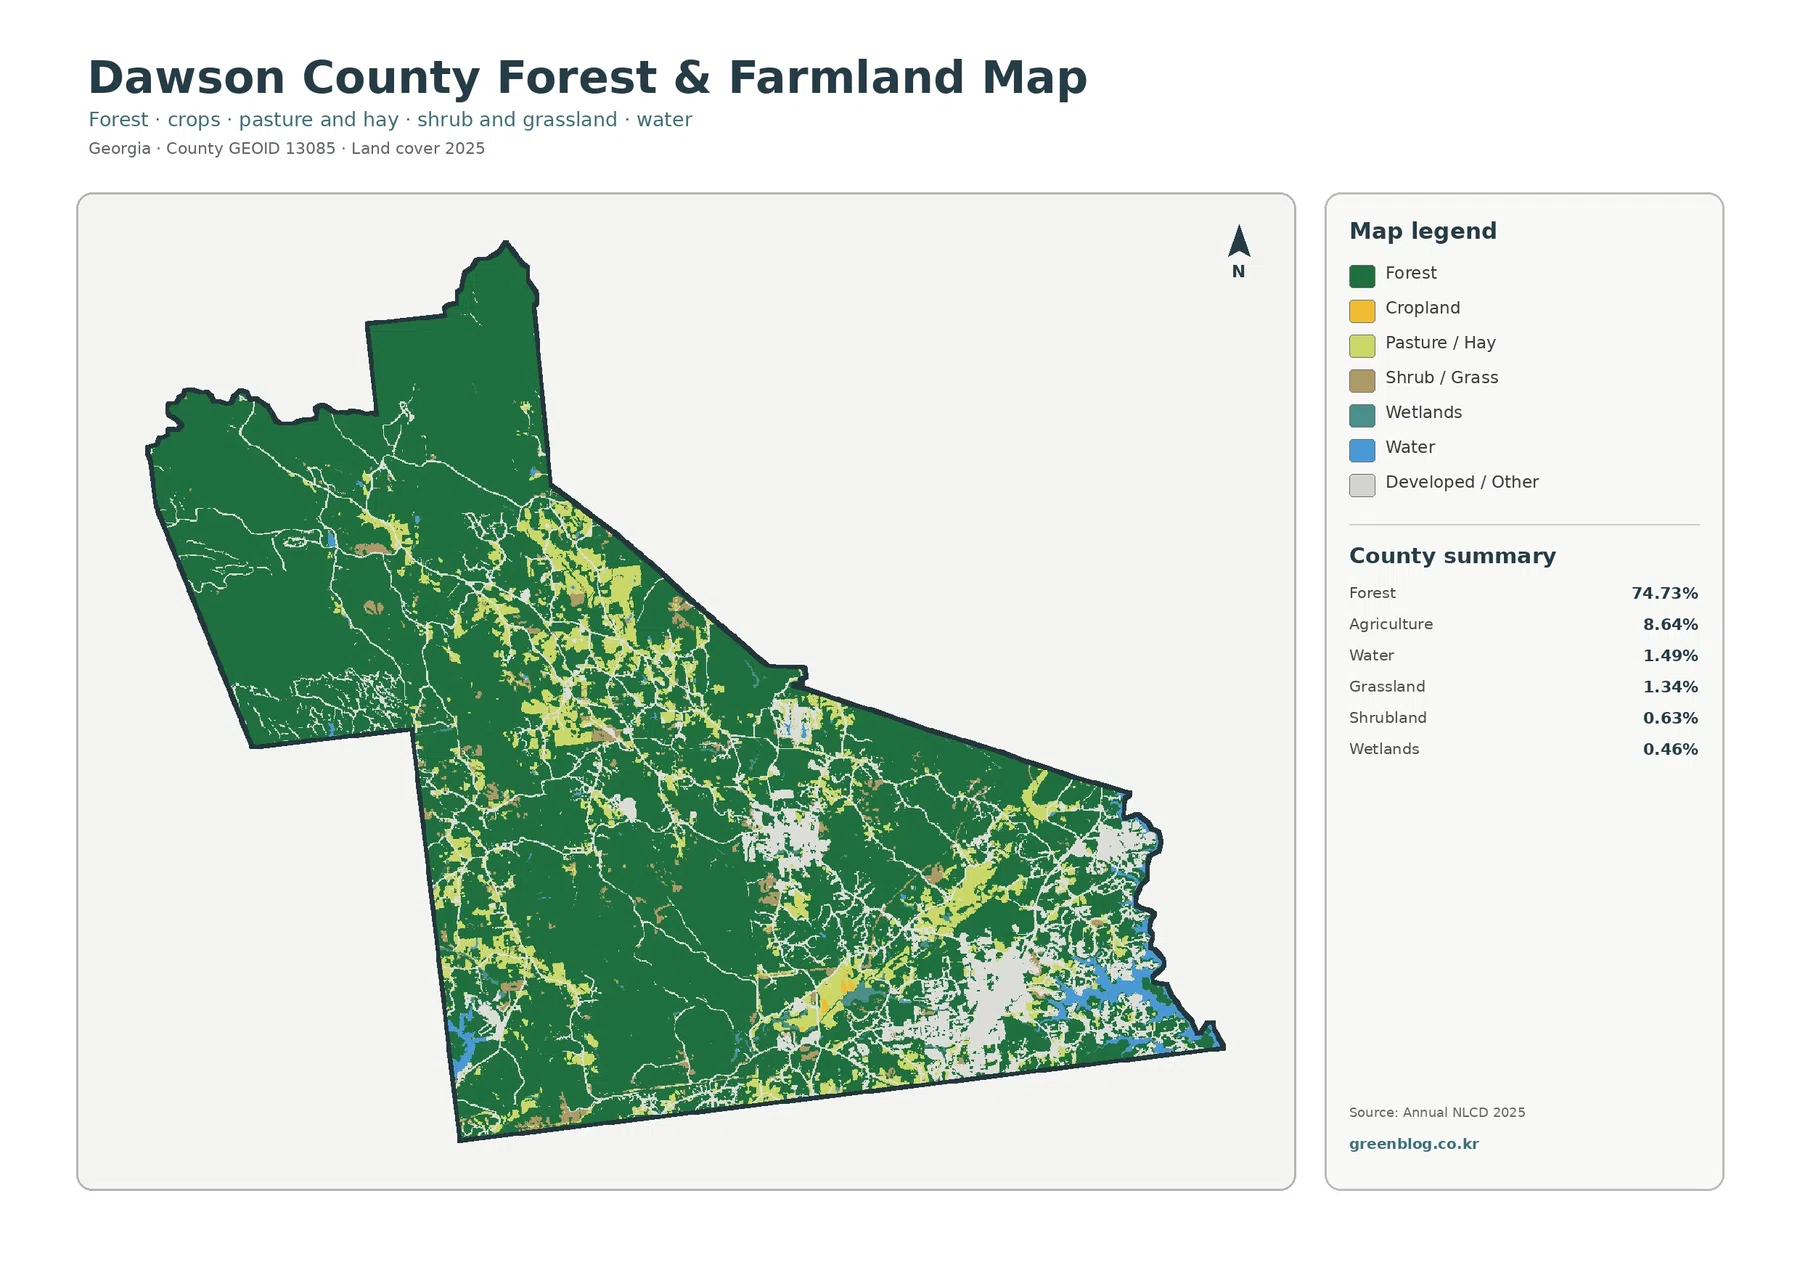
Removing most of the detailed developed classes makes the county’s forest pattern even more obvious. Dark green covers broad western and northern areas with relatively few interruptions. Agricultural and grassland colors appear more often through the center and toward the northeast, where they form scattered blocks rather than one continuous farm belt. This is an important difference from counties in southern Georgia where cropland can dominate entire sections of the map.
Agriculture accounts for 8.64% of Dawson County, enough to create visible openings inside the forest but not enough to define the countywide landscape. Grassland adds 1.34%, shrubland 0.63%, and wetlands 0.46%. Because these smaller categories frequently touch forest edges, the map is useful for showing transitions rather than only totals. It also makes clear that a high forest percentage does not mean every interior area has the same vegetation or land-cover history.
The west is especially useful as a visual reference because it contains large green areas with comparatively little agriculture or development. Dawson County planning materials also discuss the large Dawson Forest tract as an important open-space and natural-resource area. The map does not show the official Dawson Forest boundary, so the entire western green area should not be labeled as that tract. Instead, the county-specific planning information helps explain why large forested landscapes remain a major part of local land-use discussions.
Wetlands are a small share in the county summary, but their mapped area should not be treated as a legal wetland inventory. Annual NLCD assigns generalized land-cover classes to 30-meter cells. Narrow wet areas, streamside vegetation, and mixed forest-wetland locations can be simplified at that scale. Anyone evaluating a particular property needs current imagery, official environmental data, and, when necessary, site-specific review.
The 1985–2025 comparison highlights growth without turning every change into development
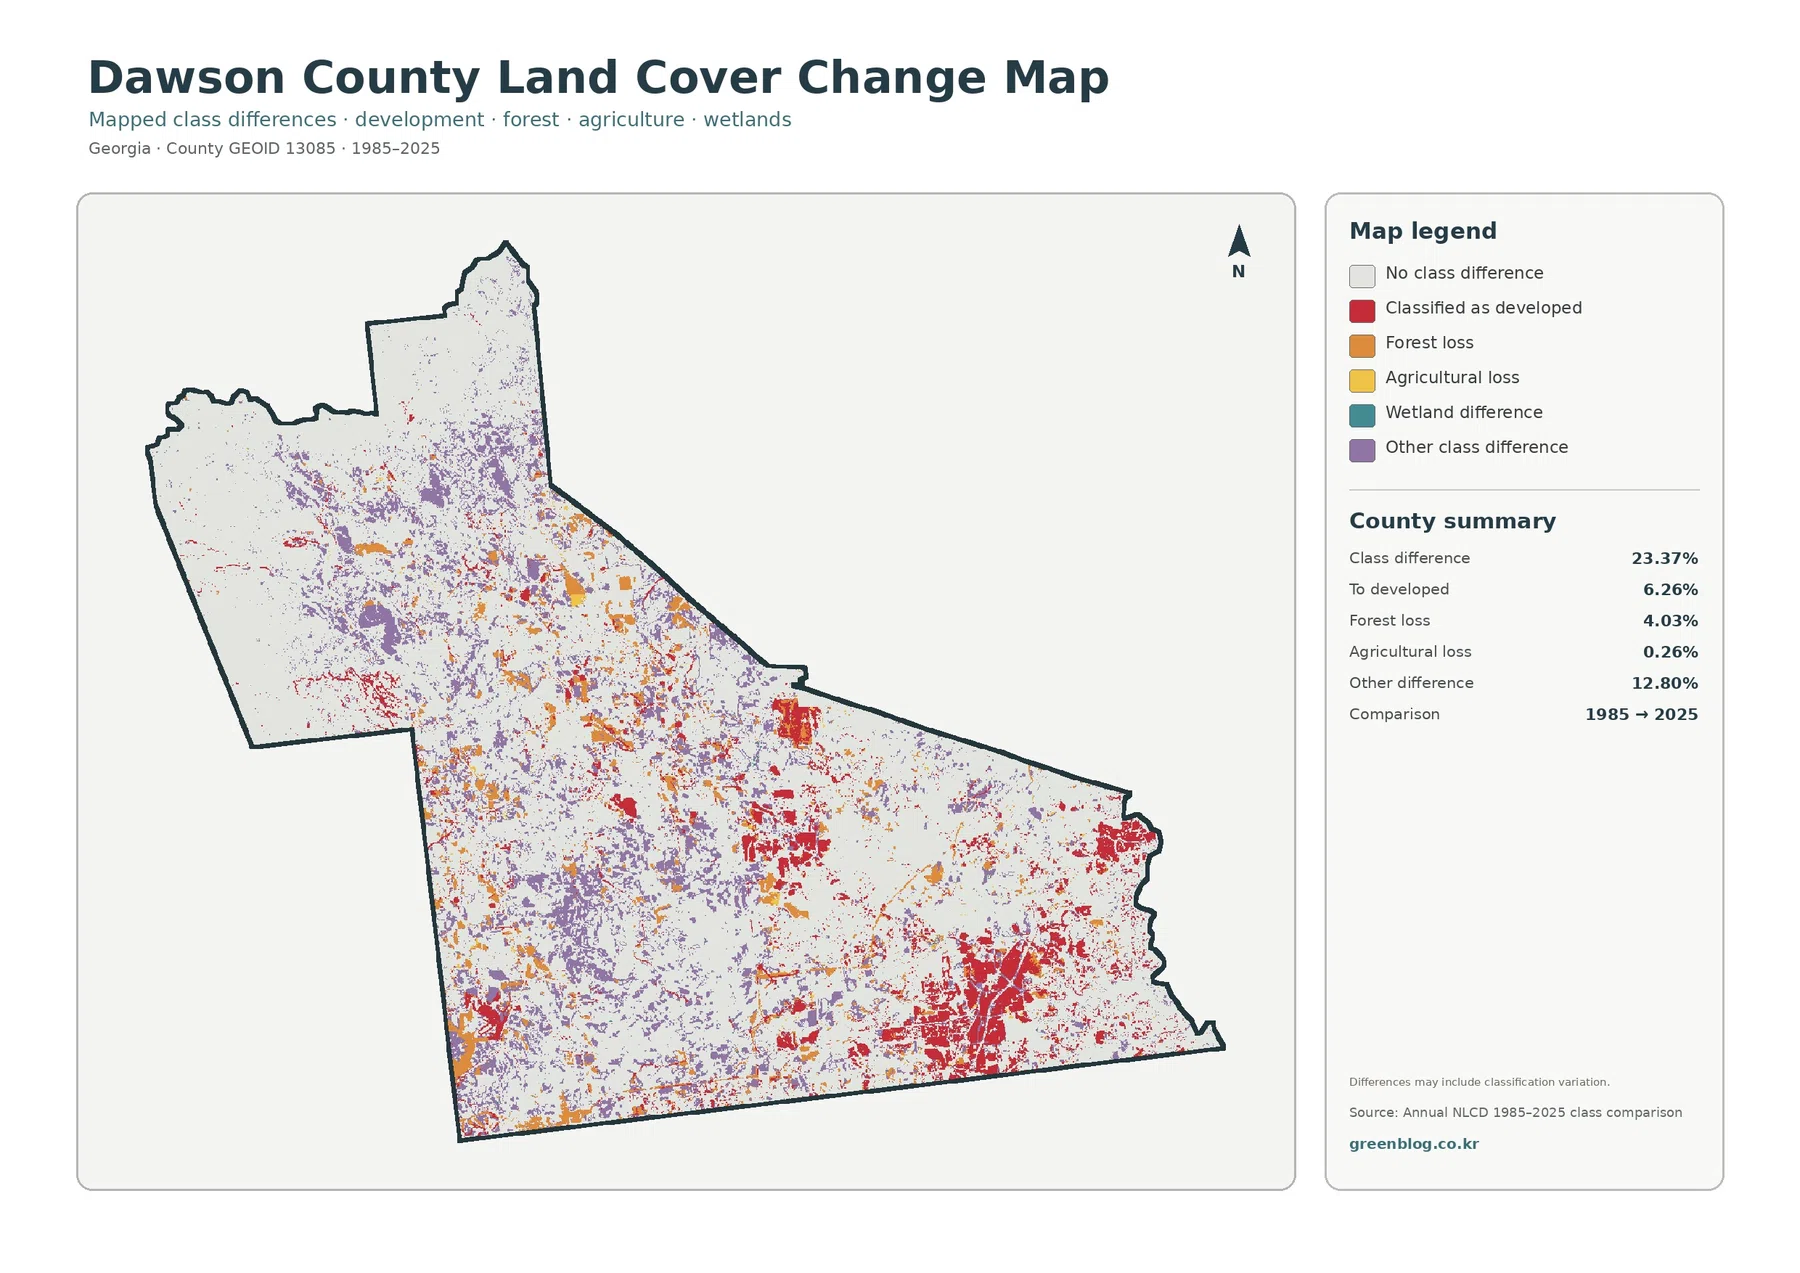
The change summary reports class differences across 23.37% of the county. Cells classified as developed at the 2025 endpoint account for 6.26%, forest loss for 4.03%, agricultural loss for 0.26%, and other class differences for 12.80%. The largest category is therefore not development but “other difference.” That fact is essential when interpreting the map, because the full 23.37% cannot be described as urban expansion or forest clearing.
Red developed-change cells are most concentrated in the southeast and appear in additional clusters near the county’s central developed areas. This broadly resembles the 2025 impervious surface pattern. Large western and northern areas contain more cells with no class difference, although orange forest-loss and purple other-difference cells are scattered through the interior. The long-term picture is therefore mixed: substantial forest remains, while selected corridors and settlement areas show more pronounced change.
Forest-loss cells can reflect more than permanent conversion to buildings. Timber activity, vegetation cycles, clearing, regrowth, image conditions, and classification differences may all affect the endpoint comparison. The map itself notes that differences may include classification variation. For the same reason, an orange patch should not automatically be labeled as development, and a purple patch should not be assigned a cause without intermediate-year imagery or local records.
The comparison also does not tell the exact year when a cell changed. It compares 1985 with 2025 rather than recording a continuous forty-year sequence. Its value is in screening: it separates places that received the same broad class at both endpoints from places that did not. For Dawson County, that makes it particularly useful for comparing the long-established forested west with the more dynamic GA 400 and Dawsonville areas.
Watersheds and mountain terrain add context to the forest pattern
Dawson County’s comprehensive plan describes a varied natural setting that includes expansive forest, the Etowah River watershed, mountain terrain, and sensitive river and wetland areas. Most of the county drains through the Etowah system. That context matters because forest on a ridge, forest along a river corridor, and small green remnants inside developed areas may look similar in the land-cover legend even though their geographic settings are different.
The plan also identifies mountain-protection areas at higher elevations and notes that many such locations occur within national forest lands. The supplied land-cover map does not contain elevation contours, so it cannot show those protected mountain criteria directly. Still, the broad northern and western forest pattern is consistent with a county where steep and mountainous terrain remains an important part of the landscape. Elevation questions should be answered with a dedicated terrain or elevation map rather than inferred from green color alone.
On the eastern side, the small portion draining toward Lake Lanier provides a different water context. Blue water cells and nearby development lie close together in parts of that edge. For watershed lessons, that makes the eastern side useful for discussing how forest, water, and developed surfaces can share a relatively small area. The map can show their proximity, but it cannot determine water quality, flood risk, shoreline jurisdiction, or required buffers.
Choosing the right map depends on the question
For a general county profile, start with the 2025 land-cover map. It shows the main fact immediately—forest dominates—while still revealing the southeast development concentration, interior agricultural patches, and eastern water. If the subject is forest and open land, the forest-and-farmland map removes some visual complexity and makes the contrast between broad woodland and scattered agricultural openings easier to explain.
Use the impervious surface map when the question is about pavement, rooftops, parking areas, or the intensity of built surfaces. It is the clearest way to show that the GA 400 area contains much stronger hard-surface concentrations than most of the county. Use the change map when the question shifts from present conditions to differences between 1985 and 2025. Pairing it with the current map helps prevent the mistake of treating every changed cell as development.
These combinations work well in teaching and presentations because each map answers a different part of the same county story. The current land-cover view establishes the overall mix. The forest-and-farmland view simplifies natural and agricultural cover. The impervious map focuses on hard surfaces. The change view adds a time comparison. Keeping the legends and observation years visible helps an audience understand why the colors and percentages differ from one image to the next.
All four original JPG files measure 2480 × 1754 pixels. They are useful for screen-based work and ordinary printed documents, but the package does not mark them as meeting a high-resolution A3 reference. Test any large-format print before final use. Enlarging the pixels does not add parcel detail, finer roads, or more accurate shorelines, so image size should not be confused with geographic precision.
What the classification can and cannot tell you
Land cover describes what appears to cover the ground, not what a property is legally allowed to be used for. A forest-classified cell is not automatically protected land, and a developed cell is not automatically commercial or residential zoning. Ownership, parcel lines, zoning, permits, and conservation restrictions come from separate records. Dawson County’s GIS resources are the better starting point when those legal or property-specific questions matter.
Annual NLCD uses 30-meter raster cells, meaning the county is represented by a grid of square units. One cell can contain trees, a driveway, lawn, a small building, and part of a stream, yet the final product must summarize that mixed ground. This generalization is appropriate for countywide comparison but cannot be reversed by zooming. A larger view of the same pixels is still the same underlying information.
The observation year matters as well. The current maps represent the supplied 2025 classification. Construction, logging, vegetation recovery, road work, or water-level changes after that observation may not appear. When a current site condition is important, use newer aerial imagery and local records. When historical timing is important, examine intermediate years instead of relying only on the 1985 and 2025 endpoints.
Frequently Asked Questions
Why does Dawson County look so forested if development is obvious in the southeast?
Forest covers 74.73% of the county, while developed land covers 12.66%. The developed share is concentrated rather than evenly distributed. Large western and northern forest areas dominate the total, while GA 400, SR 53, Dawsonville, and nearby settlement areas create much stronger developed clusters in the southeast and south-central portions.
Why is mean impervious cover only 2.55% when developed cover is 12.66%?
Developed classes can include permeable ground such as lawns, trees, and open soil around buildings and streets. Impervious cover isolates harder surfaces such as pavement, rooftops, and parking areas. It therefore measures a narrower part of the developed landscape and produces a lower countywide value.
Does the 23.37% class-difference figure mean almost one quarter of the county was developed after 1985?
No. Only 6.26% is mapped as changed to developed at the 2025 endpoint. Forest loss is 4.03%, agricultural loss 0.26%, and other class differences 12.80%. The comparison can also include classification variation, so a specific cause or year requires intermediate imagery and local records.
Sources and Reference Data
- MRLC Annual NLCD Data – official access point for annual land-cover and comparison products
- USGS Annual NLCD Land Cover Classification – definitions and guidance for forest, agriculture, developed land, wetlands, and related classes
- U.S. Census Bureau TIGER/Line Shapefiles – official geographic boundary reference for Dawson County
- Dawson County GIS – official county mapping resources including Georgia 400 corridor, road, zoning, and topographic maps
- Dawson County Comprehensive Plan – official planning context for the Etowah watershed, GA 400 development corridors, mountain areas, and natural-resource planning
Map File Information
The ZIP contains the four original Dawson County JPG maps for 2025 land cover, forest and farmland, impervious surface and developed land, and the 1985–2025 land-cover class comparison.
- Included Files: Use only the versions confirmed in the article and supplied images
- File Type: Use the confirmed download contents
- Intended Use: Printing, education, presentations, and map-based projects
Related Maps
- Appling County Georgia Land Cover Map
- Atkinson County Georgia Land Cover Map
- Bacon County Georgia Land Cover Map
Green Map creates custom-edited map images using open geographic data sources such as geoBoundaries, Natural Earth, OpenStreetMap, and government open data.
These maps are edited visual materials, not raw data files, and are provided for education, documents, presentations, and graphic reference.