Agriculture is the largest mapped cover in Coffee County, but the county does not read as one continuous block of farmland. The 2025 view is a patchwork of fields, wetlands, forest, and smaller developed areas, with the strongest built concentration around Douglas. This Coffee County Georgia Land Cover Map set makes those contrasts easy to compare without treating land cover as zoning, ownership, or a parcel-level land-use map.
The page includes four WebP previews: 2025 land cover, forest and farmland, impervious surface and developed land, and a 1985–2025 class-difference map. The four original JPG maps are also available together in one download. Each JPG measures 2480 × 1754 pixels, which is useful for reports, classroom materials, presentations, and county comparisons, although the package does not identify the files as meeting an A3 high-resolution standard.
Table of Contents
A farm-leading county where wetlands and woods remain part of the same landscape
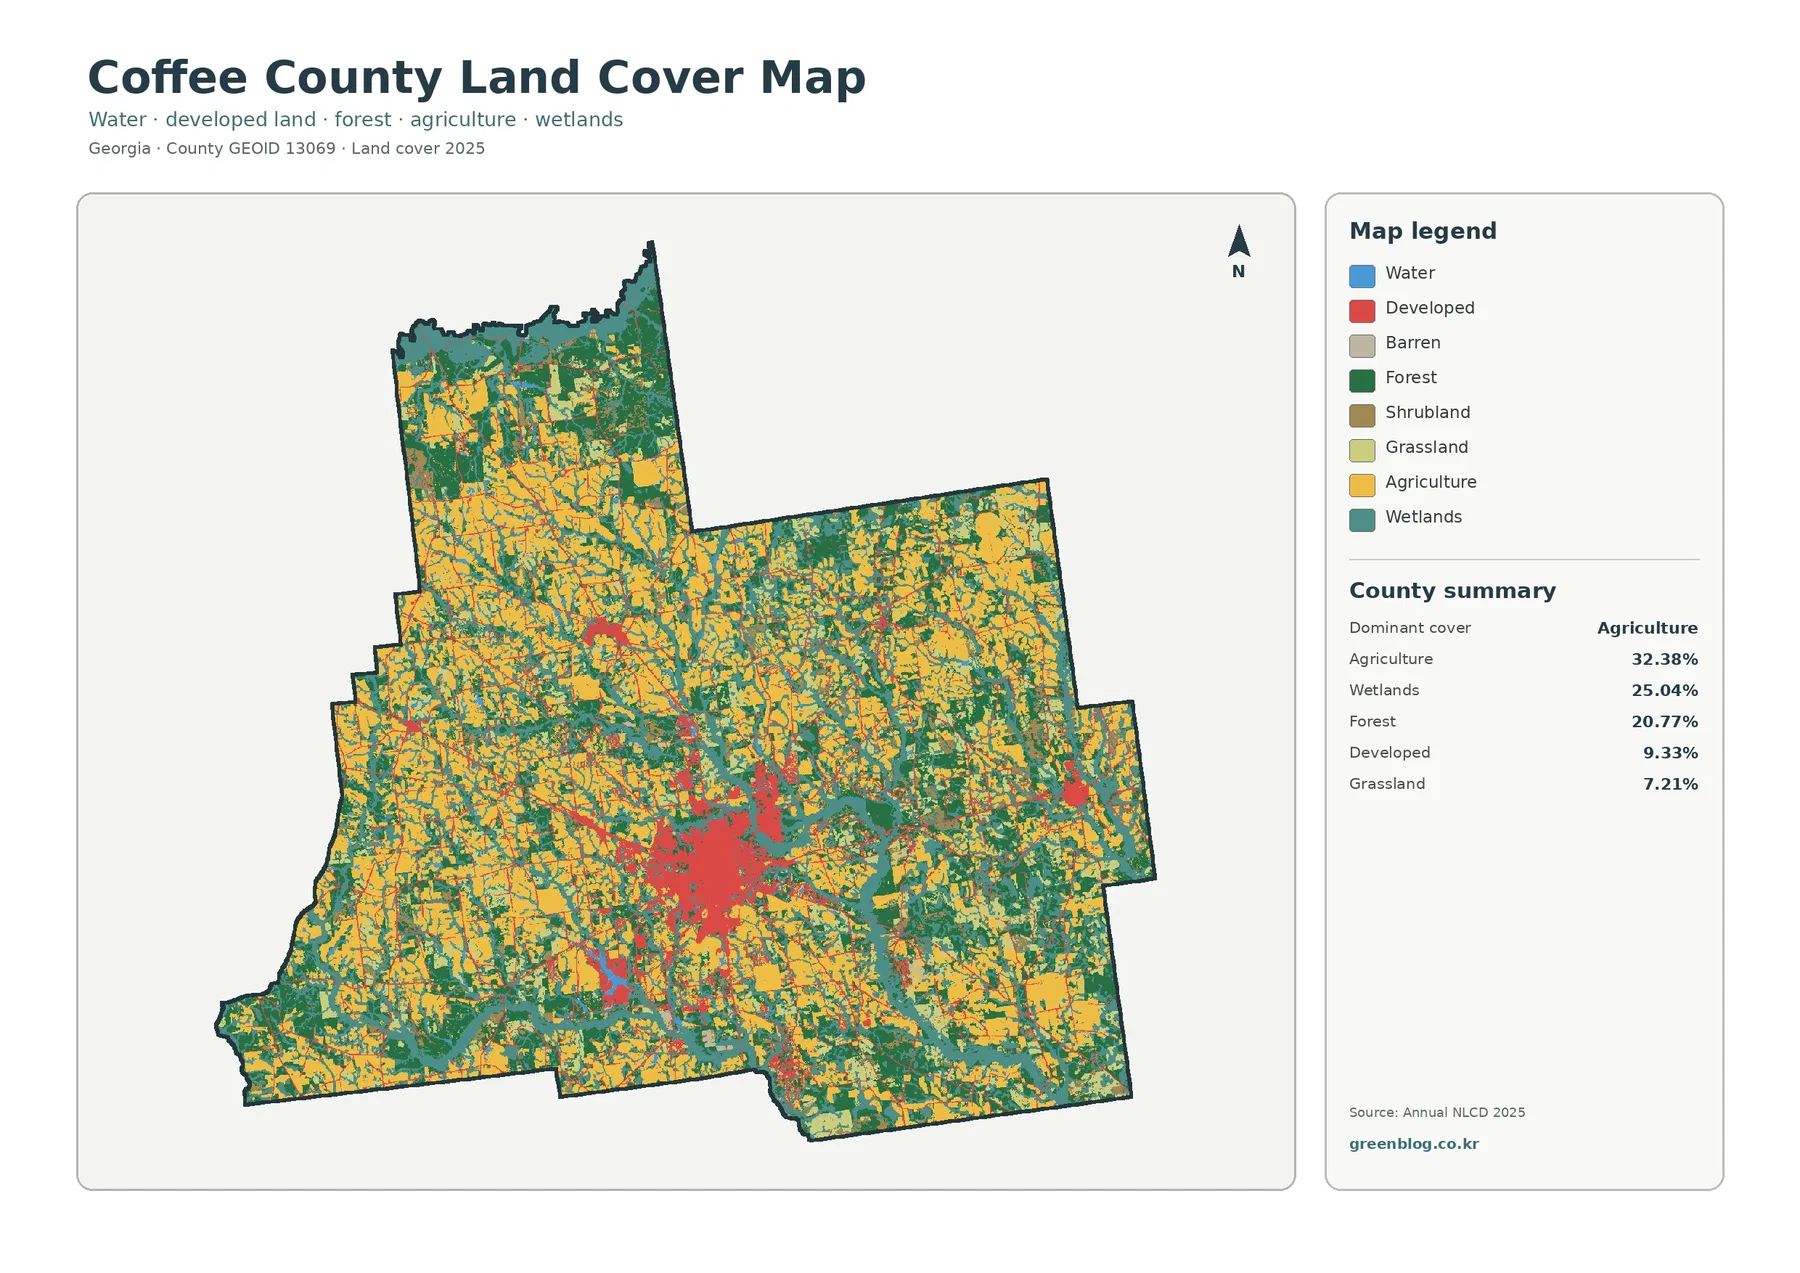
Agriculture accounts for 32.38% of the 2025 summary, the largest single class. Wetlands follow at 25.04%, while forest covers 20.77%. Developed land is 9.33%, grassland 7.21%, shrubland 3.79%, and open water 1.27%. Those percentages matter, but the spatial pattern matters just as much: yellow agricultural cells are spread through most parts of the county and repeatedly meet teal wetland corridors and dark-green forest patches instead of forming one unbroken farming zone.
The most obvious developed cluster lies near the county center around Douglas. From that core, thinner developed traces extend outward along transportation routes, while smaller built pockets appear elsewhere. The outer portions of the county quickly return to a mixture of fields, woods, and wet ground. The result is a county with one strong urban center inside a much broader rural matrix rather than a landscape dominated by continuous suburban development.
Wetlands are not confined to one corner. They appear as broad patches and narrow branching bands that cross or border agricultural and forest areas. In several places, farmland stops abruptly at wetland edges, while in others forest separates the two. That repeated contact is one reason the map is more informative than the countywide percentages alone. A 25.04% wetland share can mean very different things depending on whether the wet ground forms one large tract or many connected corridors; Coffee County shows much of the latter pattern.
The forest-and-farmland view brings the working landscape into focus
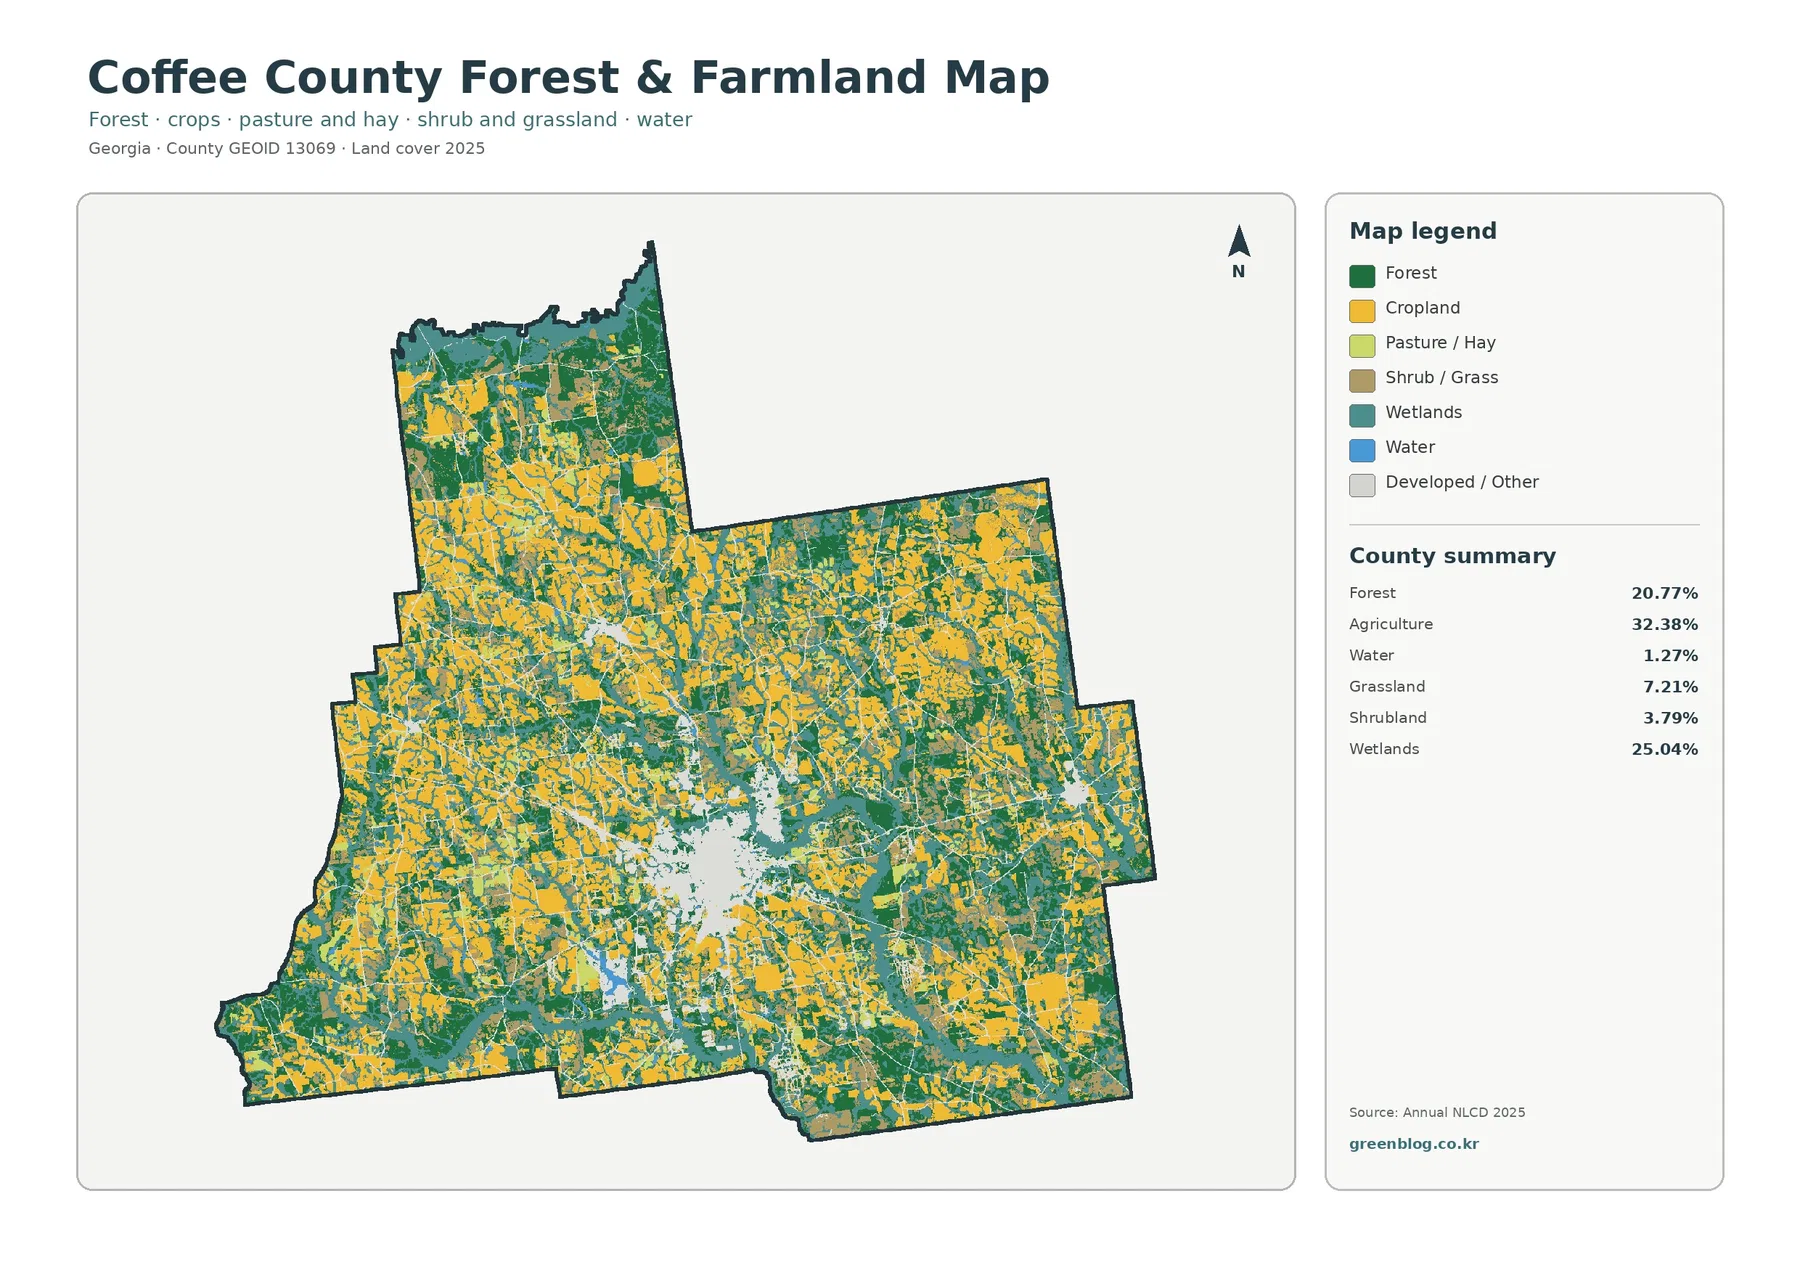
Removing most of the developed-color detail makes the working-land pattern easier to follow. Agricultural blocks occur across the north, center, east, and south, while forest and wetlands break them into irregular shapes. The map therefore works well for showing how farming shares space with natural cover. It does not identify crop ownership or field boundaries, but it clearly shows that agriculture is spread through the county rather than isolated to a single district.
Local agricultural information supports that broader interpretation. UGA Cooperative Extension reports that Coffee County has more than 33,500 irrigated acres of cotton, peanuts, and corn. That acreage is not the same measurement as the 32.38% Annual NLCD agriculture class, and it should not be converted directly into the mapped percentage. It does, however, confirm that irrigated row-crop production is a substantial part of the county’s real-world landscape. The Extension office also describes work on irrigation efficiency and soil-moisture monitoring, which is especially relevant in a county where agricultural land and wet areas are both prominent.
Forest makes up 20.77% of the summary and appears both in larger tracts and in narrower pieces between fields and wetlands. Those green areas should not be read as timber ownership, conservation status, or a guarantee that every tree-covered cell is mature forest. Annual NLCD assigns one predominant class to each raster cell. A cell can contain tree edges, a ditch, a road, and part of a field while still being represented by one dominant class, so the map is best used for county-scale pattern recognition rather than site inspection.
A small impervious share makes the Douglas core stand out sharply
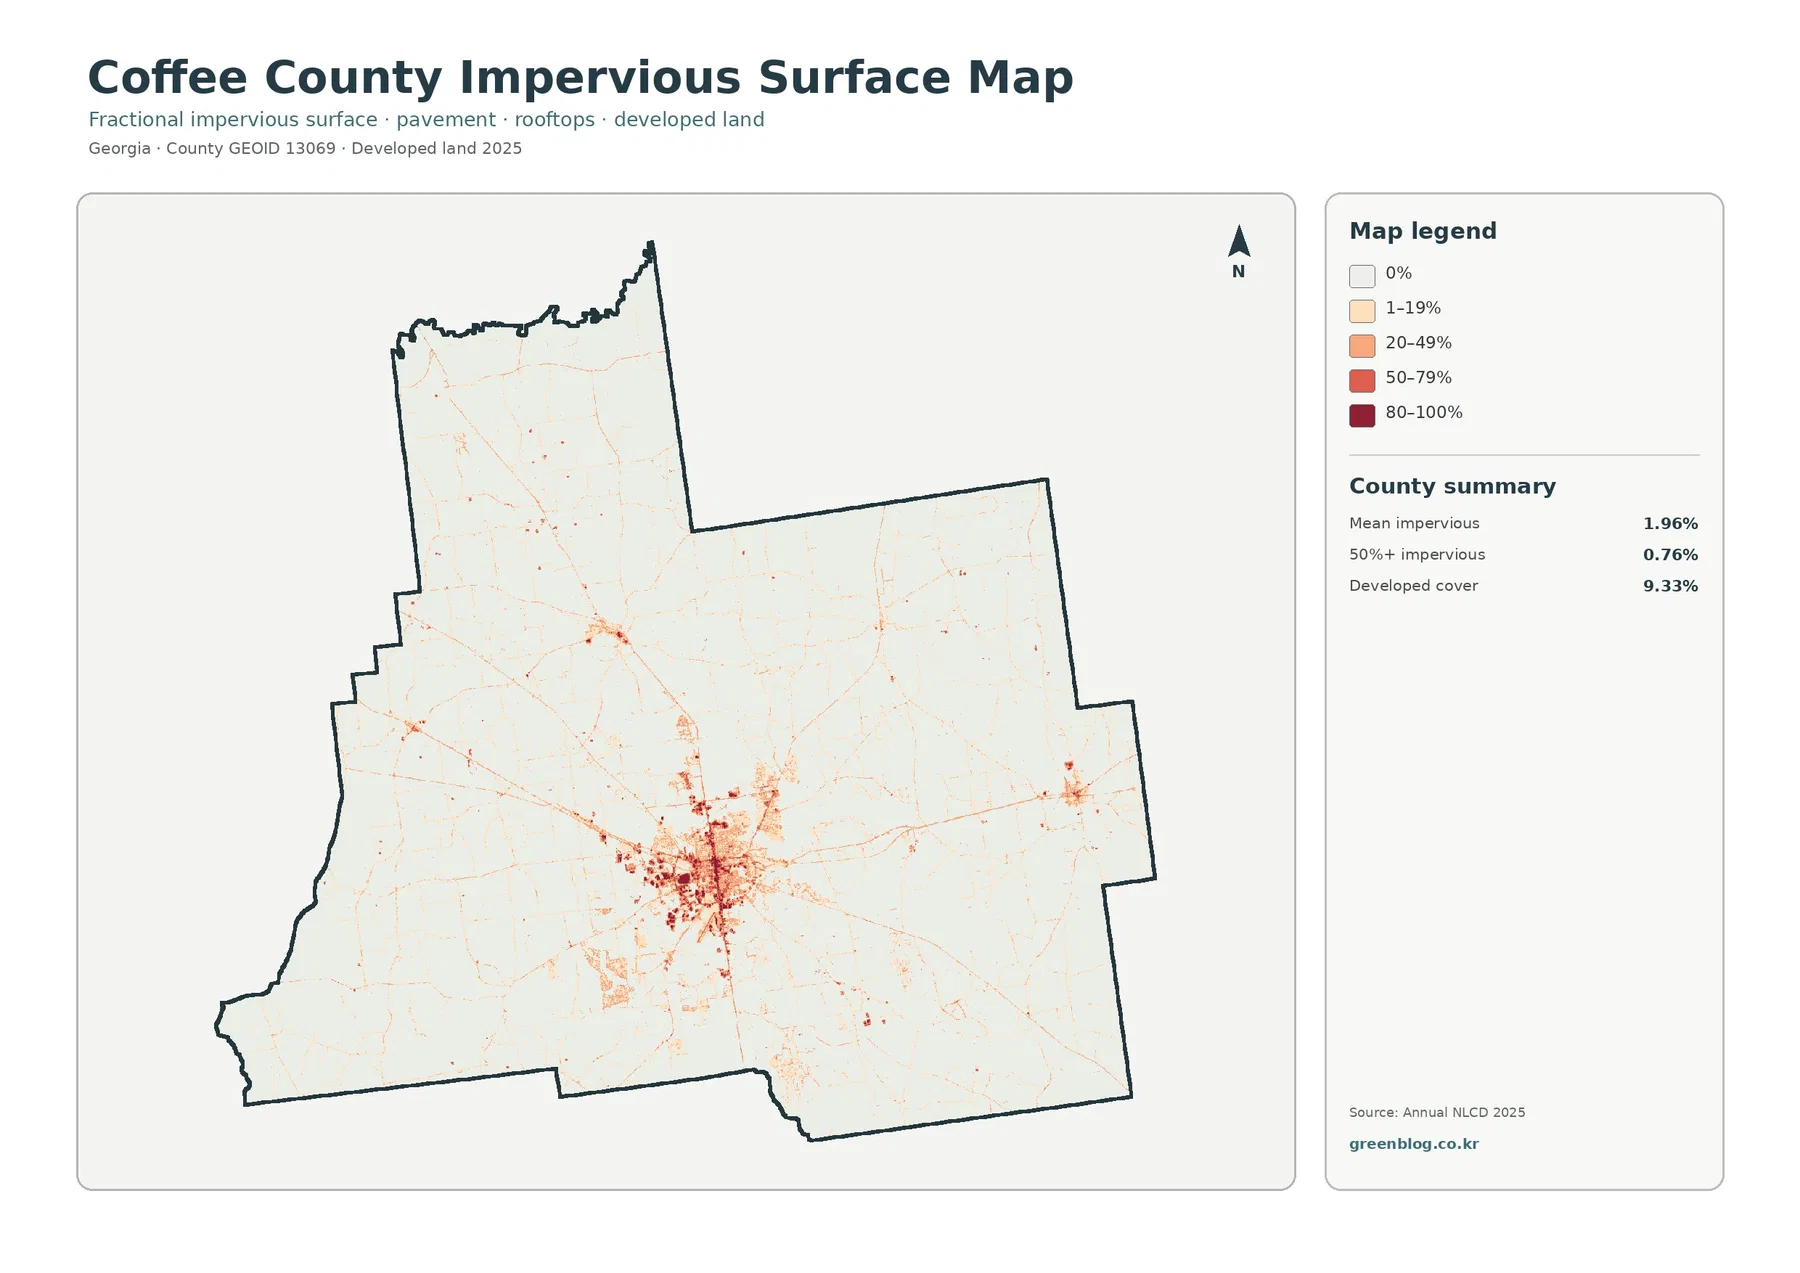
The impervious map changes the visual emphasis completely. Most of Coffee County is pale because mean impervious cover is only 1.96%. Areas where impervious surface reaches 50% or more account for 0.76% of the county, even though the broader developed class covers 9.33%. The dark reds are concentrated around Douglas, with thin lines and smaller spots extending into the surrounding rural area.
This difference between 9.33% developed cover and 1.96% mean imperviousness is important. Developed land can include lawns, scattered trees, exposed soil, and other permeable surfaces around houses, businesses, and roads. Impervious cover isolates roofs, pavement, parking lots, and similar hard surfaces that shed water more directly. As a result, the two measurements answer different questions and should not be presented as competing estimates of the same thing.
The Georgia Department of Community Affairs maintains a joint comprehensive-plan record for Coffee County and the cities of Ambrose, Broxton, Douglas, and Nicholls. That local-government context helps explain why the map should not be reduced to the Douglas core alone. Smaller communities and rural settlement patterns exist elsewhere, but the impervious map is too generalized to supply exact municipal boundaries or road names. If a project needs those details, it should be paired with current administrative and transportation maps.
The 1985–2025 comparison shows widespread class differences, not one simple trend
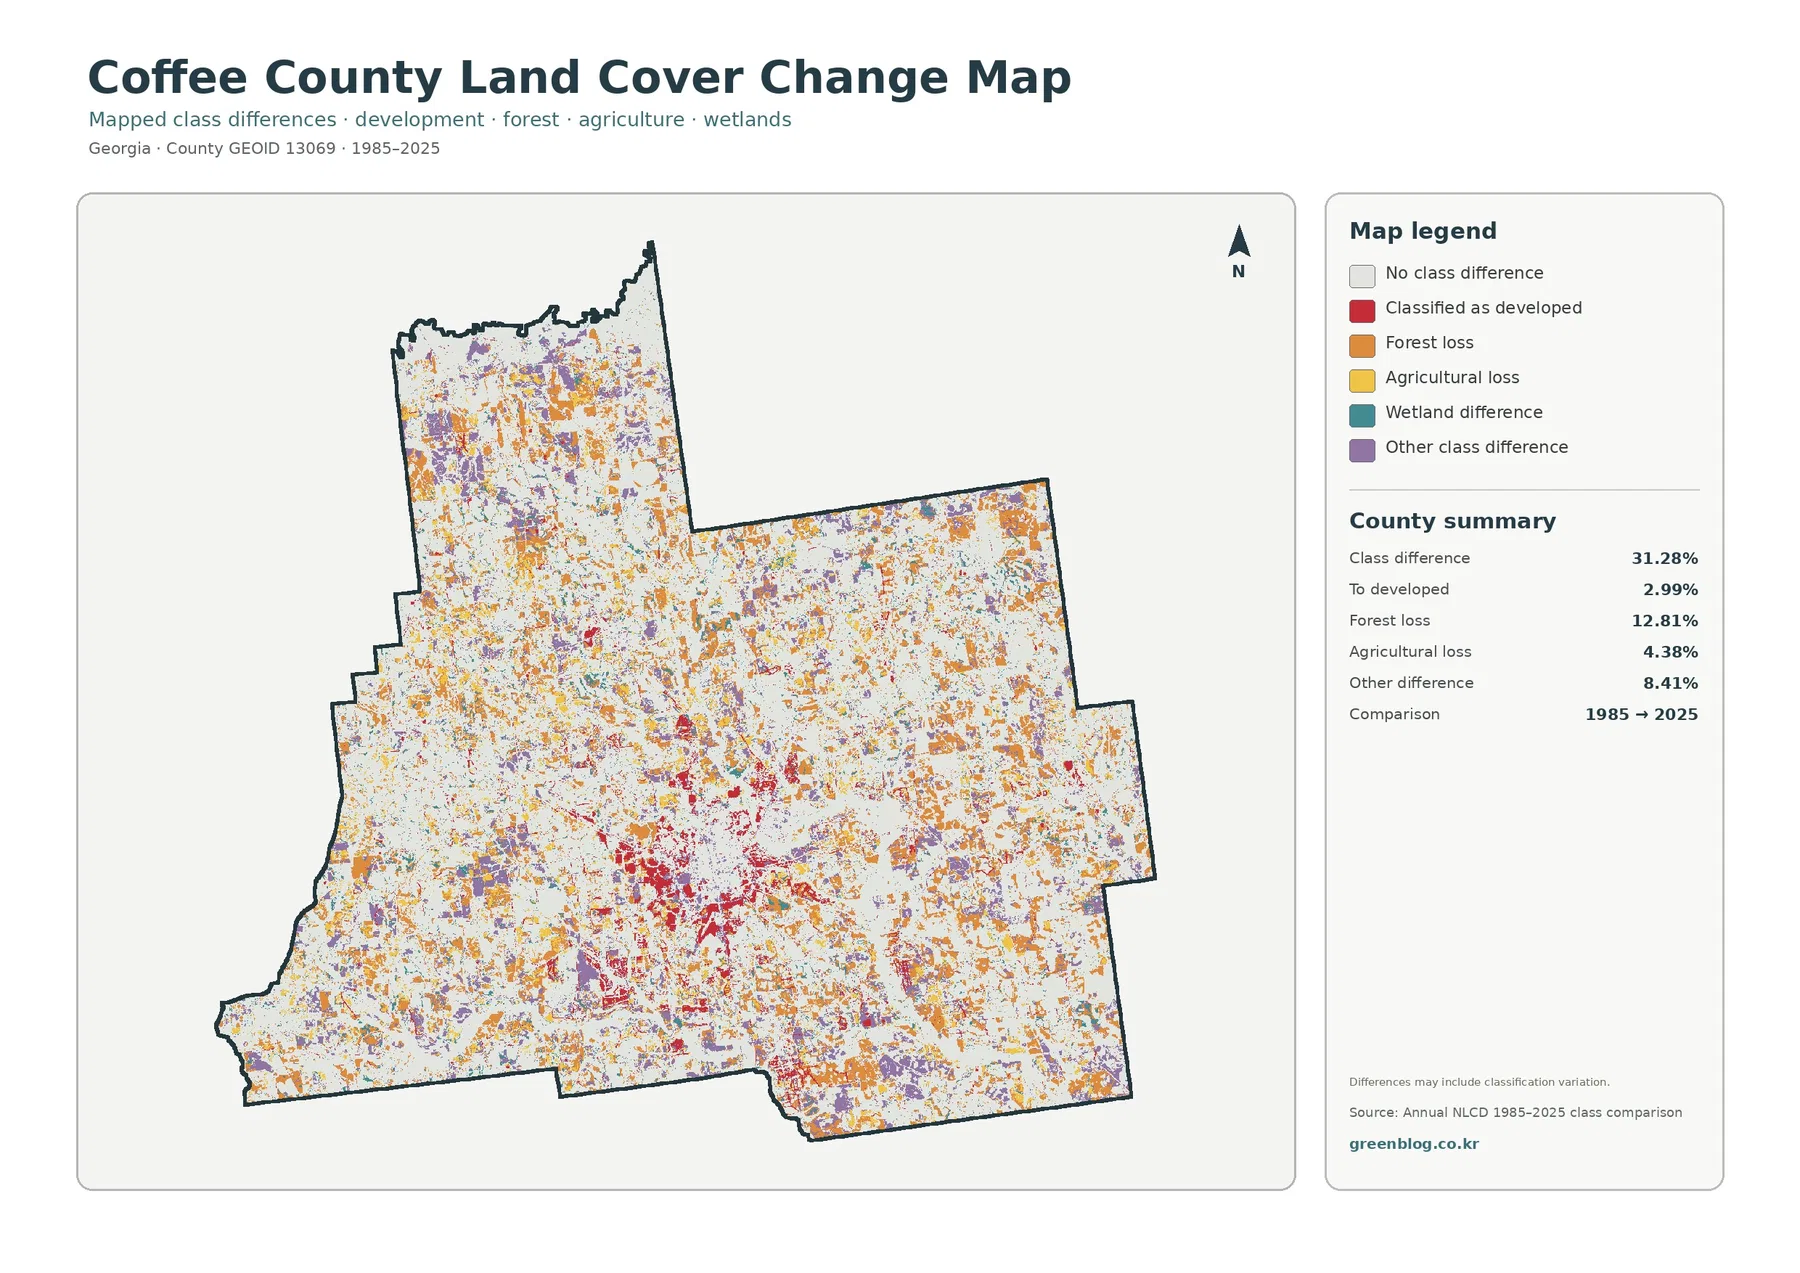
The class-difference summary reports that 31.28% of cells received a different class in 2025 than in 1985. Of the mapped categories, 12.81% is labeled forest loss, 4.38% agricultural loss, 2.99% classified as developed, and 8.41% other class difference. The colored cells are scattered widely rather than confined to the Douglas area. Development-related change is visible near the main built core, but it is not the largest component of the countywide difference.
That distinction prevents a common misreading. The 31.28% total does not mean that nearly one-third of Coffee County was urbanized, damaged, or permanently cleared. It means that the two endpoint classifications do not match for those cells. Real changes such as clearing, regrowth, field conversion, or shifts in wetness may be included, but classification variation can also contribute. The map itself warns that differences may include classification variation.
Forest loss needs similar care. A cell counted in that category was forest in the 1985 endpoint and another class in the 2025 endpoint. The map does not show whether the change happened in 1990, 2010, or just before 2025, nor does it show every intermediate cycle of harvesting and regrowth. Determining cause and timing requires annual data, aerial imagery, local records, or field evidence. Used with that limitation in mind, the change map is a useful screening layer for deciding where a closer historical review may be worthwhile.
How to choose the right Coffee County map for a report or lesson
For a general county profile, begin with the 2025 land-cover map because it combines all major classes in one image. It quickly establishes the central fact that agriculture leads the county while wetlands and forest remain extensive. If the discussion turns to working land, irrigation, habitat edges, or the relationship between fields and wet ground, the forest-and-farmland version is clearer because it reduces the distraction from developed classes.
The impervious map is the better choice for discussions of urban surface intensity, drainage, or the contrast between Douglas and the surrounding rural area. It avoids the mistake of treating every developed cell as fully paved. The change map is useful when the subject is historical comparison, but its categories should be described as endpoint class differences unless additional evidence establishes a cause. Putting all four maps in sequence can be effective: overall cover first, rural-cover detail second, hard surfaces third, and historical differences last.
Scale remains a limitation for every view. Annual NLCD is based on 30-meter cells, so a small parcel can contain several surface types even though only one predominant class is displayed. Zooming in enlarges the cell but does not create missing parcel lines, ownership records, zoning, or field-level crop identification. The 2025 maps also represent the supplied observation year; later construction, harvest, timber activity, vegetation recovery, or changes in standing water may not appear.
The original JPGs are 2480 × 1754 pixels. They are convenient for on-screen use and ordinary documents, but the asset manifest does not mark them as meeting an A3 high-resolution reference. For a large poster or detailed print, test the output at the intended size before relying on small labels or fine cell patterns. For legal, engineering, parcel, wetland-jurisdiction, or permitting decisions, use the appropriate current official datasets rather than these reference graphics alone.
Files included in the Coffee County JPG set
The ZIP includes one original JPG for 2025 land cover, one for forest and farmland, one for impervious surface and developed land, and one for the 1985–2025 land-cover comparison. Keeping the four files together makes it easier to move from a broad county overview to a focused question without mixing images from different counties or observation years.
Frequently Asked Questions
What is the largest mapped land-cover class in Coffee County?
Agriculture is the largest 2025 class at 32.38%. Wetlands are next at 25.04%, followed by forest at 20.77%. The map is best described as a farm-leading mosaic because fields repeatedly meet wetlands and forest across the county.
Why is developed cover 9.33% when mean impervious cover is only 1.96%?
Developed classes can include permeable surfaces such as lawns, trees, and exposed soil around buildings and roads. Impervious cover isolates roofs, pavement, parking areas, and similar hard surfaces, so the countywide mean is much lower.
Does the 31.28% class difference mean that much of the county was damaged?
No. It is the share of cells that received different classes at the 1985 and 2025 endpoints. Real land-cover change can be part of that total, but classification variation may also contribute, and the map does not identify the exact date or cause of each difference.
Sources and Reference Data
- MRLC Annual NLCD Data – official access point for annual land-cover and comparison products
- USGS Annual NLCD Land Cover Classification – definitions and guidance for agriculture, forest, wetlands, developed land, and related classes
- U.S. Census Bureau TIGER/Line Shapefiles – official county-boundary reference for Coffee County
- Georgia DCA – Coffee County Comprehensive Plan – planning records for Coffee County and Ambrose, Broxton, Douglas, and Nicholls
- UGA Cooperative Extension – Coffee County Our Impact – local information on irrigated agriculture and water-management programs
Map File Information
The ZIP contains four original JPG maps for comparing Coffee County agriculture, wetlands, forest, Douglas-area hard surfaces, and 1985–2025 class differences.
- Included Files: Use only the versions confirmed in the article and supplied images
- File Type: Use the confirmed download contents
- Intended Use: Printing, education, presentations, and map-based projects
Related Maps
- Appling County Georgia Land Cover Map
- Atkinson County Georgia Land Cover Map
- Bacon County Georgia Land Cover Map
Green Map creates custom-edited map images using open geographic data sources such as geoBoundaries, Natural Earth, OpenStreetMap, and government open data.
These maps are edited visual materials, not raw data files, and are provided for education, documents, presentations, and graphic reference.