Calhoun County in southwest Georgia has a distinctly agricultural 2025 land-cover profile, but farming is only part of the visual story. Agriculture accounts for 42.17% of the mapped area, wetlands for 27.96%, and forest for 19.93%. Developed cover is just 5.00%, appearing as compact clusters rather than a broad urban field. The four maps on this page make those contrasts easier to separate by showing general land cover, forest and farmland, fractional impervious surface, and class differences between 1985 and 2025.
All four original JPG maps are available together in the download section below. The set is useful when you want to compare the county’s large farm blocks with wetland corridors, look more closely at the small built footprints around Arlington, Edison, Morgan, and Leary, or see where the 1985 and 2025 classifications differ. Each view answers a narrower question than the general map, so using the set together gives a clearer picture than relying on one layer alone.
Table of Contents
Agriculture leads the county summary, but wetlands occupy more than a quarter of the map
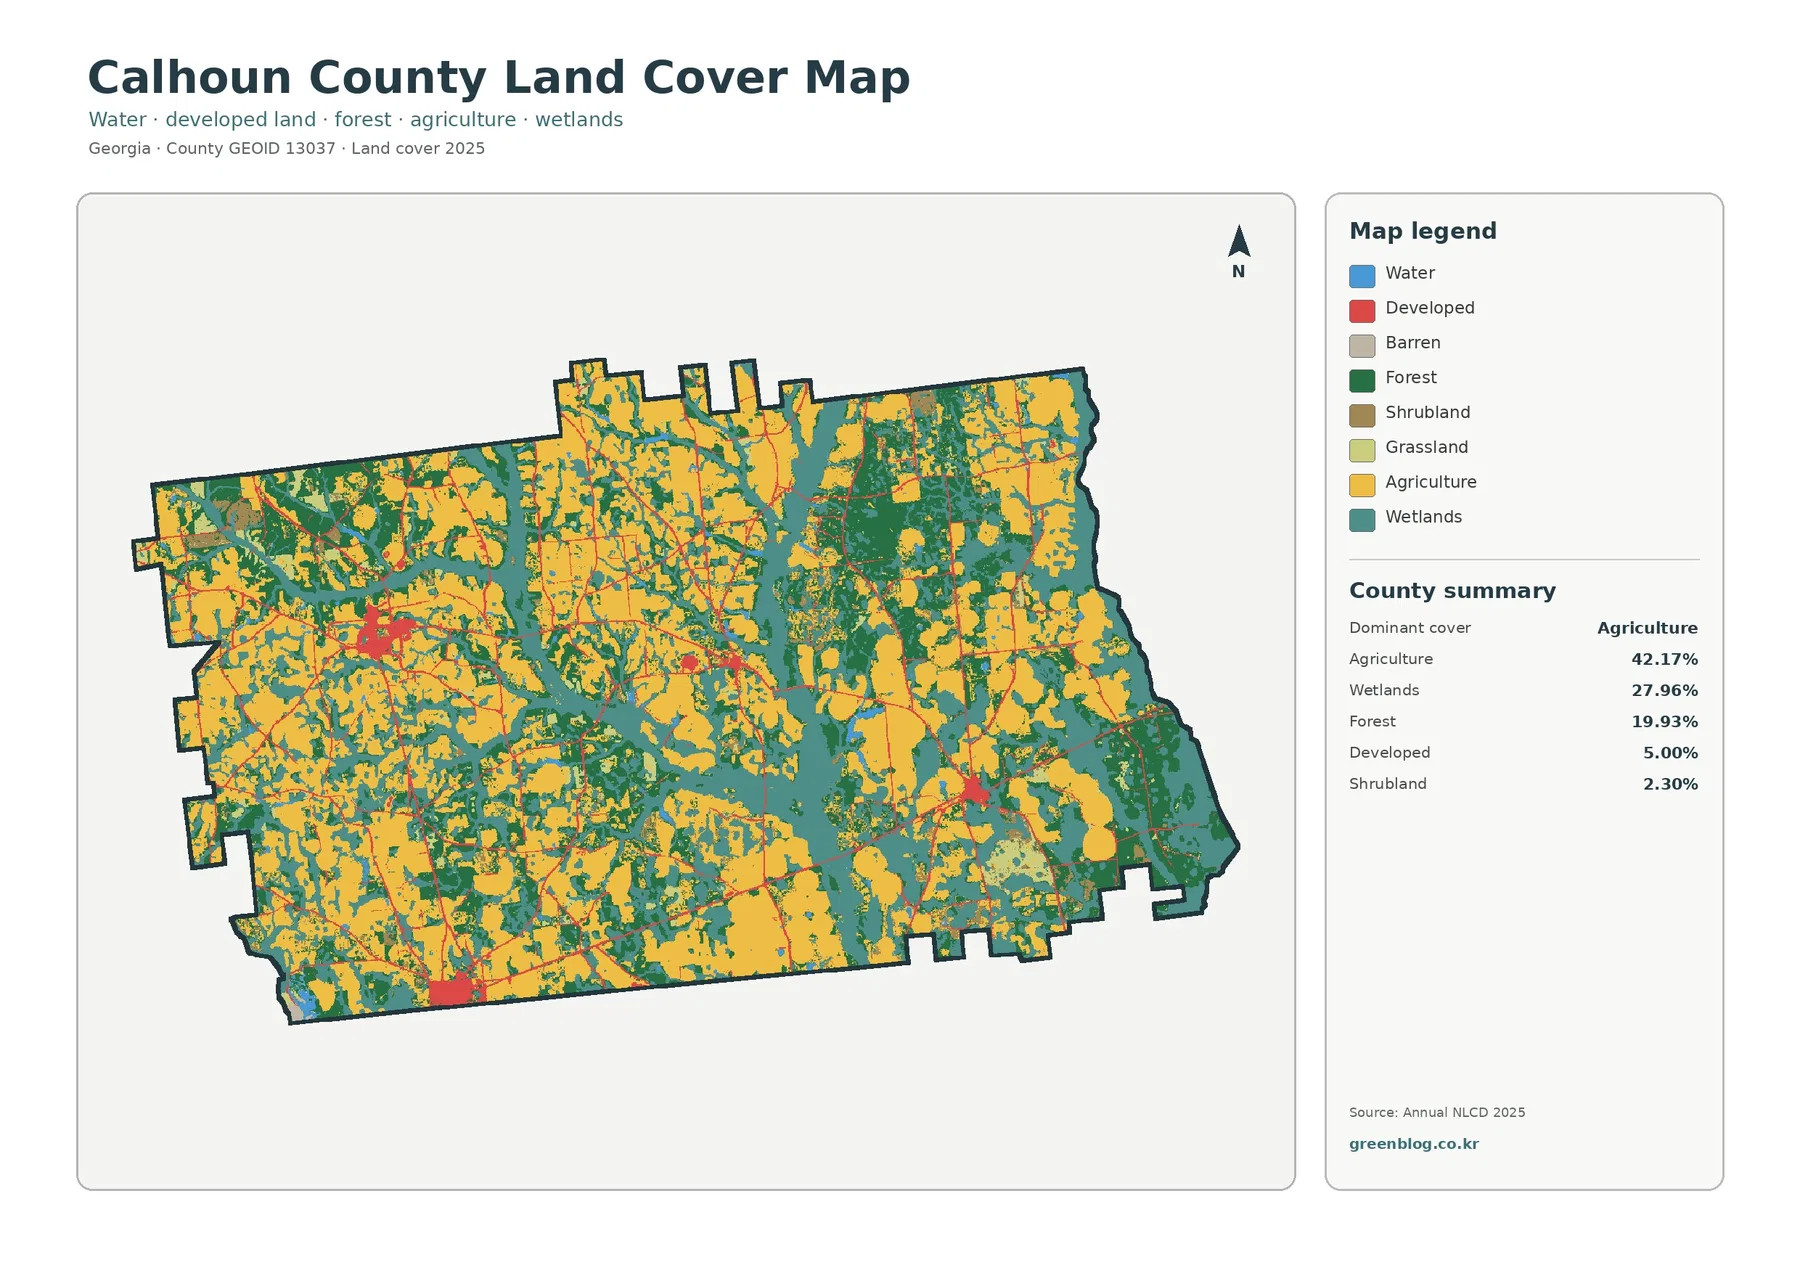
The 2025 county summary is unusual enough to deserve attention before looking at individual map panels. Agriculture is the dominant class at 42.17%, yet wetlands are a substantial second component at 27.96%. Forest adds another 19.93%. Those three categories account for most of the county, leaving developed cover at 5.00%, shrubland at 2.30%, grassland at 1.85%, water at 0.73%, and only a very small remainder in other mapped classes. In other words, Calhoun County is not simply farm country with a few wooded edges; wet ground and wetland vegetation are a major part of the mapped surface.
The general 2025 map shows a farm–wetland patchwork rather than one continuous farm belt
On the general land-cover map, yellow agricultural areas occupy broad blocks across the western, central, and northern portions of the county. They are repeatedly interrupted by teal wetlands and darker green forest. The eastern side has larger areas where forest and wetlands become more prominent, while the middle of the county contains a complicated mix of all three. Because the wetland class is so extensive, the map has a branching, interwoven appearance rather than the large uninterrupted yellow fields that might be expected from the 42.17% agriculture figure alone.
A simplified forest-and-farmland view makes the rural texture easier to compare
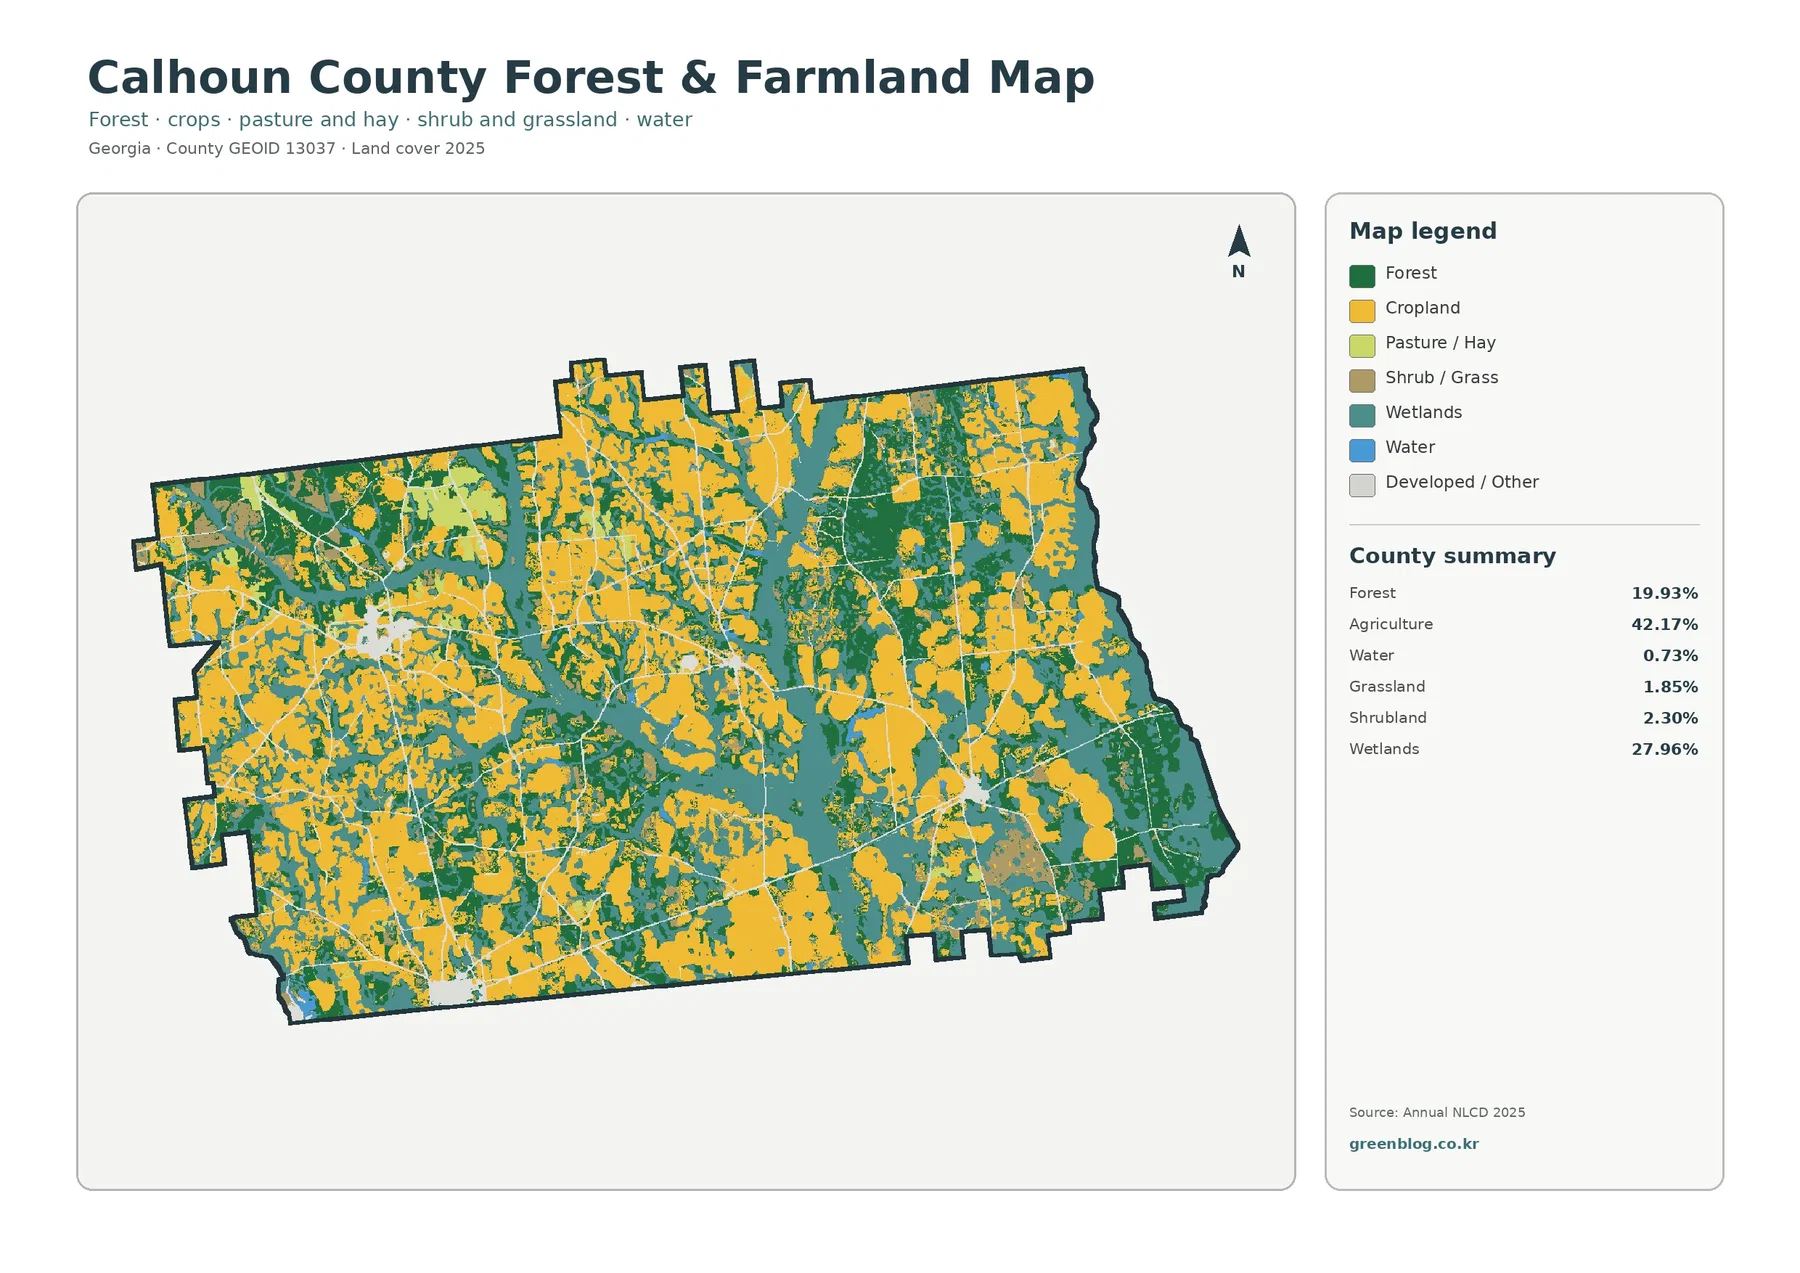
Broad agricultural blocks are common in the west and center, and sizeable farm areas also extend northward. Forest becomes more continuous in parts of the east, although it is not confined to that side of the county. Wetlands break up both categories, sometimes appearing as long narrow bands and elsewhere as larger irregular patches. For a classroom or presentation, this map is particularly effective because the contrast among farms, woods, and wet areas can be explained without the stronger red tones of developed land drawing attention away from the rural surface.
The built footprint is small, and impervious surfaces are concentrated in a few town-sized clusters
The impervious-surface map narrows the question from “where is land developed?” to “where are hard surfaces concentrated?” Impervious surfaces include roofs, pavement, parking areas, and other surfaces that limit direct infiltration of rainfall. Calhoun County’s mean imperviousness is only 0.80%, and land with 50% or greater imperviousness accounts for 0.15%. By comparison, developed land cover is 5.00%. The difference is expected because developed classes can include lawns, trees, bare soil, and other permeable surfaces mixed with buildings and pavement.
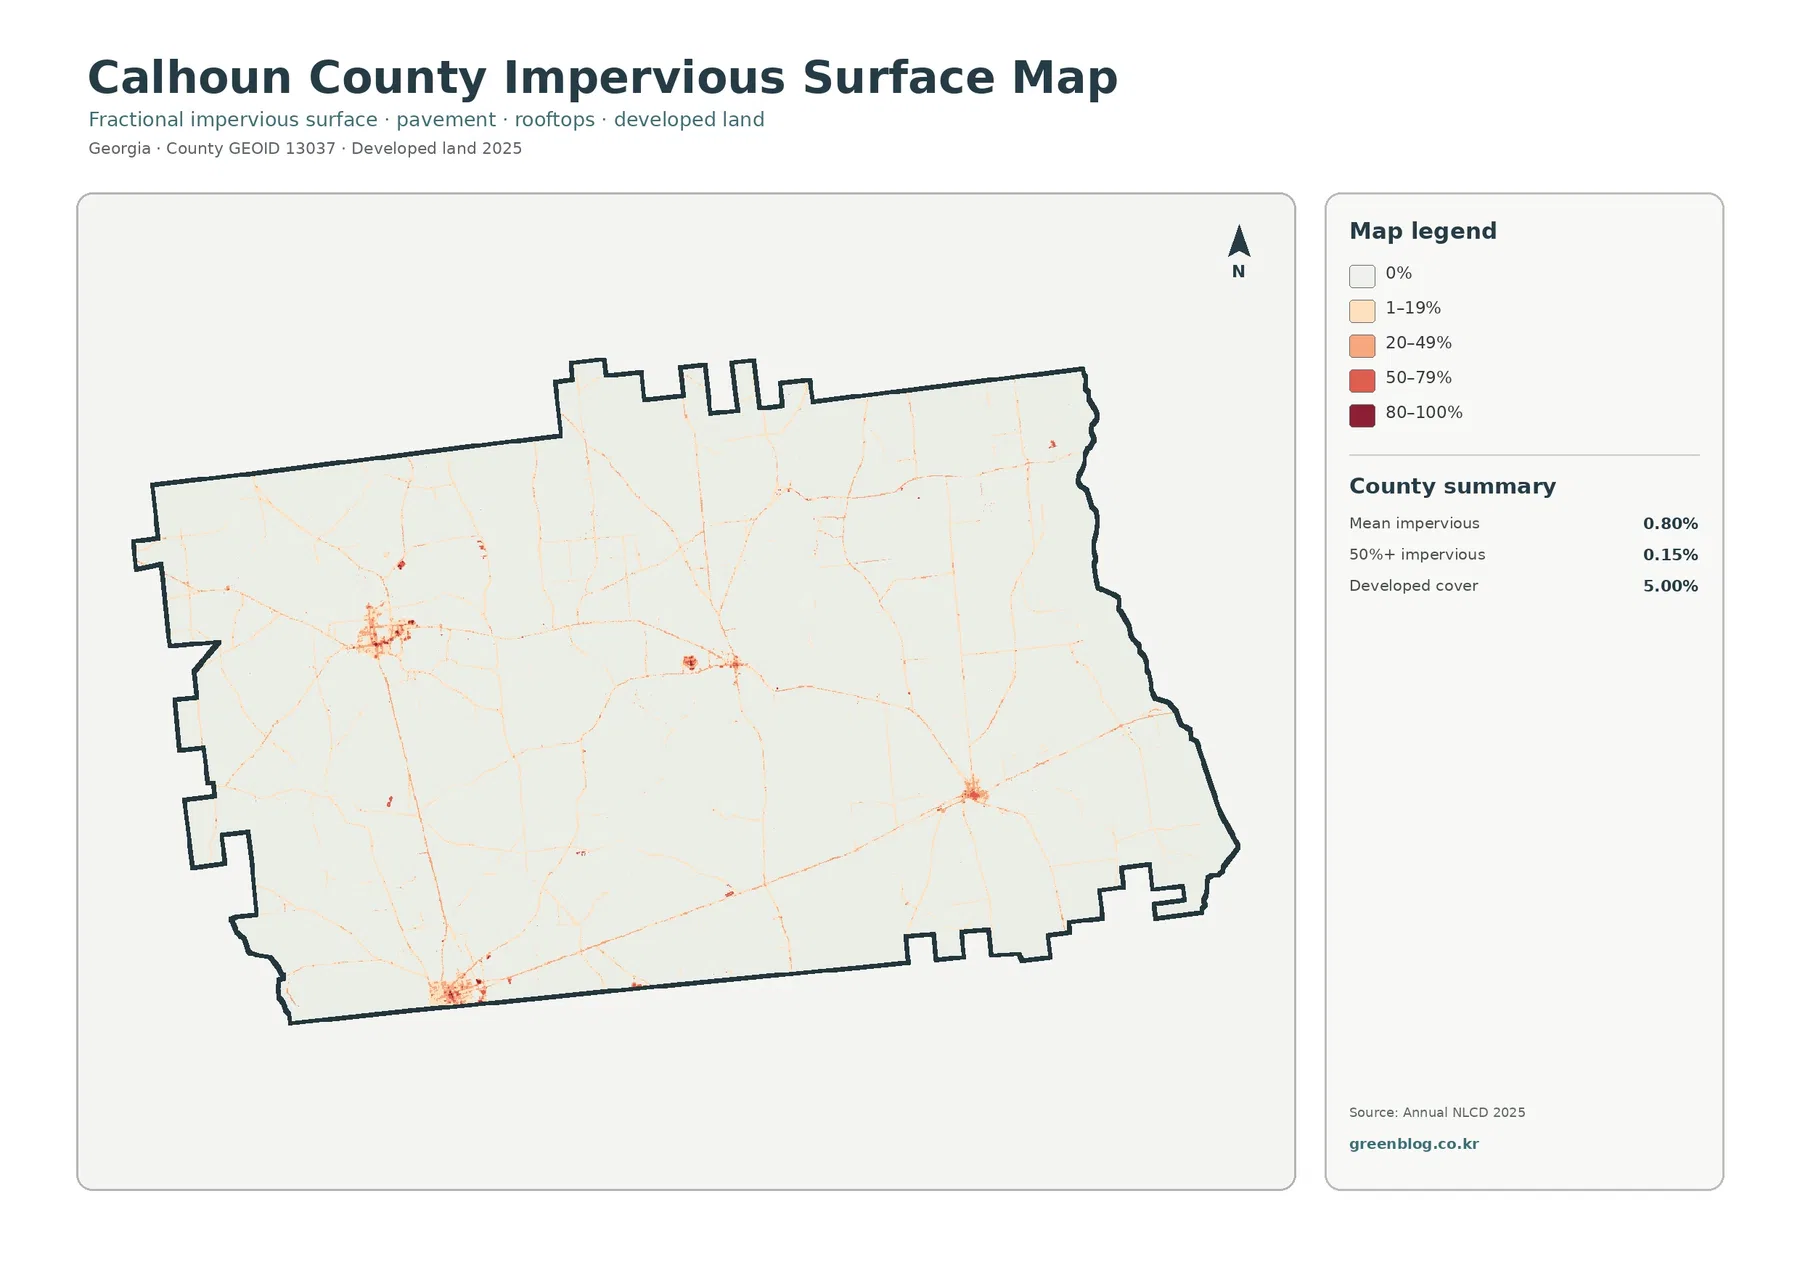
The darker impervious colors are not spread evenly across the county. They gather into several compact nodes, with faint linear traces connecting or extending away from them. When the map is compared with the 2020 Census reference map, these nodes broadly align with the county’s four incorporated cities: Arlington in the southwest, Edison to the west and northwest of Morgan, Morgan near the center, and Leary to the east and southeast. The land-cover product does not label streets, so individual lines should not be named as specific highways without a separate transportation layer.
The 1985–2025 comparison shows 16.25% class difference, with agricultural loss the largest listed category
The land-cover change map compares the classification at the same locations in 1985 and 2025. In Calhoun County, 16.25% of the area is summarized as a class difference. Agricultural loss is the largest listed component at 5.38%, followed by other difference at 4.75% and forest loss at 3.88%. Areas classified as developed in the comparison account for 0.80%. The legend also includes a wetland-difference category, but the summary panel does not give a separate percentage for it, so it should not be reverse-engineered into a claimed statistic.
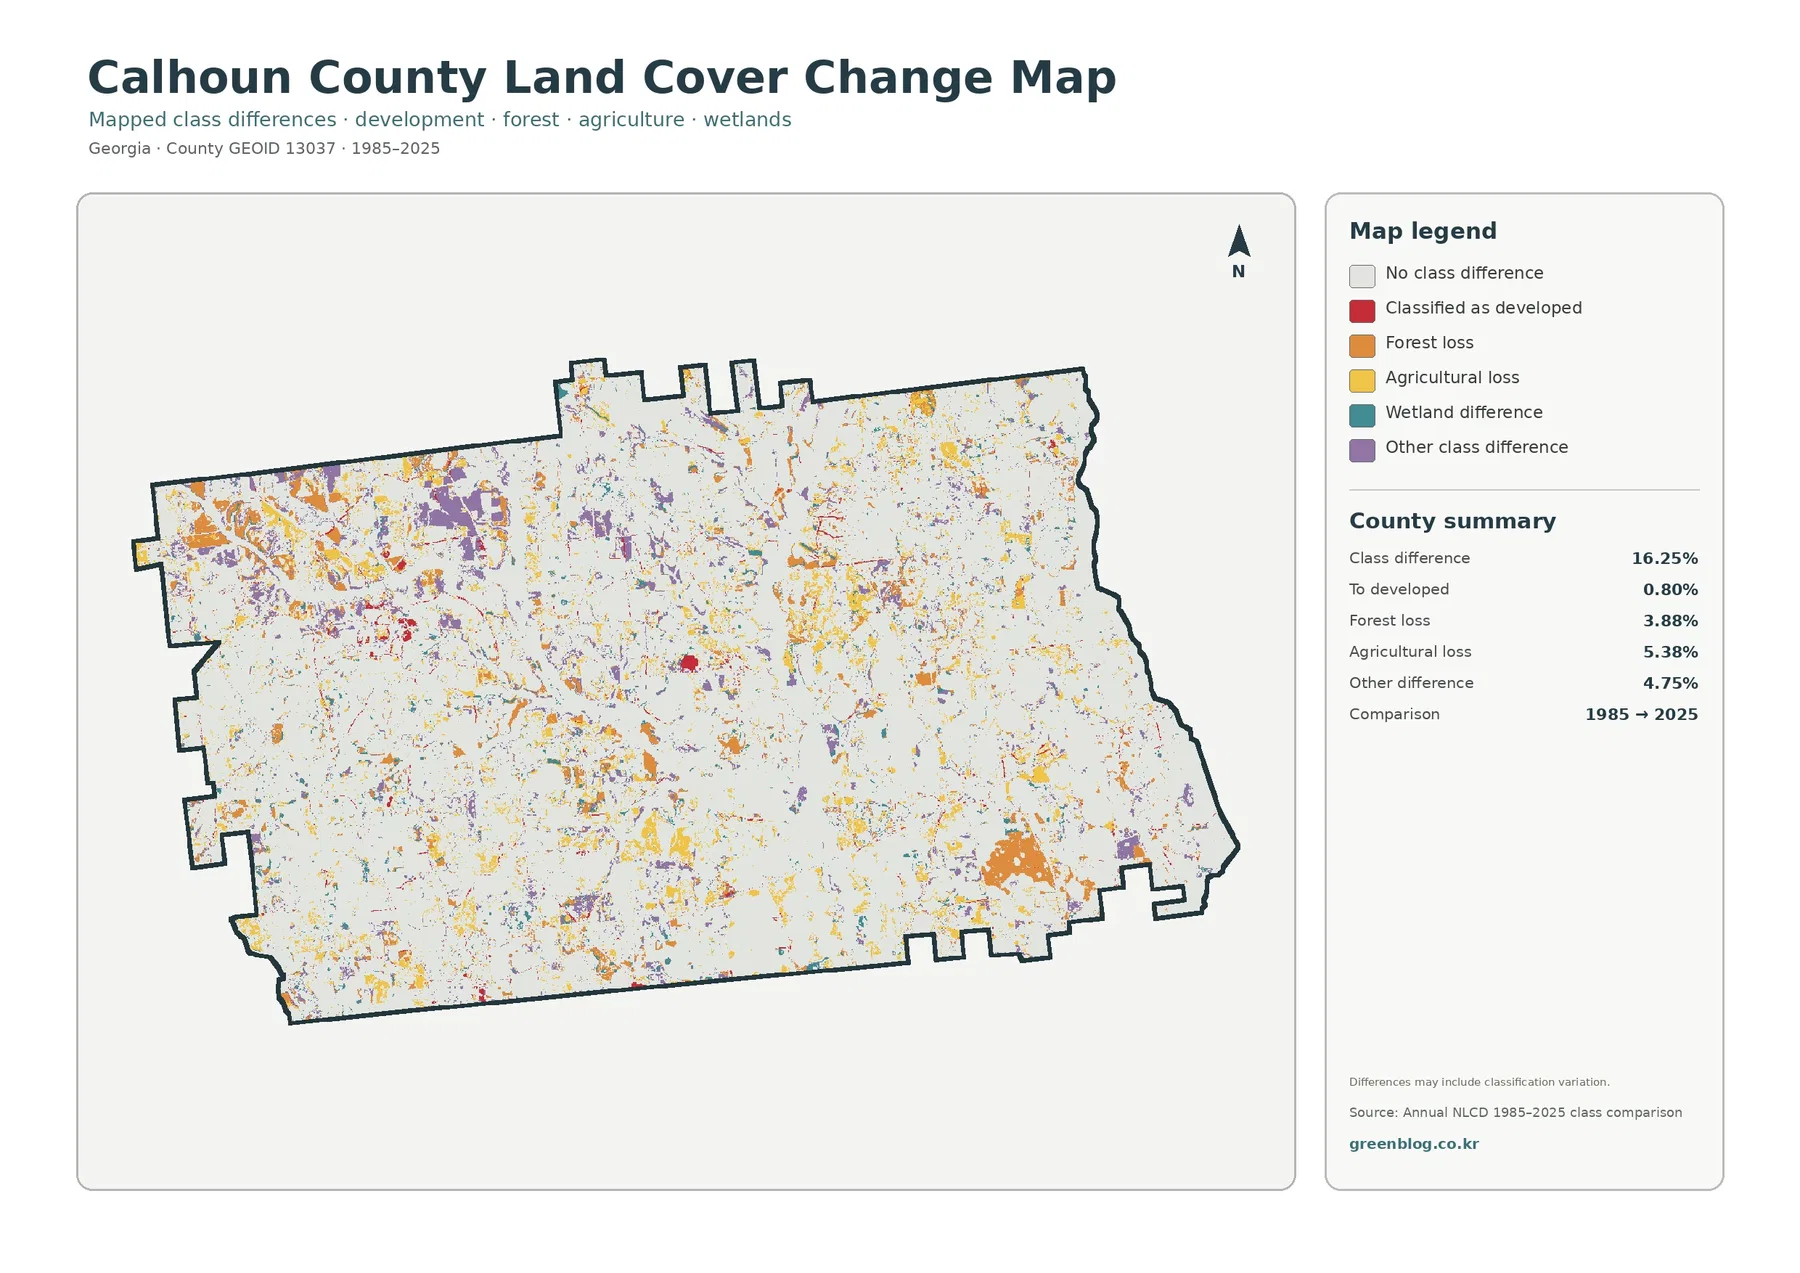
Most of the county remains in the light “no class difference” color, but change patches are scattered widely. Orange and purple areas are especially noticeable in the west and northwest, with smaller pieces extending across the center and north. A larger orange patch appears in the southeast as well. Red developed-change areas are comparatively sparse and often appear as small points or narrow traces near the existing built pattern. The visual result is one of dispersed land-cover change rather than a single expanding urban front.
Wetlands deserve a separate reading because 27.96% is not the same as open water
The size of the wetland percentage can be surprising. Wetlands account for 27.96% of the supplied 2025 summary, while open water accounts for only 0.73%. A wetland classification can represent places where water, saturated soils, and wetland vegetation shape the surface, so it does not need to look like a lake. On the map, wetlands form a network of teal areas that run through agricultural and forested portions of the county. Open-water blue is much more limited.
The downloadable files are original JPGs, but they are not marked as A3 high-resolution assets
The ZIP download contains four original JPG maps rather than the smaller WebP images used for the page display. According to the supplied asset manifest, each JPG is 2480×1754 pixels. The manifest does not mark those files as meeting the project’s A3 high-resolution reference. They can still work well for screen viewing, documents, and many presentations, but anyone planning a large A3 print should test the intended print size first and make sure labels and boundaries remain sharp enough for the specific printer and layout.
Thirty-meter raster cells set the scale of what these maps can and cannot show
Annual NLCD is a raster product derived from Landsat imagery at 30-meter spatial resolution. A raster divides the landscape into grid cells and assigns a representative value to each cell. A 30-meter cell may contain more than one real-world surface—perhaps trees, a driveway, grass, and part of a building—so very small features can be simplified or absorbed into the surrounding classification. Parcel lines, narrow streams, individual buildings, and short road segments should not be expected to match a 30-meter land-cover grid with survey-level precision.
Frequently Asked Questions
Why does Calhoun County look so wet if open water is only 0.73%?
Because the 27.96% wetland class is separate from open water. Wetlands can include vegetated or seasonally saturated areas that do not appear as open blue water. The general map therefore contains extensive teal wetland cover even though blue water is limited. The two categories should be read separately, especially when comparing the county with places where lakes or reservoirs make up a larger share of the surface.
Which map is most useful for finding the small developed centers around Morgan, Edison, Arlington, and Leary?
The impervious-surface map is the clearest for that purpose because hard surfaces are concentrated into small, visible clusters. The general land-cover map provides the surrounding farm, forest, and wetland context, so the two maps work best as a pair. Exact municipal boundaries and street names still require the Census reference map or another official local map.
Map File Information
The downloadable ZIP contains the four original JPG maps for Calhoun County: general land cover, forest and farmland, impervious/developed land, and 1985–2025 land-cover change.
- Included Versions: Land cover / Forest & farmland / Impervious & developed land / Land-cover change
- Included Files: 4 JPG maps
Related Maps
- Appling County Georgia Land Cover Map
- Atkinson County Georgia Land Cover Map
- Bacon County Georgia Land Cover Map
Sources and References
- MRLC Annual NLCD Data – current Annual NLCD data access and product information
- USGS Annual NLCD Land Cover Classification – official land-cover class definitions and interpretation guidance
- UGA Extension Calhoun County Agriculture & Natural Resources – local agricultural and natural-resource context
- Georgia DCA Calhoun County Comprehensive Plan – official planning material covering Morgan, Arlington, Edison, and Leary
- U.S. Census Bureau 2020 Georgia County Reference Maps – official reference map for county and municipal locations
Green Map creates custom-edited map images using open geographic data sources such as geoBoundaries, Natural Earth, OpenStreetMap, and government open data.
These maps are edited visual materials, not raw data files, and are provided for education, documents, presentations, and graphic reference.