The Russell County Alabama Land Cover Map set provides four views of the county: current land cover, forest and farmland, impervious surface, and mapped class differences between 1985 and 2025. Forest is the dominant 2025 cover at 52.23%, while the strongest concentration of developed and impervious surface appears in the northeast near Phenix City. Water and wetlands are also easy to trace along parts of the eastern Chattahoochee River boundary.
The four original JPG maps are available together in one download near the end of this page. They are useful for classroom work, county-scale environmental reference, presentations, and side-by-side comparison. The article focuses on what is actually visible in the supplied maps, explains how the percentages differ from one another, and points out where the data should not be treated as parcel, zoning, engineering, or flood-risk information.
Table of Contents
The northeast stands out most clearly on the impervious surface map
Russell County sits in east-central Alabama beside the Chattahoochee River and the Georgia state line. Phenix City occupies the county’s northeastern urban area across the river from Columbus, Georgia. That geographic setting becomes especially clear on the impervious surface view, where the county is mostly pale but the northeast contains a dense group of orange, red, and dark red cells. Smaller concentrations appear elsewhere, yet none approaches the size and continuity of the northeastern cluster.
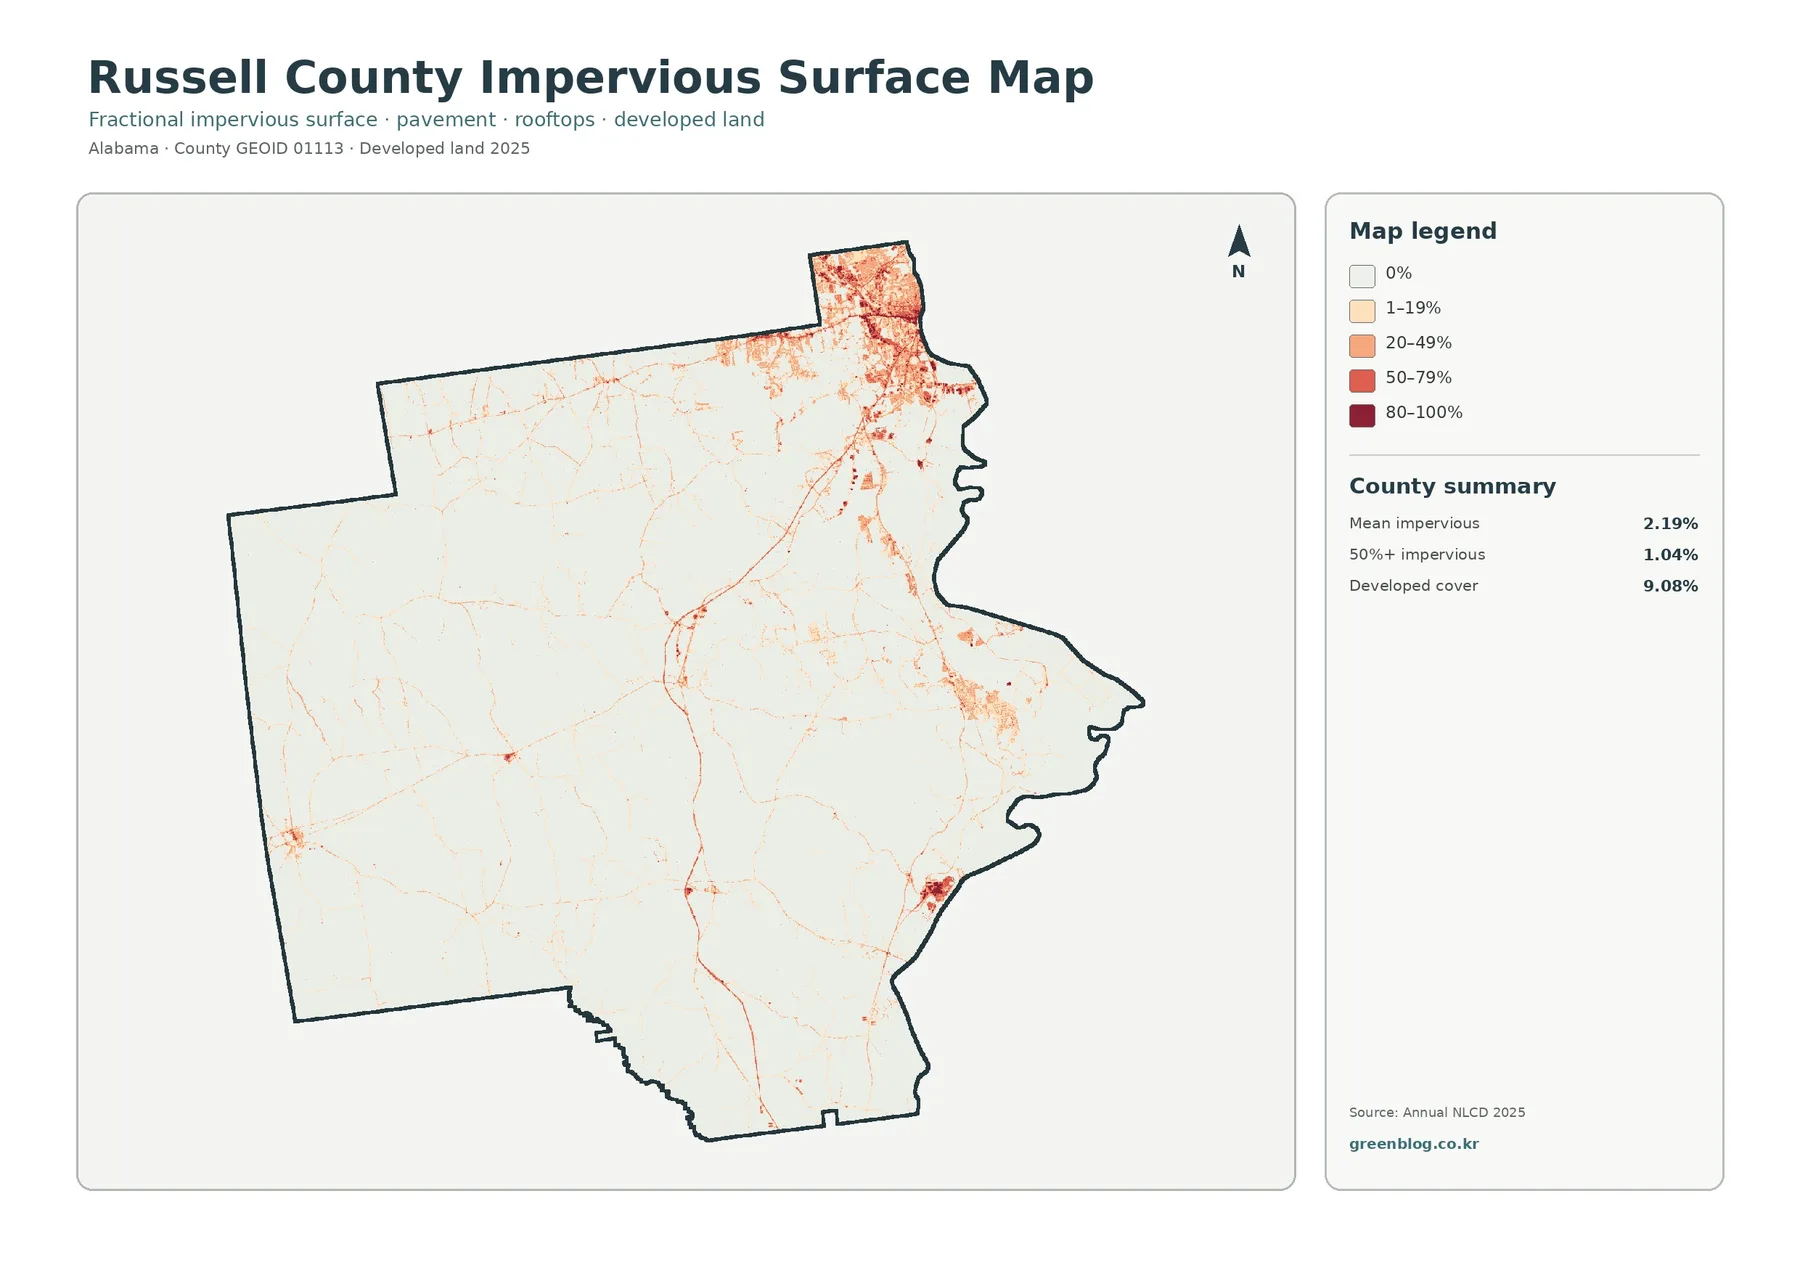
Impervious surface means material such as pavement, rooftops, concrete, and similar built surfaces that do not readily absorb water. The map summarizes a mean impervious value of 2.19% across the county. Cells with at least 50% impervious surface account for 1.04%, while developed land in the broader land-cover classification accounts for 9.08%. Those figures are not supposed to match. A developed land-cover cell can contain lawns, trees, open soil, or other permeable surfaces in addition to roads and buildings.
The difference between the 9.08% developed cover figure and the 2.19% mean impervious value is useful when reading the other maps. The land-cover product answers a categorical question: what broad class best represents each cell? The impervious product asks how much of a developed cell is covered by constructed surface. A suburban area with houses, yards, street trees, and pavement may be classified as developed even though much of the ground remains permeable. The impervious map therefore gives a more focused picture of the hard-surface footprint.
Linear traces extending away from the northeast can help a reader compare transportation and settlement corridors, but they should not be treated as proof that a particular road caused development. The map shows spatial association, not a cause-and-effect history. It is also not a stormwater model. High impervious cover can matter for runoff, yet flood behavior depends on rainfall, terrain, drainage infrastructure, river conditions, soils, and many other factors that are not represented here.
Forest covers most of the interior, while farmland and open cover break it into a patchwork
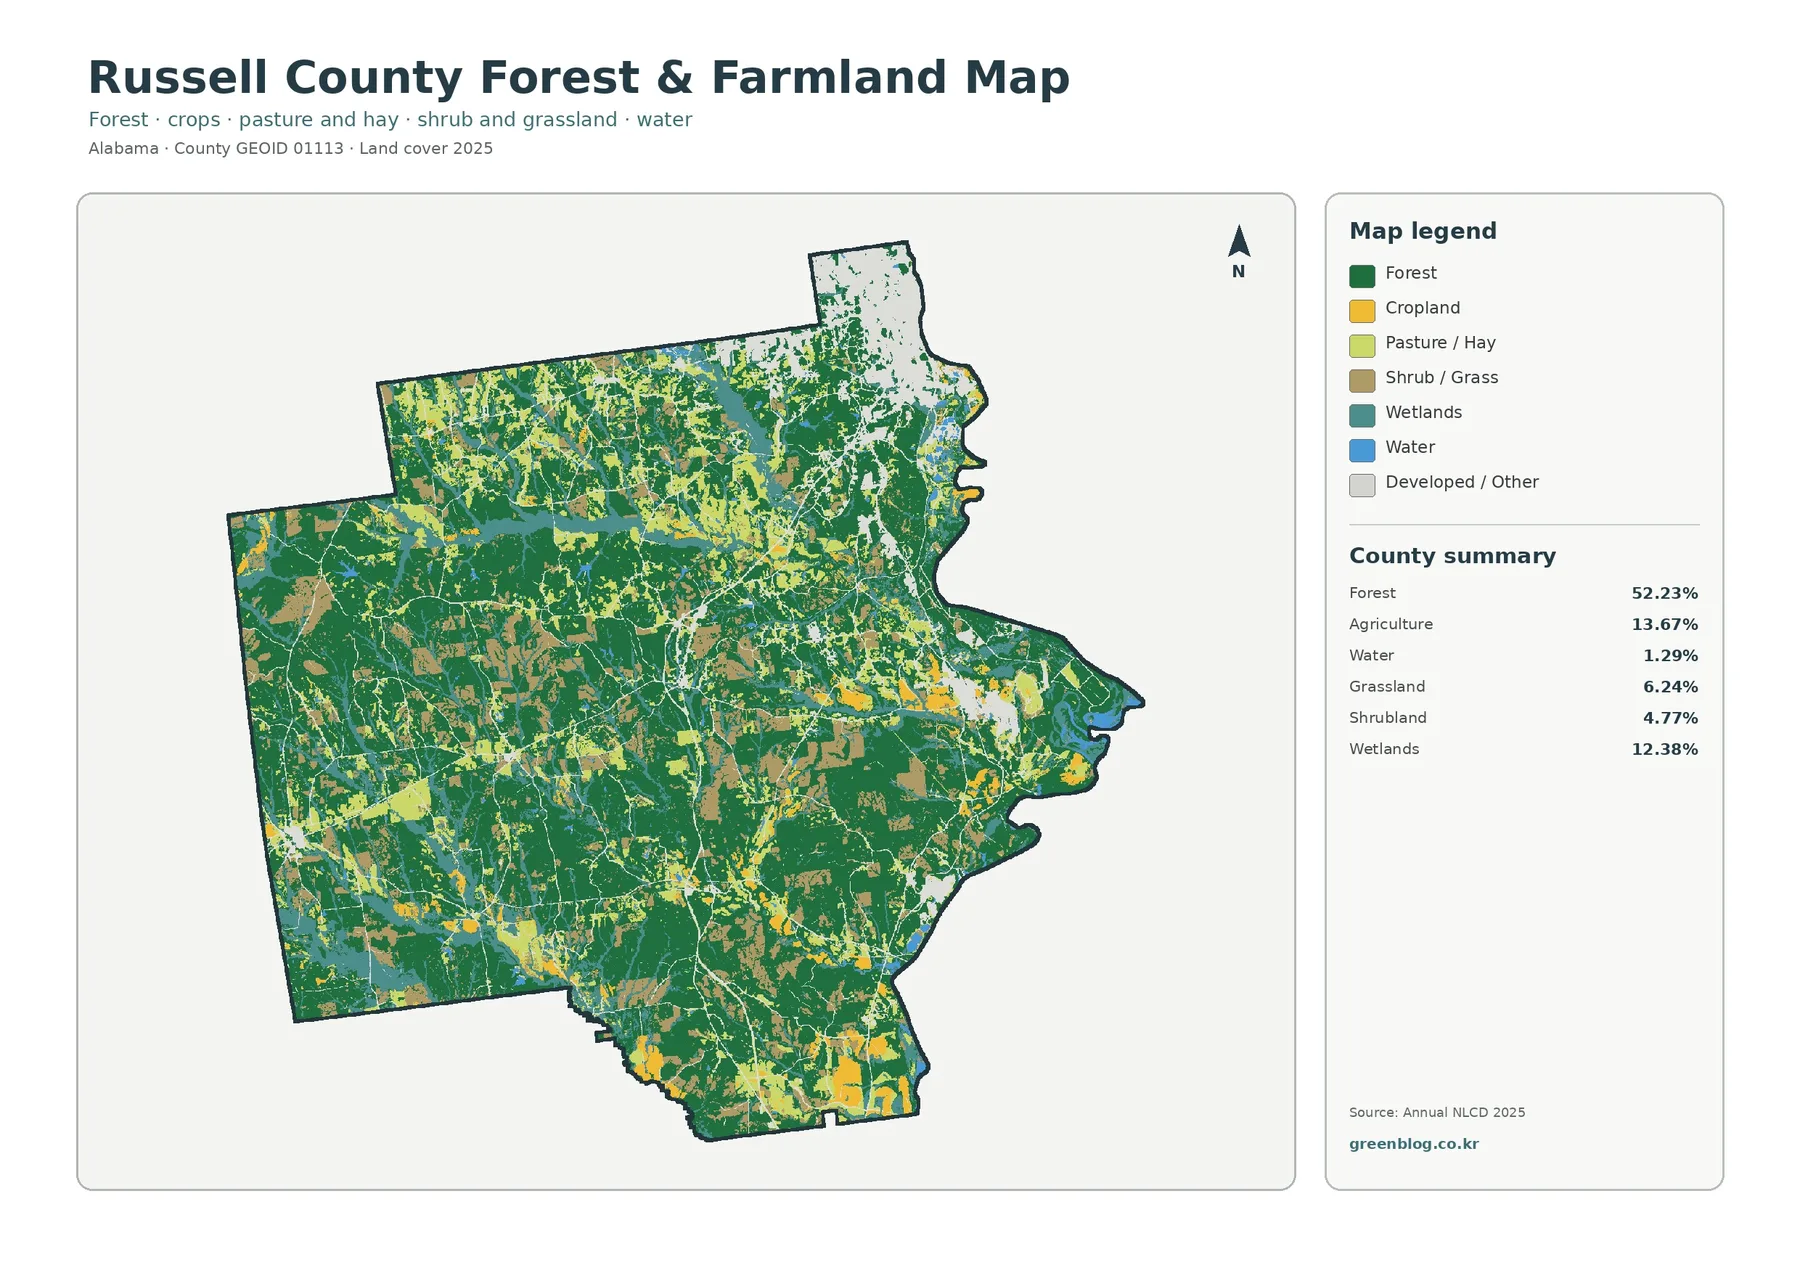
Once developed and other cover is pushed into the background, the county’s rural pattern becomes easier to see. Dark green forest extends through much of the west, center, and south. Agricultural land totals 13.67%, grassland 6.24%, and shrubland 4.77%. These open classes are not confined to a single district. They appear as fields, strips, and irregular blocks embedded within the broader forest cover, with some larger agricultural patches toward the southern end and parts of the east.
Reading cropland together with pasture or hay is more informative than looking only for the yellow agricultural cells. The forest-and-farmland map separates several kinds of open cover, so a reader can see where the landscape is not continuously wooded even when the general land-cover map looks predominantly green. It does not identify property ownership, crop type, farm boundaries, or grazing management. A 30-meter grid cell can also contain more than one real-world surface, especially along field edges, narrow roads, small ponds, and scattered buildings.
Wetlands account for 12.38%, a substantial share compared with the county’s agricultural total. Their blue-green pattern follows many narrow drainage paths and broader low-lying areas rather than forming one compact block. Water itself accounts for 1.29%. When wetlands and water are read together, the map provides a useful county-scale view of where wetter environments intersect forest and farmland. It does not establish wetland jurisdiction or show whether a mapped wetland is permanently flooded, seasonally saturated, forested, or suitable for any particular activity.
The Alabama Cooperative Extension System’s Russell County office lists agriculture, agronomic crops, farm management, forestry, wildlife, and natural resources among the programs serving the county. That local mix is consistent with the reason this map is useful: Russell County cannot be summarized as only urban, agricultural, or forested. More than half of the mapped surface is forest, but farms, grass and shrub cover, wetlands, water, and developed areas all occupy meaningful parts of the county.
The complete 2025 map shows how the county’s major cover classes meet
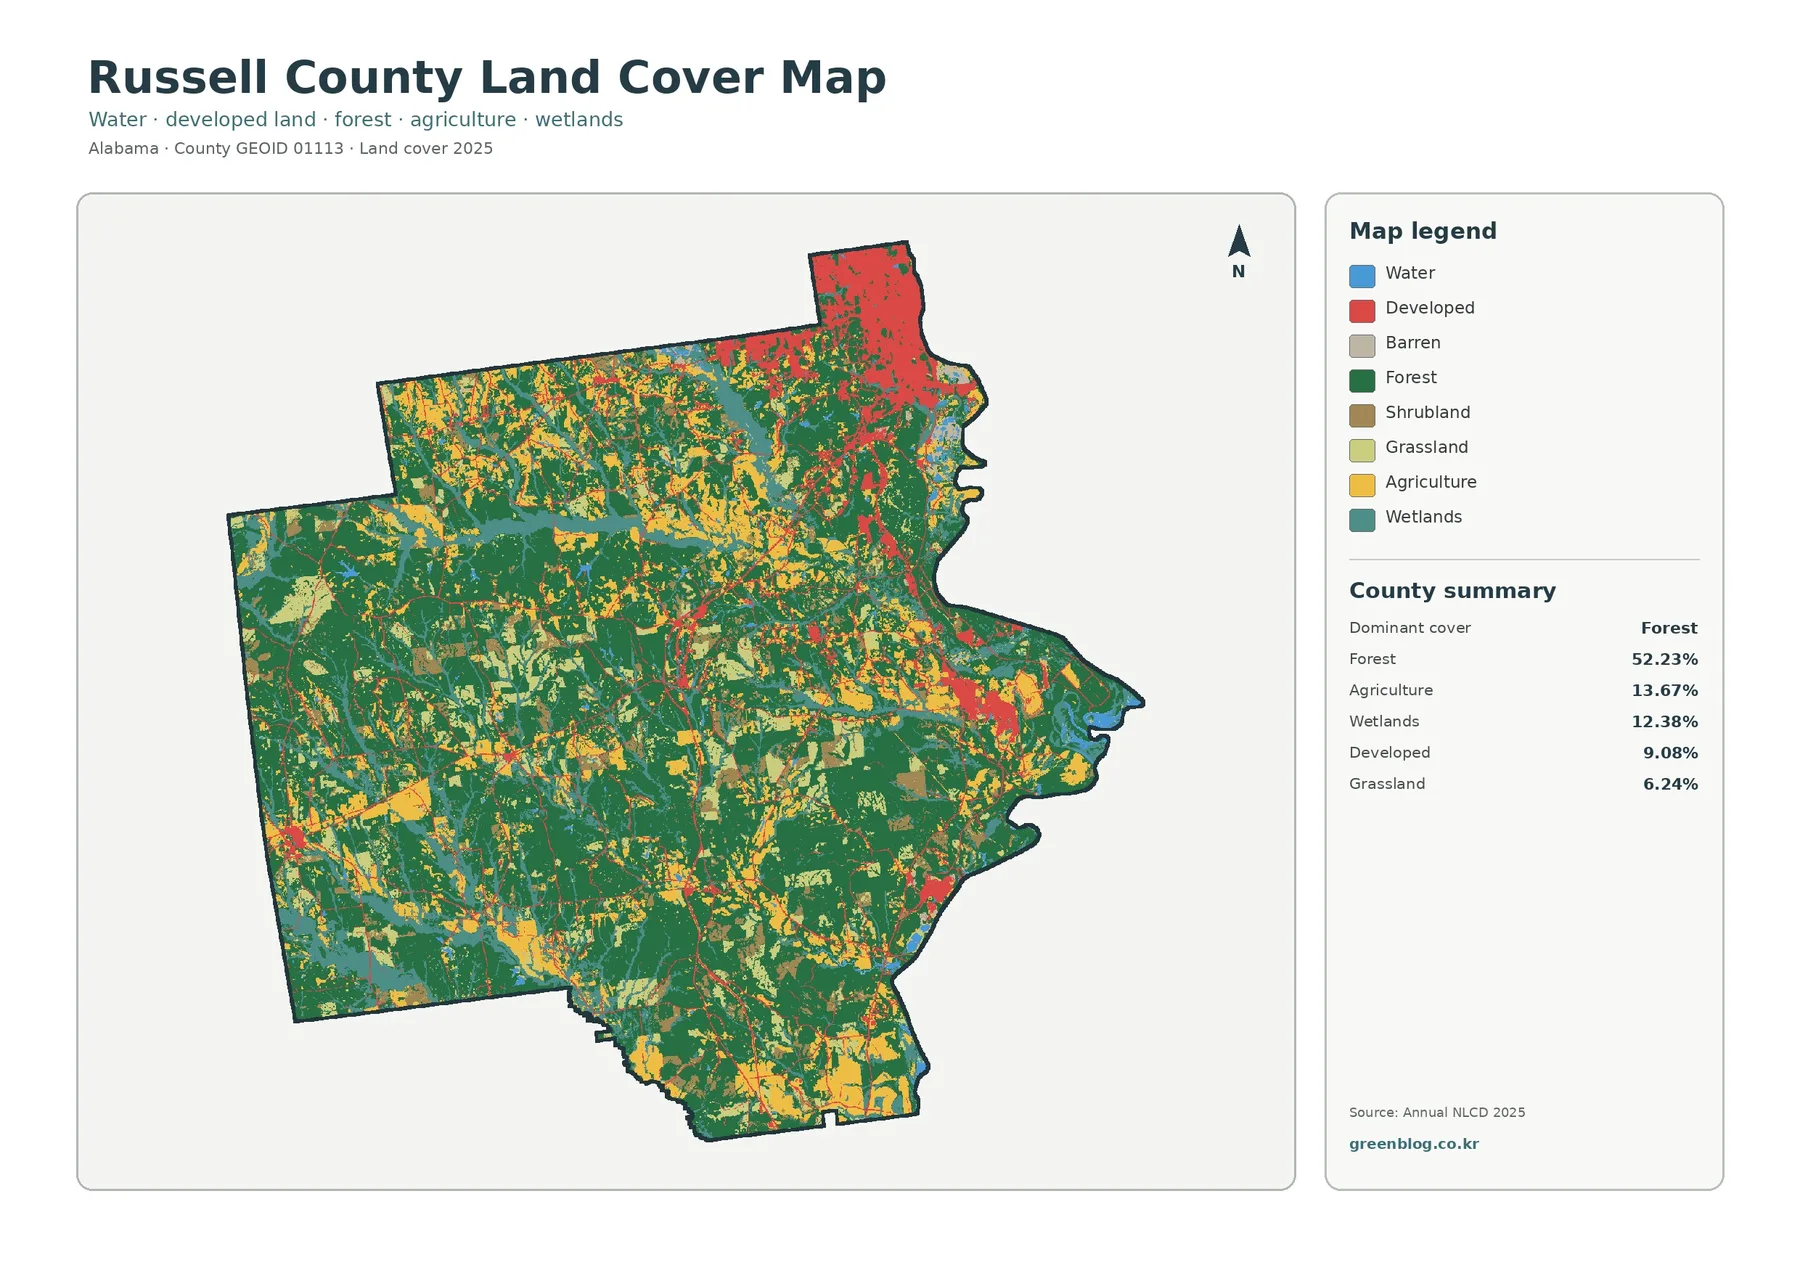
The general map is the best place to understand the county as a whole because it keeps all major classes visible at once. Forest leads the county summary at 52.23%, followed by agriculture at 13.67%, wetlands at 12.38%, developed cover at 9.08%, and grassland at 6.24%. Shrubland and water are smaller but still visible. The result is a county with a forest-dominant interior, scattered open agricultural areas, a strong urban concentration in the northeast, and wet corridors that repeatedly cut through the wooded and agricultural landscape.
The eastern side deserves special attention because several classes meet there. Russell County’s boundary follows the Chattahoochee River for part of its eastern edge, and Phenix City lies on the river opposite Columbus. Blue water and blue-green wetlands occur near that boundary, while red developed cover is concentrated most heavily in the northeast. Farther south and inland, agriculture, forest, and wetland colors become more mixed. The map therefore gives a useful visual transition from an urban river edge to a much more rural interior without implying that every eastern location is urban.
The western half looks quieter in the developed-land color, but it is not uniform. Agricultural and grassland patches interrupt the forest in many places, while wetland corridors trace drainage features through the interior. This matters when the map is used for habitat or watershed education. A large green area can contain numerous streamside wetlands and open fields that are difficult to describe with a single county-wide percentage. Comparing the complete map with the forest-and-farmland view helps separate those pieces more clearly.
Land cover should not be confused with land use or zoning. A forest-colored cell does not mean the land is a park, protected forest, or publicly owned. An agricultural cell does not define a legal farm parcel, and a developed cell does not state which kinds of buildings or activities are permitted there. The map classifies the surface visible to a satellite-based system according to a national scheme. Legal land use, ownership, permits, and parcel boundaries require different records.
The 1985–2025 map separates development from other kinds of class difference
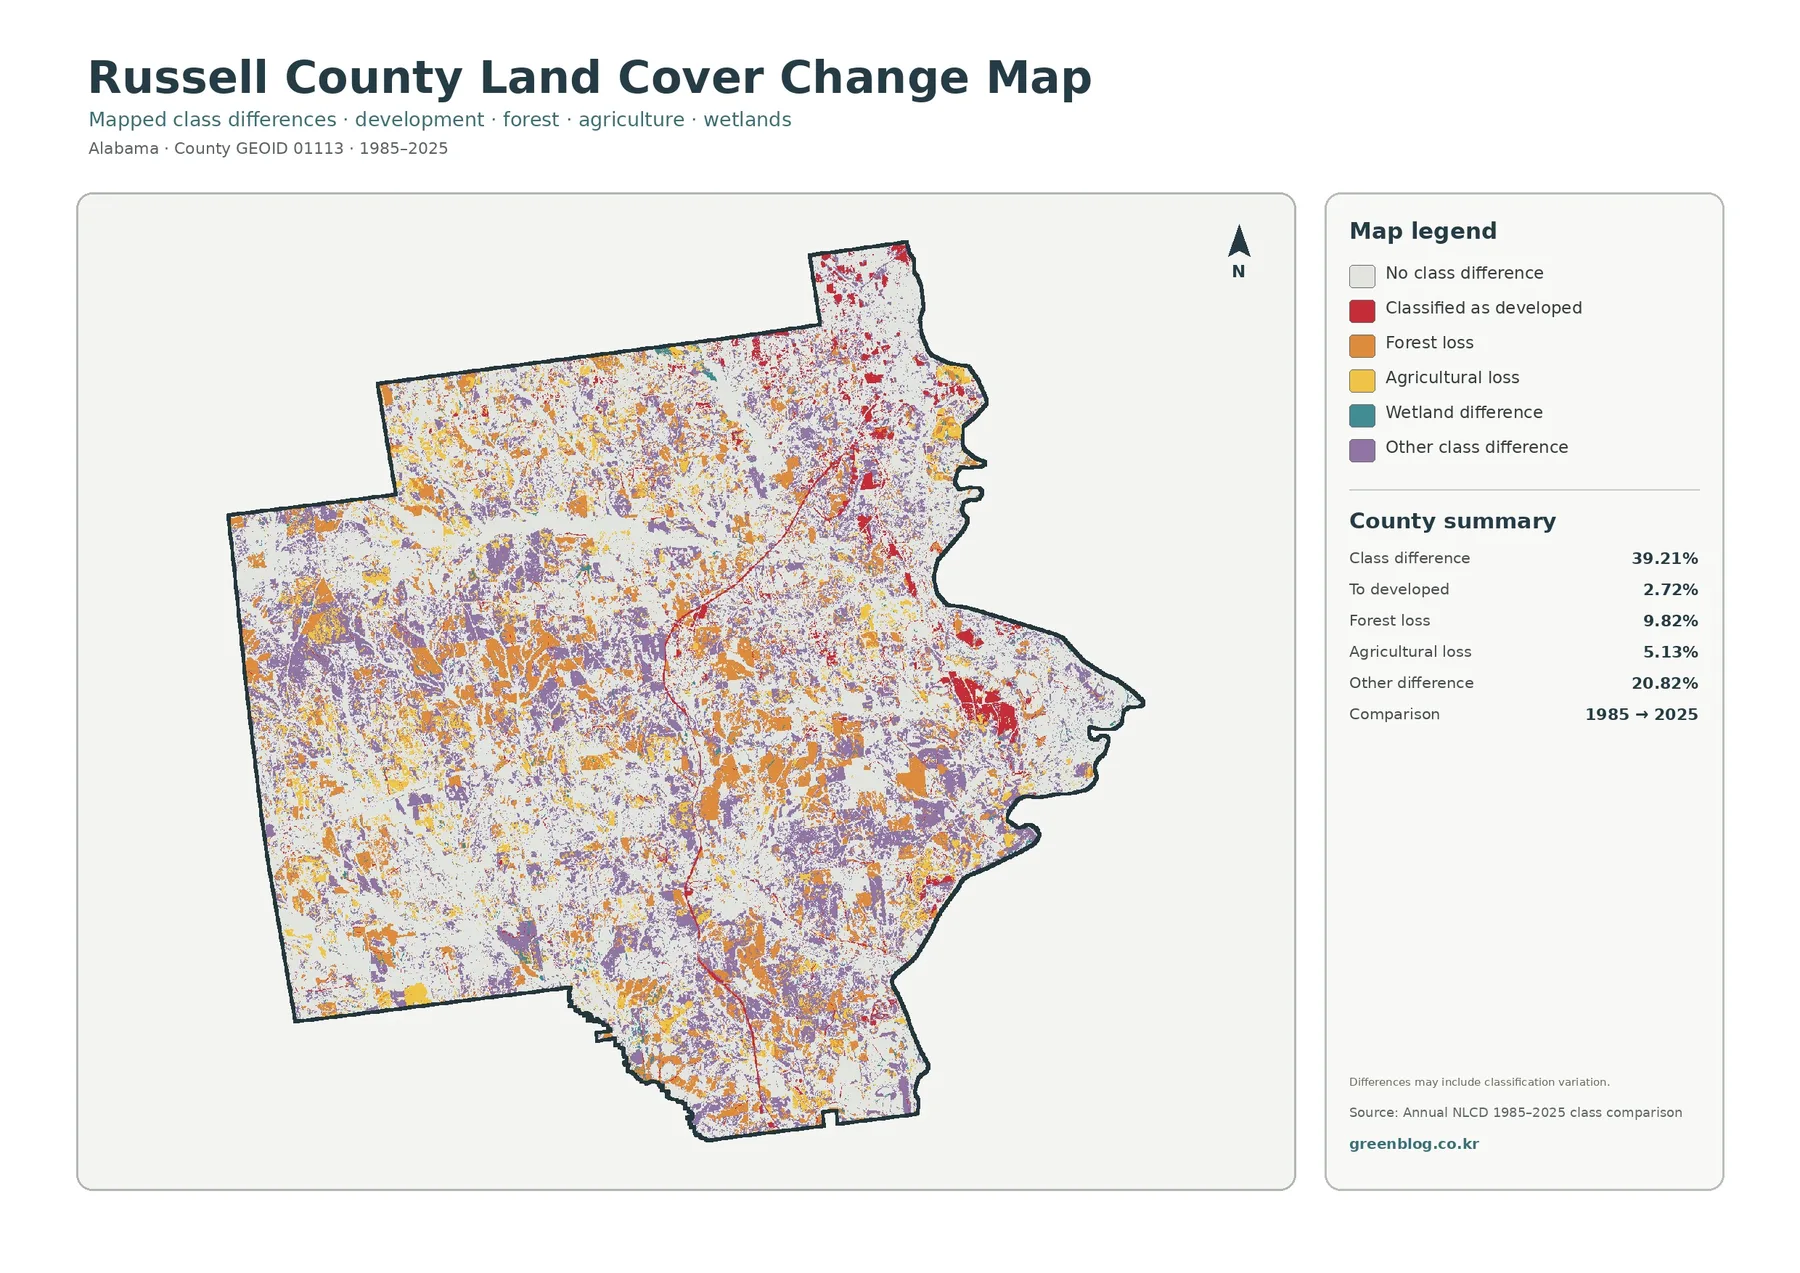
The headline number on the change map is 39.21% class difference, but it needs careful interpretation. It does not mean 39.21% of Russell County became developed, and it does not mean that the same share underwent one uniform type of physical conversion. The legend separates 2.72% classified as developed, 9.82% forest loss, 5.13% agricultural loss, and 20.82% other class difference. The large “other” category alone shows why the total should not be described as a simple development or deforestation rate.
Red development-change cells are most noticeable in the northeast and in several smaller eastern concentrations. Orange forest-loss cells are scattered more broadly through the interior, while agricultural-loss colors appear as smaller patches in many locations. Purple other-difference cells are widespread across central and southern parts of the county. The pattern is mixed rather than directional: different categories overlap across the same broad landscape, so a county-wide story must distinguish them instead of turning all colored cells into a single trend.
Annual NLCD is a raster dataset derived from satellite imagery at 30-meter resolution. A grid cell can change class because the real surface changed, but classification uncertainty, mixed pixels, differences in imagery, or transitions among similar classes can also contribute. The supplied map itself warns that differences may include classification variation. For that reason, the change product is best used to locate areas worth a closer look. Parcel-level confirmation should come from aerial photography, site records, permits, field observations, or another detailed local source.
A practical way to use the comparison is to pair it with the current impervious map. The northeastern area has both visible 2025 impervious concentration and red cells on the change map, making it a logical place for a historical image comparison. In a forest-loss area farther inland, the forest-and-farmland map provides a better companion because it shows the current mixture of forest and open cover. Using the map pair that matches the question prevents the 1985–2025 layer from being treated as a universal explanation.
Using the Chattahoochee River and Phenix City as orientation points
Readers unfamiliar with Russell County can orient themselves by starting at the irregular eastern boundary. Alabama emergency-management planning material describes the county as being along the Chattahoochee River, and official Phenix City material places the city on the river’s west bank opposite Columbus. On the maps, that northeastern river-side area is where developed cover and impervious surface are most concentrated. It provides a recognizable reference point before moving into the more forested and agricultural interior.
Following the boundary southward, the land-cover map continues to show water and wetland features near the river while the impervious surface generally becomes less dense than in the northeast. Moving west instead, the map becomes increasingly dominated by forest with scattered agricultural and grassland openings. These are broad visual tendencies, not hard regional divisions. Smaller developed places occur away from Phenix City, and open land appears throughout the county, so the maps should be read as gradients and clusters rather than as a simple urban-east/rural-west split.
Water and wetlands should also be kept separate. Blue areas identify open water, while the wetland class represents a different type of surface that can include vegetation and seasonally wet conditions. A wetland pixel does not necessarily indicate standing water on the date of a visit. Conversely, narrow streams may be too small to dominate a 30-meter cell and can be represented by the surrounding class. This scale issue is one reason the maps work well for county comparison but not for locating exact stream banks or wetland boundaries.
Practical ways to use the four maps
Build a classroom comparison around one location
For a lesson or presentation, choose one location and follow it through all four views. The Phenix City area works well because the complete map shows developed land, the impervious layer separates low and high hard-surface percentages, the forest-and-farmland view pushes urban cover into the background, and the change map adds historical class differences. An inland forest-and-farm area produces a different comparison and can be used to discuss why county averages hide local variation.
Use wetlands and water for watershed context, not legal delineation
The general and forest-and-farmland maps are useful for identifying broad wet corridors and their relationship to forest, agriculture, and developed land. That can support environmental education, early watershed discussions, or a presentation about landscape setting. It is not a substitute for a jurisdictional wetland survey, flood insurance map, stream-gauge data, or site-specific drainage study. The value is regional context: seeing where wet cover repeatedly appears across the county before moving to more specialized data.
Keep the original pixel size in mind when printing
Each downloadable JPG measures 2480 × 1754 pixels. The files are larger than the WebP previews used in the body of the page, but the supplied asset manifest explicitly marks them as not meeting the package’s A3 high-resolution reference. They should therefore be described by their actual pixel dimensions rather than promoted as high-resolution A3 originals. For print work, preserve the aspect ratio and make a proof at the intended size to confirm that the legend and small map details remain legible.
What the maps do not tell you
- They are not parcel maps. Property lines, ownership, zoning, easements, and development rights are outside the land-cover classification.
- They generalize the surface into 30-meter raster cells. Small roads, buildings, ponds, field edges, and narrow streams can be mixed with the surrounding cover.
- The current views are tied to the 2025 classification. Construction, clearing, farming, or vegetation changes after the observation period may not appear.
- The change map includes classification variation. Its 39.21% total should not be treated as a measured rate of physical land conversion.
- The impervious map is not a flood map. It helps compare constructed surface but does not model rainfall, river stage, drainage capacity, or flood zones.
These limits do not reduce the value of the maps when they are used for the right scale. They are designed to make county-wide patterns easy to compare. A researcher, teacher, planner, or resident can quickly identify forest-dominant areas, open agricultural patches, wet corridors, urban concentration, and broad historical class differences. More detailed questions should then move to Census boundaries, local planning records, current aerial imagery, field data, or specialized environmental maps.
Download the four Russell County land-cover JPG maps
The JPG files can be opened in ordinary image software without GIS tools. They include the county outline and legends needed to understand the colors, but they do not include parcel identifiers or a detailed street basemap. If you resize an image for a slide or printed handout, keep the original proportions so the county shape, legend, and text are not distorted.
Frequently Asked Questions
What is the largest 2025 land-cover class in Russell County?
Forest is the dominant class at 52.23%. Agriculture accounts for 13.67%, wetlands 12.38%, developed cover 9.08%, and grassland 6.24%. These are county-level summaries of the Annual NLCD classification, not surveyed parcel acreages.
Why is developed cover 9.08% when mean impervious surface is only 2.19%?
Developed land can include both constructed and permeable surfaces. A residential cell may contain roofs and pavement together with lawns, trees, and soil. The impervious product estimates the share covered by constructed surface, so its county-wide mean is not expected to equal the area classified broadly as developed.
Does the 39.21% class difference mean 39.21% of the county was developed after 1985?
No. The 39.21% figure includes several categories. The supplied map lists 2.72% as classified to developed, 9.82% forest loss, 5.13% agricultural loss, and 20.82% other class difference. Classification variation can also be part of the comparison, so the total is not a development rate.
What is included in the download?
The archive contains four 2480 × 1754 JPG images: the complete 2025 land-cover map, forest and farmland map, impervious surface map, and the 1985–2025 land-cover change map. The WebP images in the article are previews; the ZIP contains the original JPG versions supplied for download.
Map File Information
Russell County Land-Cover Map Files
- Printable Size: 2480 × 1754 pixels each
Related Maps
- Autauga County Alabama Land Cover Map
- Baldwin County Alabama Land Cover Map
- Barbour County Alabama Land Cover Map
Sources and reference links
- MRLC Annual NLCD Data — access to current Annual NLCD products and data
- U.S. Geological Survey Annual National Land Cover Database — product descriptions, change information, and data guidance
- USGS: What is the spatial resolution of Annual NLCD data? — official 30-meter raster resolution explanation
- Alabama Cooperative Extension System — Russell County — county agriculture, forestry, wildlife, and natural-resource program context
- U.S. Census Bureau QuickFacts — Russell County, Alabama — county geography, land area, FIPS, and general statistics
- Alabama EMA Russell County Hazard Mitigation Plan — official county setting along the Chattahoochee River
Green Map creates custom-edited map images using open geographic data sources such as geoBoundaries, Natural Earth, OpenStreetMap, and government open data.
These maps are edited visual materials, not raw data files, and are provided for education, documents, presentations, and graphic reference.