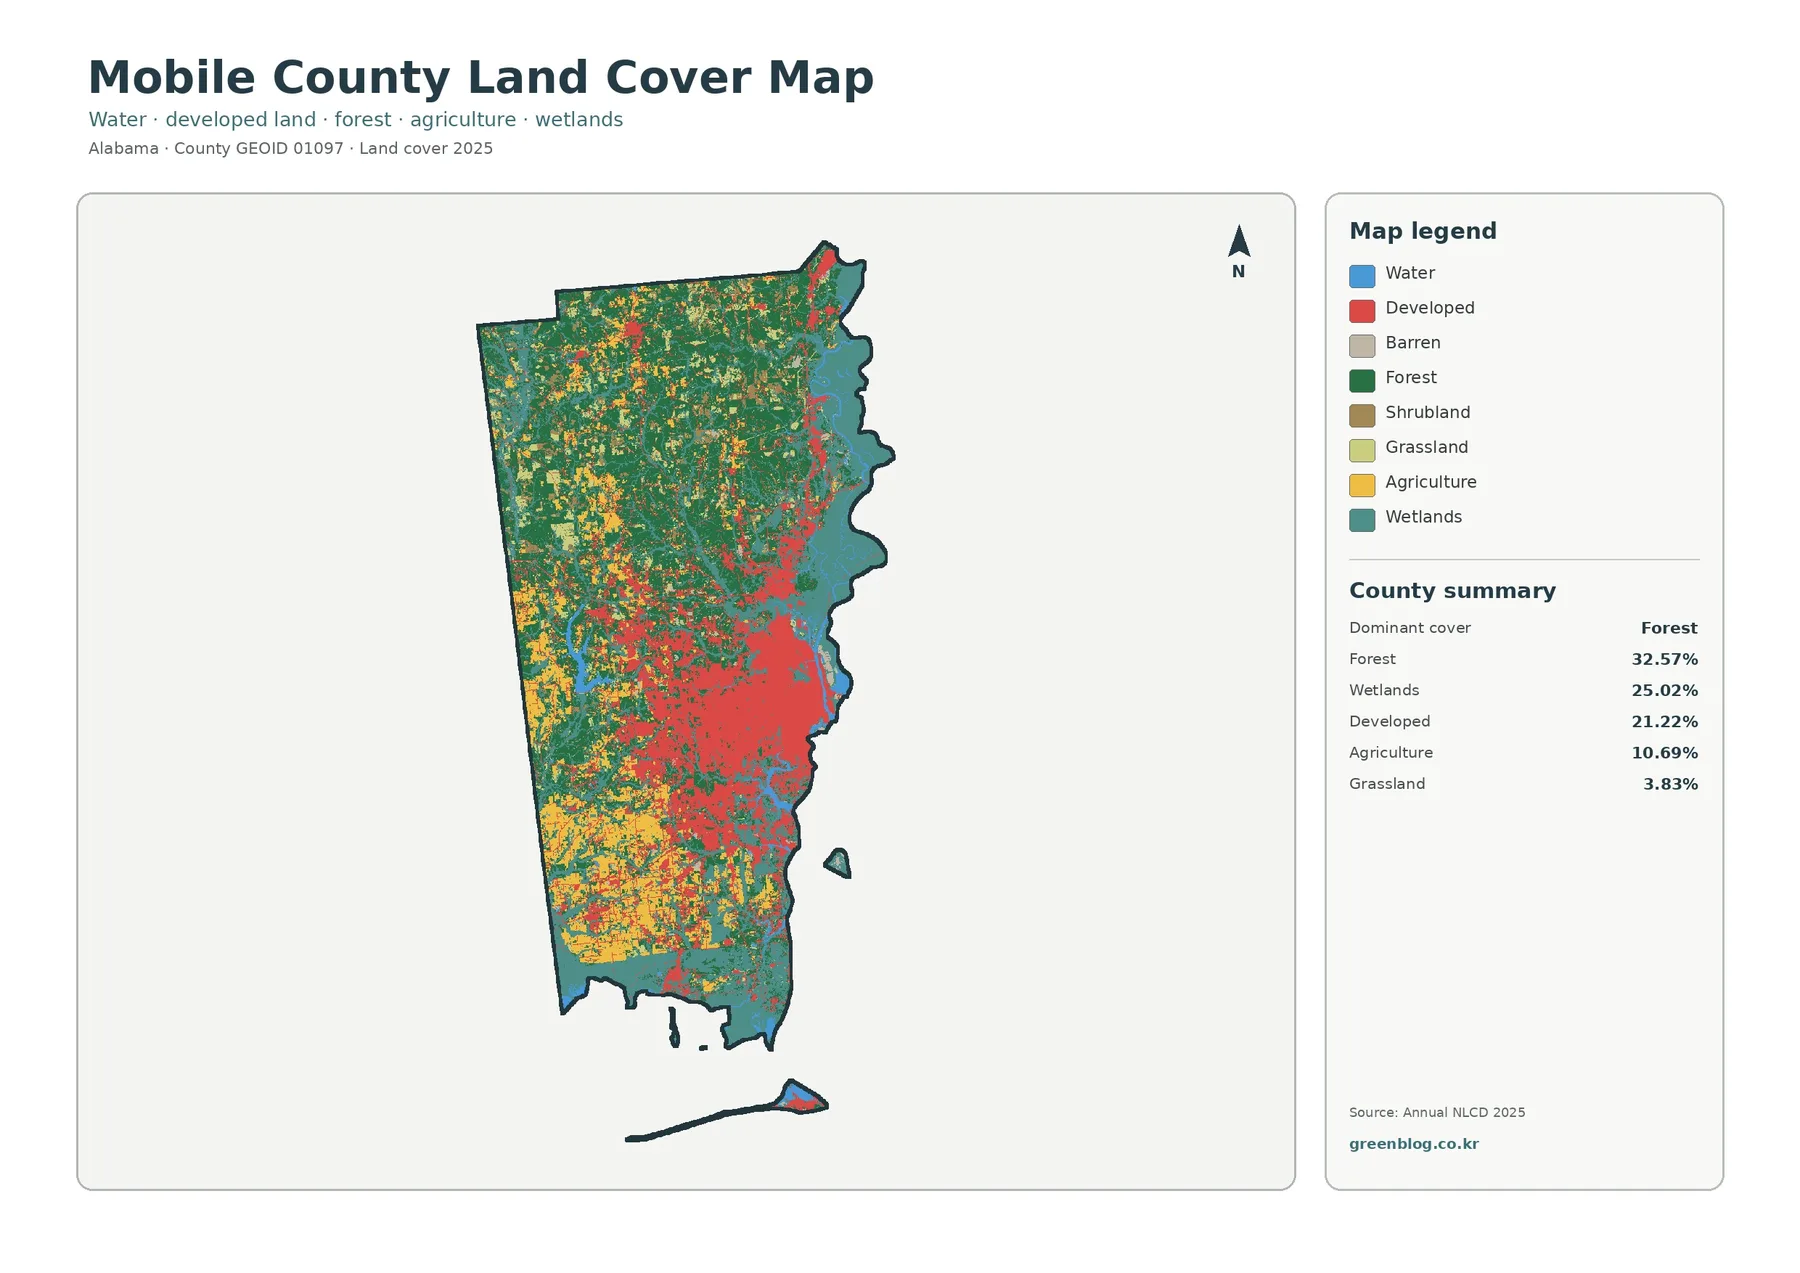
The Mobile County Alabama Land Cover Map shows a county where forest, wetlands, developed land, agriculture, and coastal water all occupy meaningful parts of the landscape. In the 2025 summary, forest is the largest class at 32.57%, wetlands account for 25.02%, and developed land reaches 21.22%. Those percentages are reflected in a strong geographic contrast: broad forest cover remains across much of the north and west, wetlands line a large part of the eastern and southern waterside, and a substantial developed concentration spreads through the central to southeastern part of the county.
This page separates that pattern into four views: general land cover, forest and farmland, impervious surface and developed land, and land-cover differences between 1985 and 2025. The WebP images are convenient for reading the page, while the four original 2480 × 1754 JPG maps are available together in one download below. They are useful for county-scale reference, classroom work, presentations, and broad environmental comparisons, but they are not parcel maps or legal land-use records.
Table of Contents
A Coastal County Where Forest, Wetlands, and Development All Matter
Mobile County’s official county profile places it in southwest Alabama next to Mobile Bay and the Gulf of Mexico. That setting helps explain why wetlands are not a minor fringe class on the map. The teal wetland color occupies a broad band along the eastern side and continues through southern coastal areas, giving the county a very different visual balance from an inland county dominated almost entirely by forest or farmland.
Forest still ranks first at 32.57%. Large green areas are especially evident across the northern and western parts of the county, although they are broken by smaller agricultural, developed, shrub, and grass patches. Wetlands follow at 25.02%, while developed land accounts for 21.22%. With three major classes each above one-fifth of the county, the overall pattern cannot be described well with a single label such as urban, forested, or coastal.
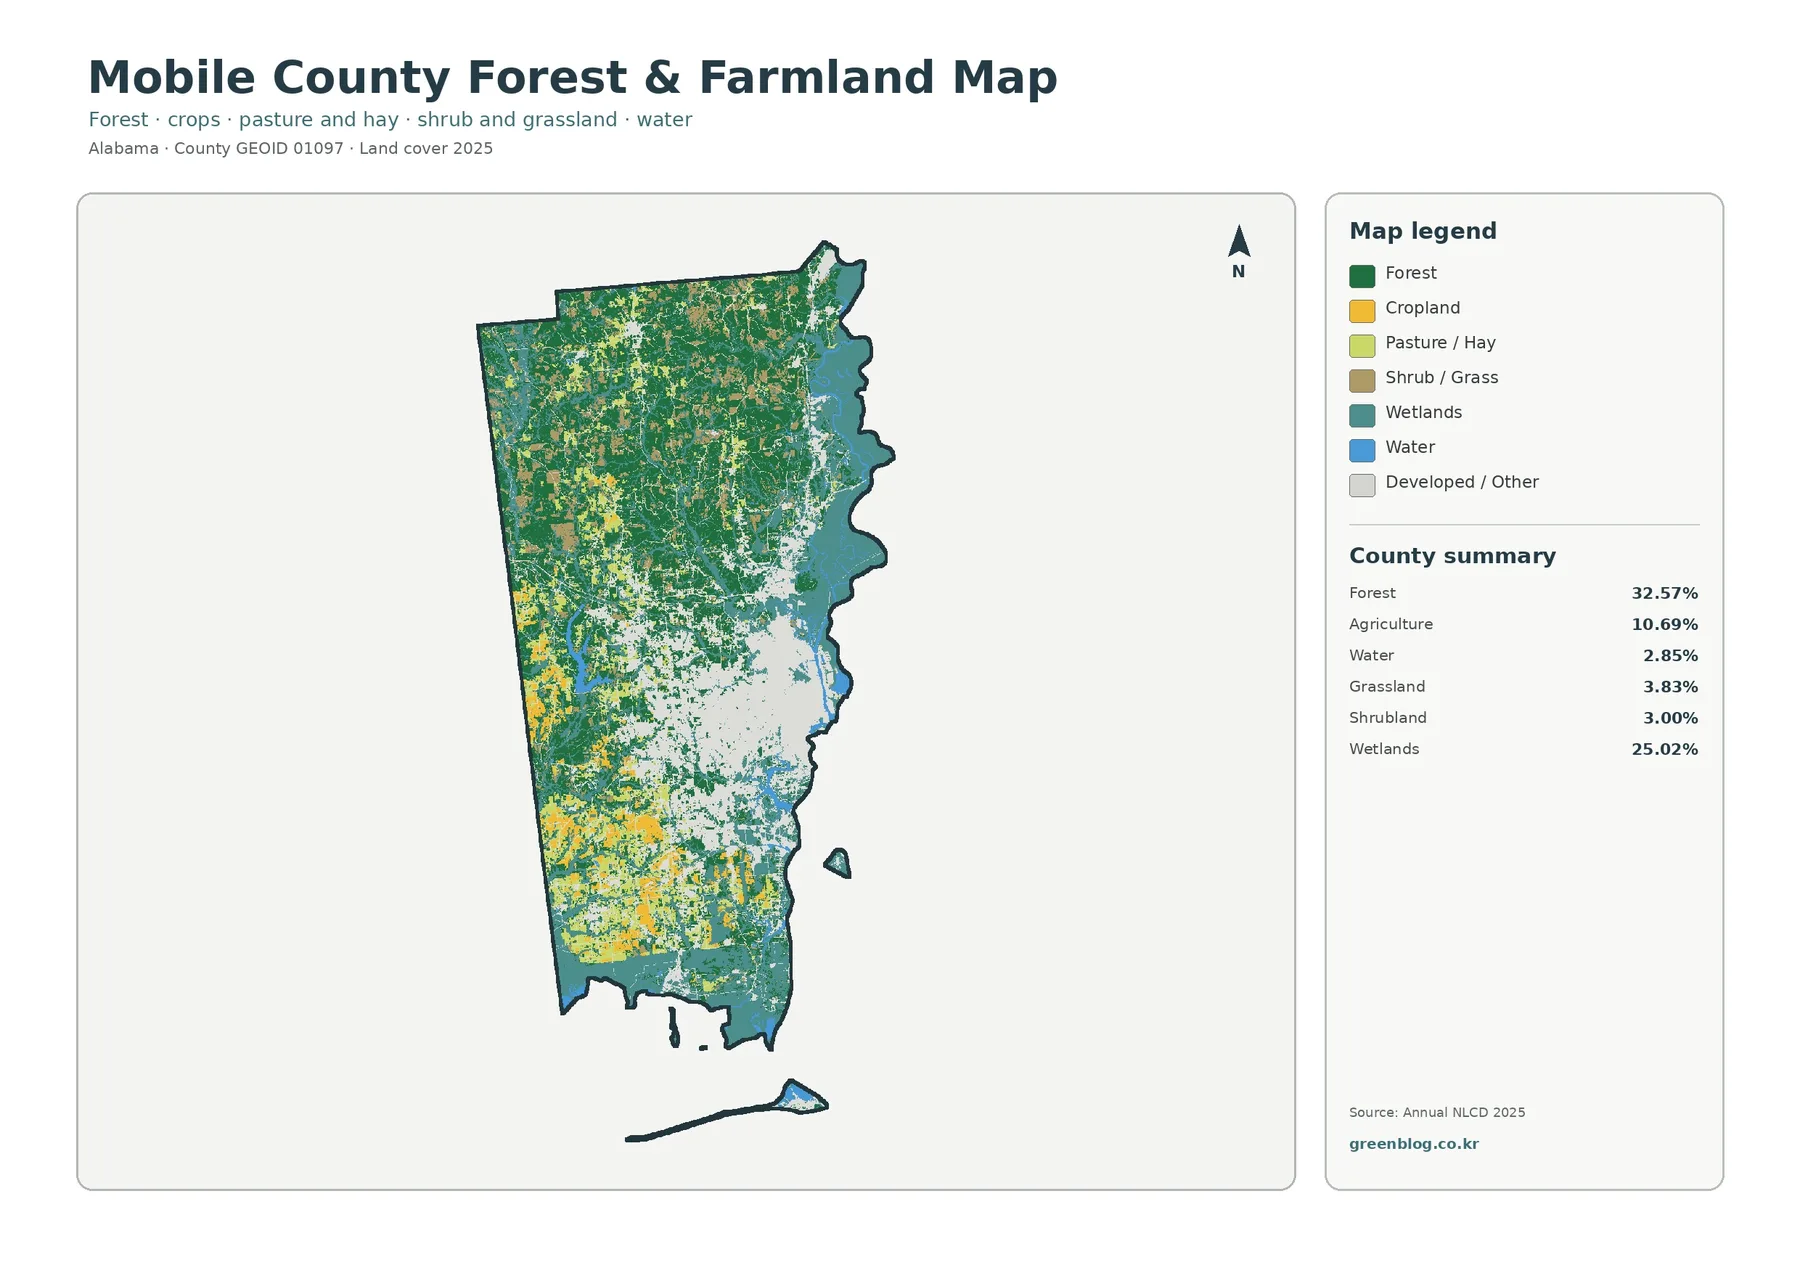
Agriculture makes up 10.69% of the 2025 summary. It is more concentrated than forest, with stronger yellow patches in western and southwestern areas rather than an even countywide spread. The forest-and-farmland view also reports 3.83% grassland, 3.00% shrubland, and 2.85% water. These smaller classes fill transitions among the dominant categories and help show that the spaces between large forest, wetland, and developed areas are not all the same kind of ground cover.
Land cover should not be confused with zoning, ownership, or legal land use. Annual NLCD classifies what the surface looks like from remote-sensing data: forest, open water, wetlands, developed surfaces, agriculture, and related classes. A green cell is not automatically public forest, and a red developed cell does not identify a zoning district or a building permit. Property decisions require the relevant local records and current site information.
Forest and Farmland Look Different Once the Wetland Edge Is Isolated
The forest-and-farmland map reduces the visual weight of developed and miscellaneous classes so the rural and natural cover types are easier to compare. Dark green forest forms the strongest continuous pattern in the north and west. Agricultural colors appear in larger clusters in western and southwestern Mobile County, while the eastern side remains dominated by the teal wetland class. This arrangement makes the county’s inland-to-waterside contrast much easier to see than on the general map.
The 10.69% agricultural share is important, but its location matters as much as the percentage. Some agricultural areas appear as small openings within forest, while others form broader blocks. That means a countywide number does not imply that farming is evenly distributed. For a classroom presentation or county profile, pointing to the western concentration on the map gives a clearer explanation than listing 10.69% by itself.
Wetlands occupy 25.02%, making them the second-largest cover class in the package. Outdoor Alabama lists the Mobile-Tensaw Delta Wildlife Management Area in Baldwin and Mobile counties, which provides verified regional context for the extensive wetland environment on the county’s eastern side. The land-cover image, however, does not draw the legal or management boundary of that wildlife area. It would be inaccurate to label every teal cell as part of the Mobile-Tensaw Delta.
Open water accounts for 2.85%, while grassland and shrubland together add several more percentage points. Around complicated waterside edges, blue water, teal wetland, and green forest can sit close together. Farther inland, yellow cropland and lighter pasture or hay colors interrupt the forest. These transitions are useful when the goal is to explain landscape variety rather than simply identify the largest class.
Developed Cover and Impervious Surface Measure Different Things
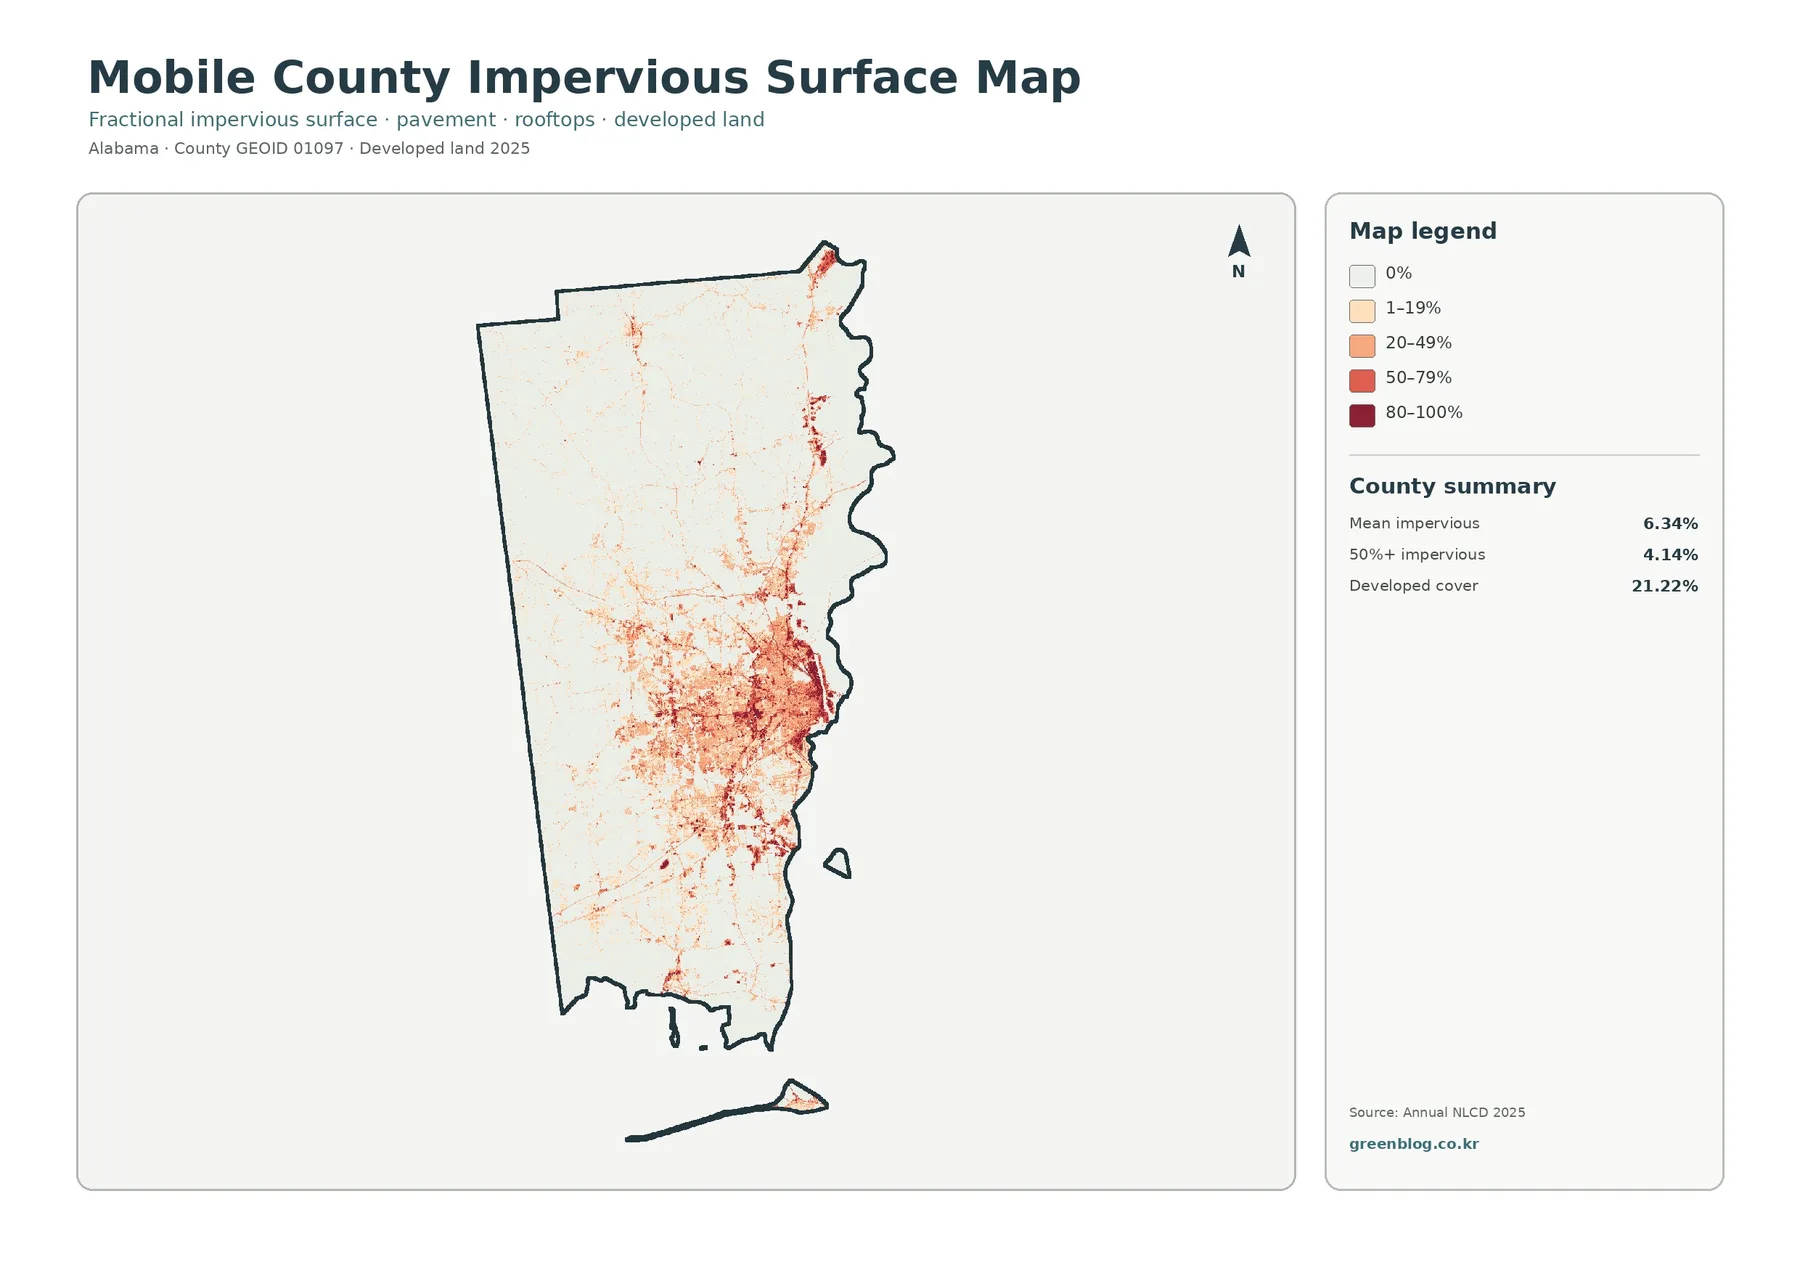
Developed land represents 21.22% of Mobile County in the 2025 summary. On the general map, its strongest concentration occupies much of the central-to-southeastern area, with additional developed patches toward the north and south. The county’s official profile lists eleven municipalities, including Mobile, Prichard, Saraland, Satsuma, Semmes, Bayou La Batre, and Dauphin Island. That municipal context is useful because the developed pattern should not be reduced to a single isolated town.
The impervious-surface map asks a narrower question. Impervious surface means roofs, pavement, parking areas, and similar surfaces that do not readily absorb rainfall. The countywide mean impervious value is 6.34%, and 4.14% of the county is mapped at 50% or more impervious. Those values are much lower than the 21.22% developed-cover share because a developed area can still contain lawns, trees, soil, drainage areas, and other surfaces that allow water to infiltrate.
The darkest impervious classes form a large concentration in the central-southeastern part of the county. Smaller high-value areas appear farther north and south, while thin lines extend outward through otherwise pale areas. The map does not label highways or municipal boundaries, so those lines should not be assigned to a specific road without another reference. What can be said directly is that impervious intensity is much higher in the main developed concentration than across the broad northern and western forested areas.
Mobile County Planning and Development describes its role in subdivision review, site-development permitting, right-of-way permitting, and land-disturbance permitting in unincorporated areas. The county also states separately that unincorporated Mobile County does not have general zoning. Those official notes are a useful reminder that a land-cover classification is not a regulatory map. The red and dark-red areas help show where built surfaces are concentrated, but they do not tell a property owner what development is permitted on a parcel.
Wetlands and Water Are Central to Reading the Mobile Bay Side
A quarter of the county is classified as wetland, so water-related cover should be treated as a major part of the landscape rather than an accessory feature. The map shows a broad wetland zone along much of the eastern side, plus additional wetland and water areas toward the south. Forest, developed land, and wetlands meet along irregular edges, creating a more complex pattern than a simple inland-versus-coast split.
The county’s official overview confirms that Mobile County lies beside Mobile Bay and the Gulf of Mexico. That geographic setting helps explain why coastal and estuarine cover types are prominent, but the land-cover map is not a nautical chart, flood map, or wetland delineation survey. It does not provide water depth, tide conditions, storm-surge limits, navigation channels, or a legal shoreline.
The 25.02% wetland value also should not be used as a count of legally regulated wetlands. Annual NLCD identifies land-cover classes from remotely sensed information at a generalized scale. A permit decision may require different datasets, agency review, and field evidence. The county map is best used to understand broad environmental setting and to identify where further detailed information might be useful.
This distinction becomes especially important where wetland, water, and developed cover touch one another. A few raster cells can create a sharp-looking boundary on screen even though the real landscape has drainage features, vegetation transitions, small ditches, roads, and mixed surfaces. Reading the map at county scale keeps the interpretation aligned with what the data can actually support.
What the 1985–2025 Difference Map Can and Cannot Tell You
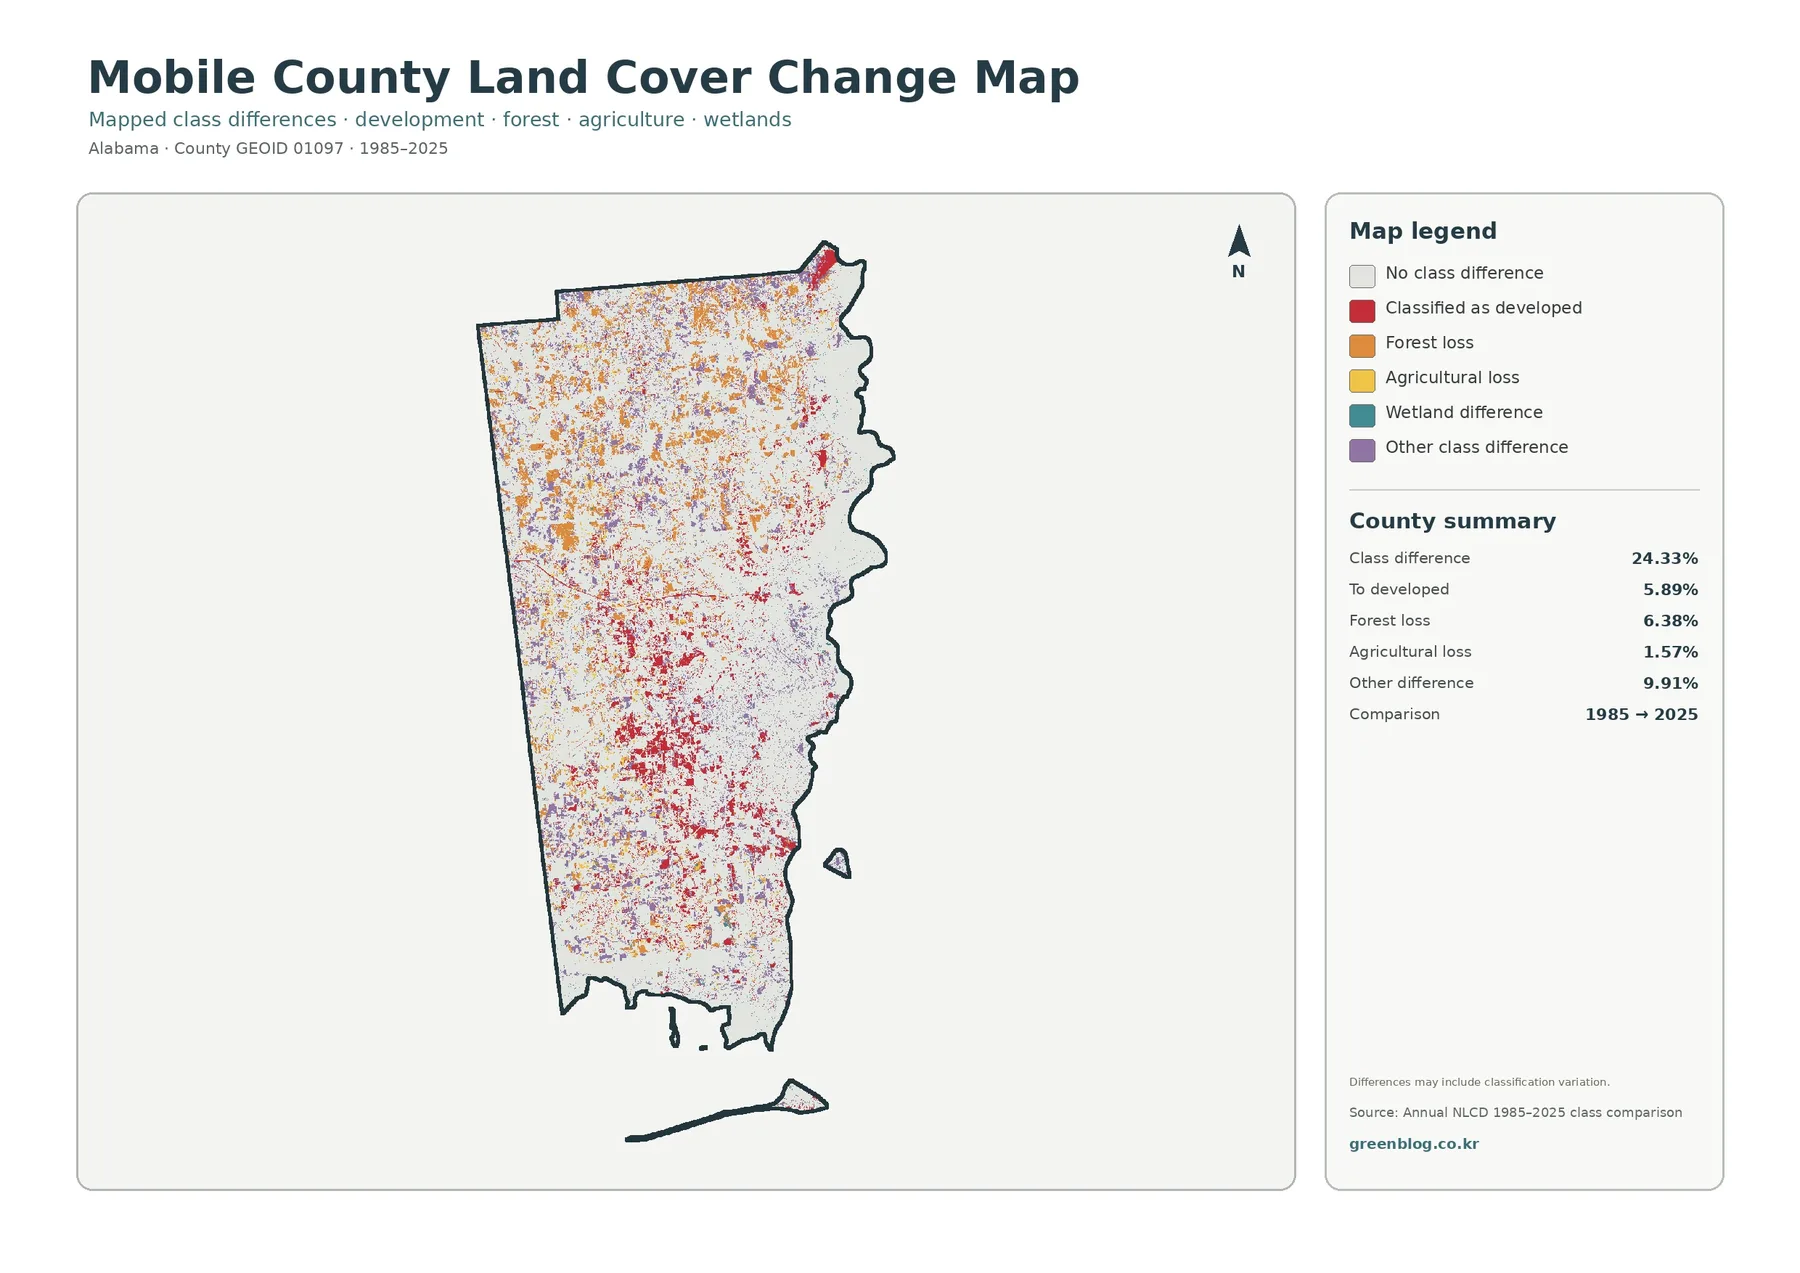
The change map compares the classifications at two endpoints, 1985 and 2025. It reports a total class difference of 24.33%. Within that total, 5.89% is shown as classified to developed, 6.38% as forest loss, 1.57% as agricultural loss, and 9.91% as other class difference. The legend also includes wetland difference as its own category, while unchanged areas remain light.
Red areas mapped as classified to developed are especially noticeable around the central and southeastern developed zone, with smaller patches and narrow features elsewhere. Orange forest-loss pixels are more widely scattered across the county, including many northern and western areas. Purple other-difference pixels are also distributed broadly. The result is not a single wave of change moving in one direction; it is a mixture of different class changes across several landscape settings.
The map includes an important warning that differences may include classification variation. Remote-sensing conditions, mixed pixels, changes in classification performance, and small shifts along water or wetland edges can produce different labels between years even when the real-world change is limited. For that reason, 24.33% should not be described as 24.33% of the county having changed legal land use.
Two endpoints also do not reveal the exact timing or sequence of change. A place could have been cleared, regrown, farmed, or redeveloped between 1985 and 2025 without that full history appearing in the endpoint comparison. The difference map is most useful for finding areas that deserve a closer look. Annual maps, aerial imagery, local records, and field information are better tools when the timing and cause of change matter.
How to Use the Four Views Without Mixing Their Meanings
For a first look at Mobile County, start with the general land-cover map. It combines the major classes and makes the county’s three-way balance of forest, wetlands, and development immediately visible. It is the most useful image when the question is simply where the main types of surface cover occur and which ones occupy the largest shares.
The forest-and-farmland map is better when the subject is rural land or environmental setting. By muting much of the developed and other cover, it makes the western agricultural patches, northern and western forest, and eastern wetland zone easier to compare. It also keeps open water, grassland, and shrubland visible so the rural landscape is not reduced to just forest versus crops.
Choose the impervious-surface map when the question involves built surfaces rather than the broader developed-land class. It distinguishes low-intensity and high-intensity impervious areas and shows why a county can have 21.22% developed cover while its mean impervious value is only 6.34%. The two measures answer different questions and should not be substituted for each other.
Use the 1985–2025 difference map only after understanding the 2025 map. Knowing the current location of forest, wetland, development, agriculture, and water makes the change colors easier to interpret. If the difference map is viewed alone, a heavily colored area can be mistaken for a current land-cover class when it actually represents a difference between two classifications.
Raster Cells Are Useful for County Patterns, Not Property Boundaries
Annual NLCD is a raster dataset, meaning the landscape is divided into small grid cells and each cell receives a representative class or value. A real location can contain trees, lawn, roof, pavement, water, and bare soil within a small area, but the map cannot preserve every tiny boundary. This is why land-cover edges can look cleaner on the screen than they do on the ground.
Coastal Mobile County is a good place to keep that limitation in mind. Wetland and water boundaries can be intricate, and the interface between developed land and natural cover can include canals, drainage areas, roads, vegetation strips, and mixed surfaces. A cell near one of those edges may represent the dominant signal rather than every feature inside it. Zooming in does not turn a generalized cell into a surveyed property line.
The 2025 map is also a dated classification, not a live view. Construction, vegetation change, restoration, clearing, and coastal processes can alter local conditions after the observation period. Current permit, engineering, or property work should use up-to-date county GIS, planning records, aerial photography, and the appropriate agency datasets. The land-cover maps remain valuable for countywide context and consistent comparison.
Percentages should be read as area summaries rather than importance rankings. A 2.85% water share can still matter greatly because of where the water is located, and a 21.22% developed share can contain a large portion of the county’s homes, businesses, and infrastructure. The map tells how much surface is classified into each type and where it appears; it does not assign ecological, economic, or legal value to those classes.
Download the Four Original Mobile County JPG Maps
The ZIP below contains the original JPG files for the general land-cover map, forest-and-farmland map, impervious/developed-land map, and 1985–2025 change map. Each image is 2480 × 1754 pixels and is kept at its original source resolution. The package is not marked as meeting the A3 high-resolution reference used for some other map sets, so test the legend and label readability before using it for a large-format print. For documents, offline reference, or archiving, use the JPGs rather than saving the smaller WebP previews from the page.
Frequently Asked Questions
What is the largest land-cover class in Mobile County in 2025?
Forest is the largest class at 32.57%. Wetlands account for 25.02%, developed land 21.22%, and agriculture 10.69%. These are surface-cover classifications, not ownership or legal land-use percentages.
Does the 25.02% wetland share mean all of it is the Mobile-Tensaw Delta?
No. Outdoor Alabama confirms that the Mobile-Tensaw Delta WMA extends into Mobile and Baldwin counties, but this land-cover map does not show the management or legal boundary of that area. Teal cells represent NLCD wetland classification.
Why is developed cover 21.22% while mean impervious surface is only 6.34%?
Developed areas can include lawns, trees, soil, drainage spaces, and other permeable surfaces. Impervious mapping focuses on roofs, pavement, parking areas, and similar surfaces, so the two measures are not expected to match.
Does 24.33% class difference mean 24.33% of the county changed land use?
No. The difference map can include real cover change as well as classification variation between the two dates. Parcel-level or causal conclusions require additional annual imagery, local records, or field information.
What files are included in the download?
The ZIP contains four original 2480 × 1754 JPGs: general land cover, forest/farmland, impervious/developed land, and the 1985–2025 change map. GIS layers and parcel boundaries are not included.
Map File Information
The ZIP contains the four original Mobile County JPG maps for land cover, forest/farmland, impervious/developed land, and 1985–2025 land-cover differences.
- Included Files: General land cover, forest/farmland, impervious/developed land, and change maps
- Printable Size: 2480 × 1754 pixels each
Related Maps
- Autauga County Alabama Land Cover Map
- Baldwin County Alabama Land Cover Map
- Barbour County Alabama Land Cover Map
Sources and Reference Material
The land-cover percentages, impervious summaries, and 1985–2025 difference values in this article come from the four supplied Mobile County maps based on Annual NLCD. The county’s coastal setting, municipal context, planning responsibilities, and Mobile-Tensaw Delta background were checked against the official or trusted references below. These sources serve different purposes and should not be treated as interchangeable boundary or regulatory datasets.
- MRLC Annual NLCD Data — access to Annual NLCD land-cover data and related products
- USGS Annual NLCD Land Cover Classification — definitions for forest, developed, agriculture, wetlands, and other classes
- Mobile County official overview — southwest Alabama location, Mobile Bay and Gulf adjacency, and municipal context
- Mobile County Planning and Development — subdivision, site-development, right-of-way, and land-disturbance responsibilities
- Mobile County Development and Zoning — official explanation of development and zoning in unincorporated Mobile County
- Outdoor Alabama Wildlife Management Areas — regional reference for the Mobile-Tensaw Delta WMA in Mobile and Baldwin counties
- U.S. Census Bureau TIGER/Line Shapefiles — official county-boundary documentation
Green Map creates custom-edited map images using open geographic data sources such as geoBoundaries, Natural Earth, OpenStreetMap, and government open data.
These maps are edited visual materials, not raw data files, and are provided for education, documents, presentations, and graphic reference.