A South Carolina Map becomes most useful when it makes all 46 counties readable across a state that narrows toward the northwest and opens onto a detailed Atlantic coastline. The supplied collection uses one consistent county framework in three treatments: pastel color, labeled black and white, and an unlabeled outline. Together they support county reference, printing, classroom recall, presentations, and carefully sourced annotations.
The labeled versions identify counties rather than cities. “Charleston,” for example, names Charleston County through an external leader line; it is not a separate point marking the city. Columbia is the state capital, but no city symbol appears inside Richland County, and Greenville is printed as a county name rather than a city marker. This distinction prevents the artwork from being mistaken for a municipal or travel map.
Every supplied South Carolina Map preview measures 1,200 × 1,018 pixels and uses a near-square landscape-friendly composition. The download information confirms JPG files prepared for high-resolution A3 printing. Because small coastal shapes and rotated county names are sensitive to reduction, users should preserve the original proportions and check one sample at the intended output size.
The maps concentrate on South Carolina alone. North Carolina and Georgia are not named, and the Atlantic Ocean is not labeled; exterior space is simply gray. Roads, rivers, county seats, city networks, elevation, scale, and coordinates are also absent. The result is a clean county-boundary resource rather than an atlas, navigation product, or physical-geography map.
Table of Contents
South Carolina Map Overview
South Carolina’s 46 counties are all functioning governmental units, but their shapes form several distinct visual patterns. The Upstate corner begins with Oconee at the far west, followed by Pickens, Greenville, Anderson, Spartanburg, Cherokee, and York. Their arrangement produces the state’s narrower northwestern end before the outline stretches eastward.
The central belt is more tightly interlocked. Laurens, Newberry, Fairfield, Kershaw, Richland, Lexington, Sumter, and neighboring counties create an irregular network rather than a simple grid. Richland’s long north–south form sits near the center, while Lexington meets it from the west. The images do not identify Columbia, so a capital-location exercise needs a separate verified point.
Along the east and northeast, Horry occupies the large corner near the coast, with Dillon and Marion inland and Georgetown below. Farther south, Berkeley, Charleston, Dorchester, Colleton, Beaufort, and Jasper surround a much more intricate shoreline. A South Carolina Map needs extra white space here because islands, inlets, and narrow coastal edges leave less room for labels than the inland counties.
Several labels rotate or use special placement to fit their county shapes. Greenville, Greenwood, McCormick, and Dorchester run diagonally or vertically, while Charleston is placed outside the county with a line pointing toward the coastal area. These choices are practical typographic solutions; they do not indicate routes, directions of travel, or regional boundaries.
The map also supports a cautious Upstate-to-coast comparison, but it does not draw formal region lines. Terms such as Upstate, Midlands, Pee Dee, and Lowcountry are useful geographic descriptions whose boundaries can vary by purpose. County outlines remain the only explicit administrative divisions in the supplied artwork.
Color County Map for Regional Comparison
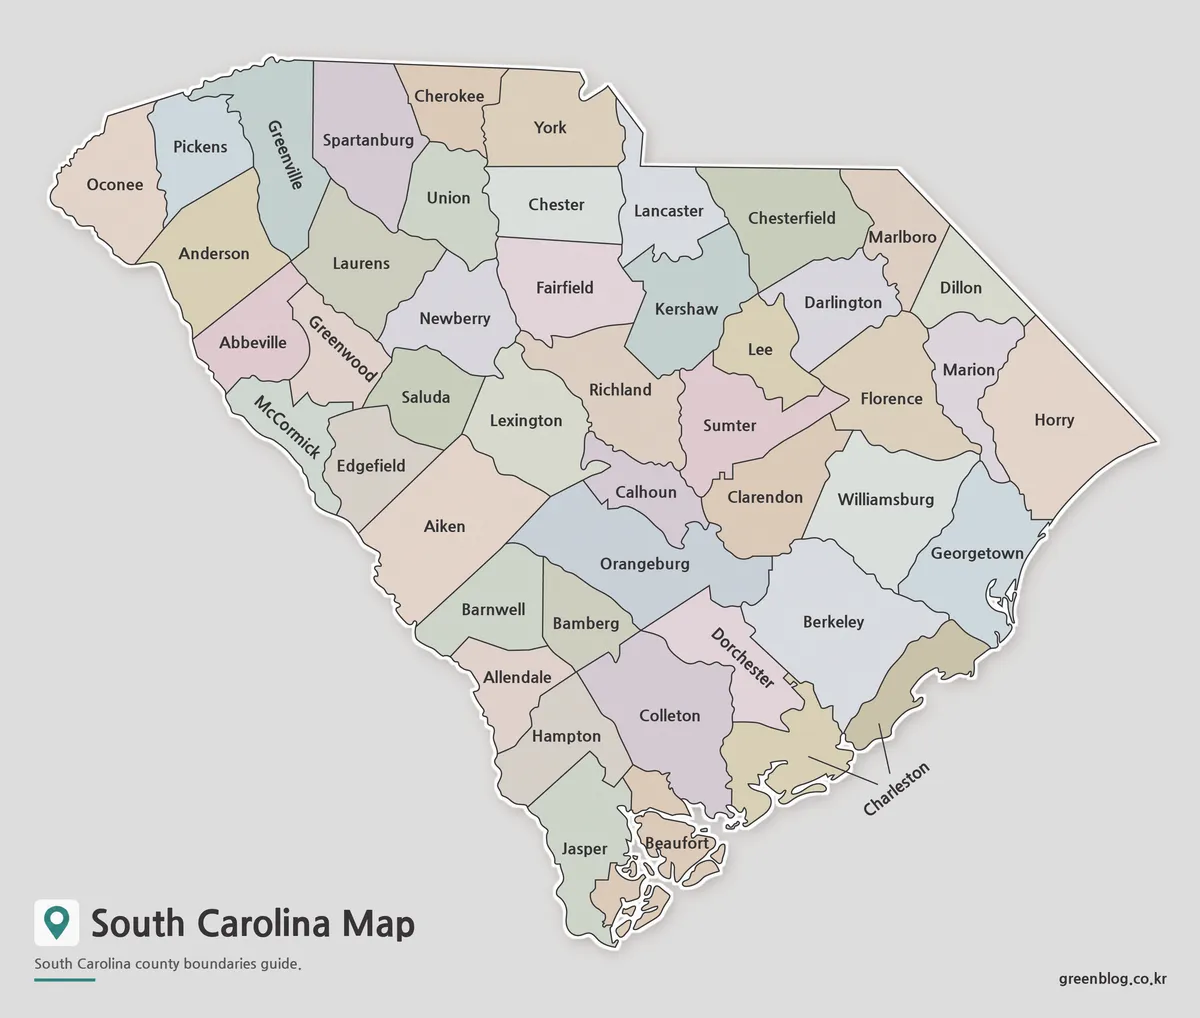
The color South Carolina Map assigns neighboring counties different pale fills, making shared borders easier to follow without overpowering the labels. This is especially helpful through the central cluster around Richland, Lexington, Calhoun, Sumter, Clarendon, and Orangeburg. It also separates compact western counties such as Abbeville, Greenwood, McCormick, and Edgefield.
The colors are decorative, not thematic. They do not encode population, election results, climate, economic regions, or official planning districts. A presentation can use this version for immediate county separation, but any data project should apply a purposeful palette and include a legend, source, and reference date.
Coastal geometry remains the most visually demanding part of the page. Beaufort County includes island and water-edge detail, Charleston County extends along a complex shore, and Georgetown reaches the coast below Horry. The pastel treatment lets viewers distinguish those areas while the gray exterior keeps attention on the state.
Black and White Printable Version
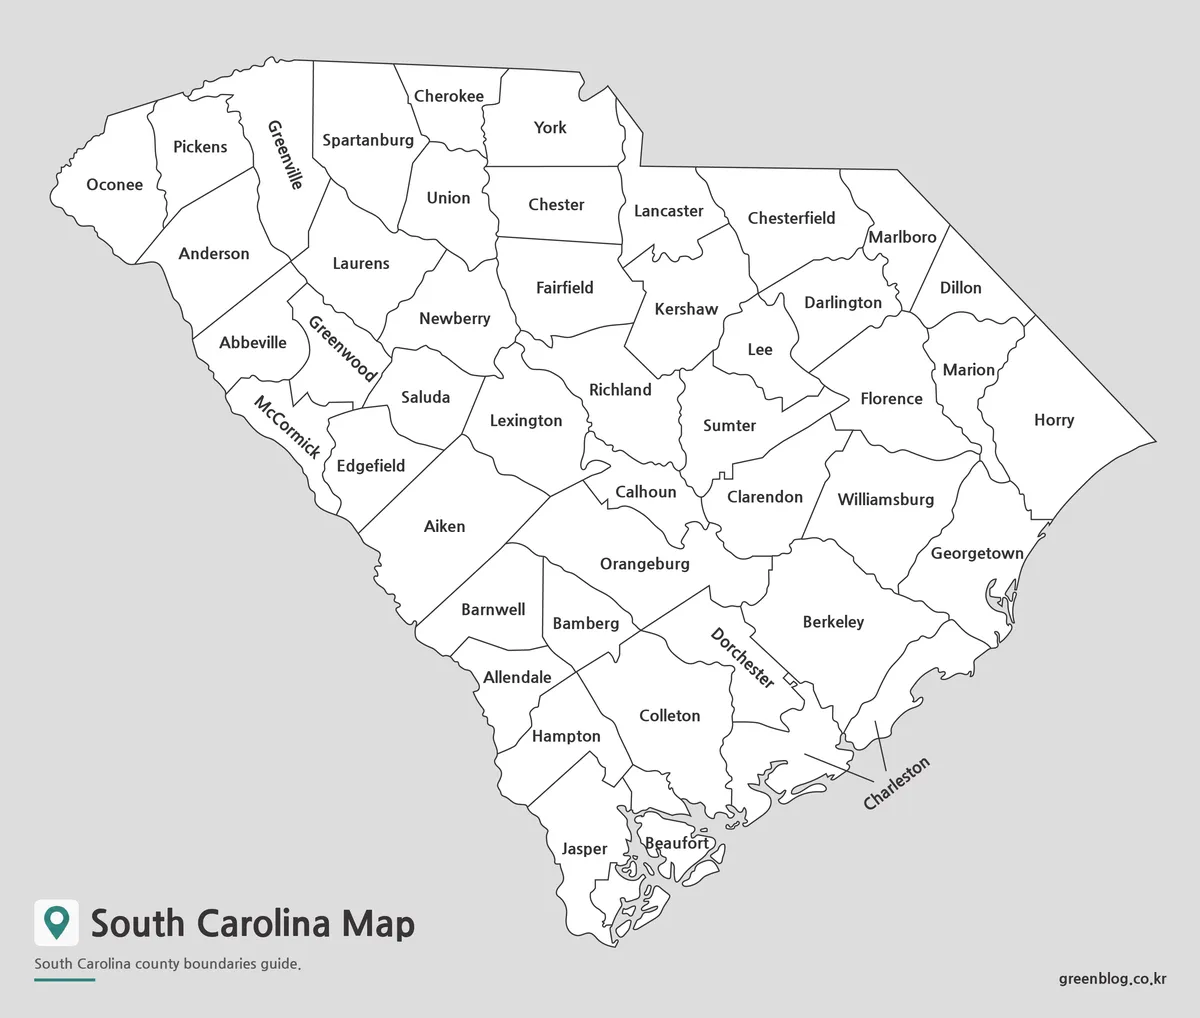
The black-and-white South Carolina Map removes the pastel interiors while retaining every county name, the internal boundaries, the state outline, and the coastal detail. Dark text becomes the main information layer. A soft edge treatment still separates the state from the gray background, so this is a restrained reference graphic rather than a bare GIS line export.
Use this edition when a labeled answer key must sit beside a worksheet or when a report already has its own color scheme. White interiors leave room for circles, underlines, or a few symbols. Heavy shading may cover smaller names, so a project requiring full-county fills is better built from the blank outline.
Print size matters around narrow and angled labels. McCormick, Greenwood, Dorchester, and Charleston are less tolerant of aggressive reduction than large horizontal names such as Horry or Orangeburg. Keep the map wide enough that the county lettering stays distinct from the border lines, and test the coastal callout before producing a class set.
Blank Outline Map for Editing
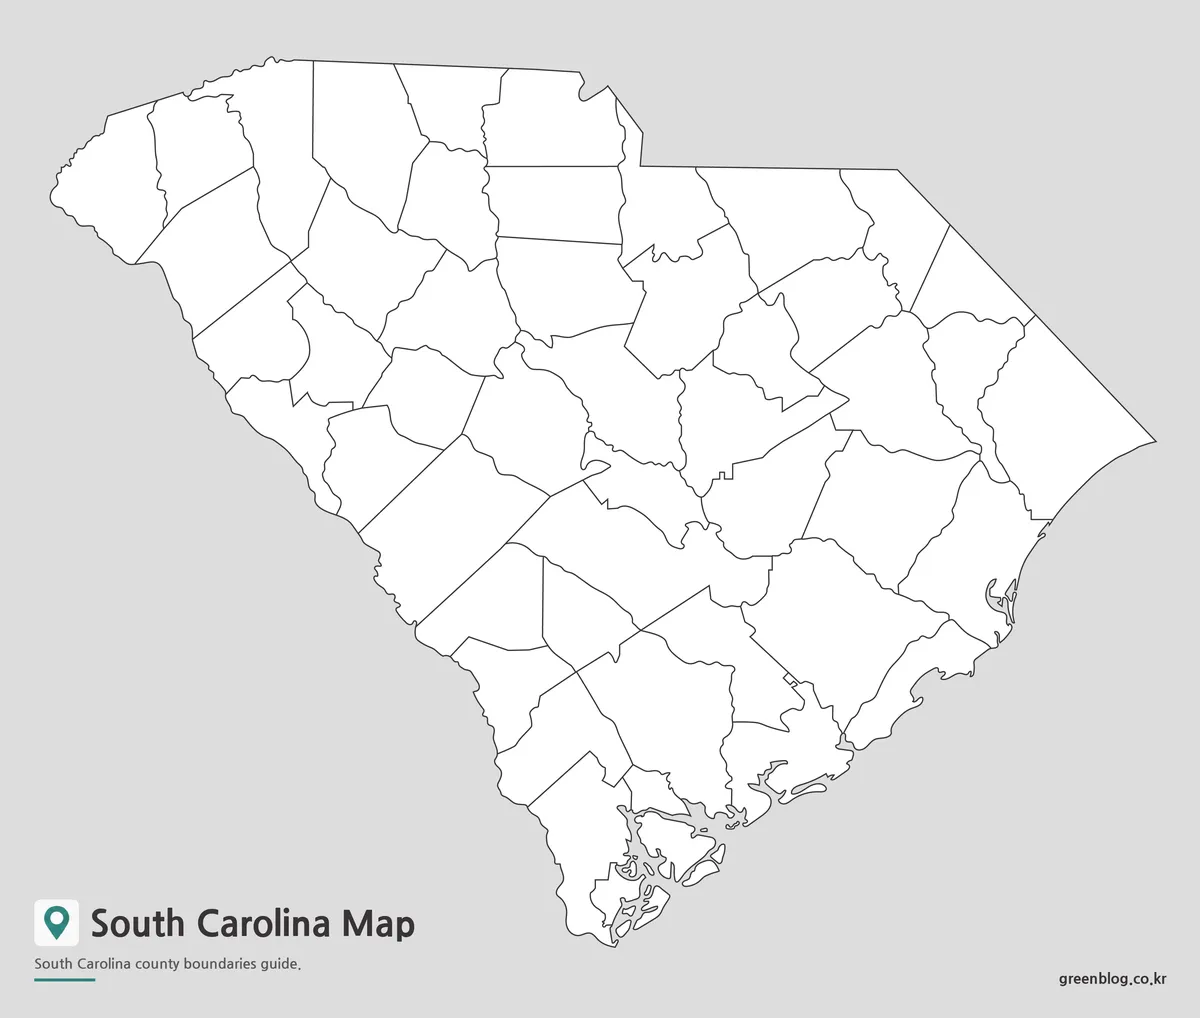
The blank South Carolina Map removes county names and fills while preserving the 46-county network, exterior shape, and coastal islands. Learners can label counties from memory, identify the counties touching Georgia or North Carolina with a separate reference, or compare the compact Upstate pattern with the coastal counties. The empty page also provides room for a project title and legend.
A thematic project can shade counties using verified statistics, but the source values should not be inferred from area size. A large shape such as Horry does not automatically represent the largest population or any other ranking. Add a legend, data year, and source whenever color or symbols convey more than location.
The JPG is an annotation base, not an editable vector source or GIS dataset. It can be placed in presentation and graphics software as an image, yet its county lines cannot provide authoritative measurements. Legal, electoral, emergency, or current boundary work should use the responsible government source.
Practical Uses for This Map Collection
A three-step classroom sequence can begin with the color reference, move to the monochrome answer sheet, and finish with the blank outline. Students might locate the northwestern sequence from Oconee to York, trace the central counties around Richland, or identify Horry, Georgetown, Charleston, Beaufort, and Jasper along the coast.
For presentations, a South Carolina Map can introduce the county framework before a chart or table focuses on selected areas. The color version suits quick orientation, monochrome supports a written report, and the outline accepts sourced values or project markers. If city locations are needed, add them from a reliable source because none of the three maps plots municipalities.
Preserve an untouched master file and annotate a duplicate. Keep the 1,200 × 1,018 proportion when resizing, and avoid cropping the western tip or the coastal islands. For A3 output, use the confirmed high-resolution JPG from the ZIP rather than enlarging a compressed page screenshot.
Frequently Asked Questions
Does this South Carolina Map include county boundaries?
Yes. The map is based on South Carolina’s 46 county boundaries.
Can I print the map in A3 size?
Yes. The files are prepared for high-resolution A3 printing.
Which version is best for classroom use?
The black and white labeled map is best for printing, while the outline map works well for worksheets.
Is the outline map editable?
Yes. The blank outline version is useful for adding colors, icons, notes, and custom labels.
What file format is included?
The confirmed file format is JPG.
The protected archive contains the matching color, labeled monochrome, and blank-outline JPG versions. Choose the file according to whether the task requires immediate county separation, a readable name reference, or an empty base for recall and annotation.
Map File Information
The archive provides three matching 46-county views for A3 printing, reference, lessons, presentations, and annotation.
- Included Versions: Color labeled map · Black-and-white labeled map · Blank outline map
- Printable Size: A3 high-resolution layout
- File Type: JPG files in a ZIP archive
- Intended Use: County reference · worksheets · slides · custom overlays
Related Maps
Additional Resources
- South Carolina State Library: Counties — The official state guide provides an index to all 46 counties and links to county histories, cities, and towns.
Green Map creates custom-edited map images using open geographic data sources such as geoBoundaries, Natural Earth, OpenStreetMap, and government open data.
These maps are edited visual materials, not raw data files, and are provided for education, documents, presentations, and graphic reference.