World Bank indicator SE.SEC.TCAQ.LO.ZS measures the percentage of lower-secondary teachers who have received the minimum organized teacher training required for teaching in their country. Training can be pre-service or in-service. The latest non-empty file contains 130 observations, but only 8 are from 2025. The largest recent same-year group is 2024 with 37 economies, so the main cross-country comparison uses 2024.
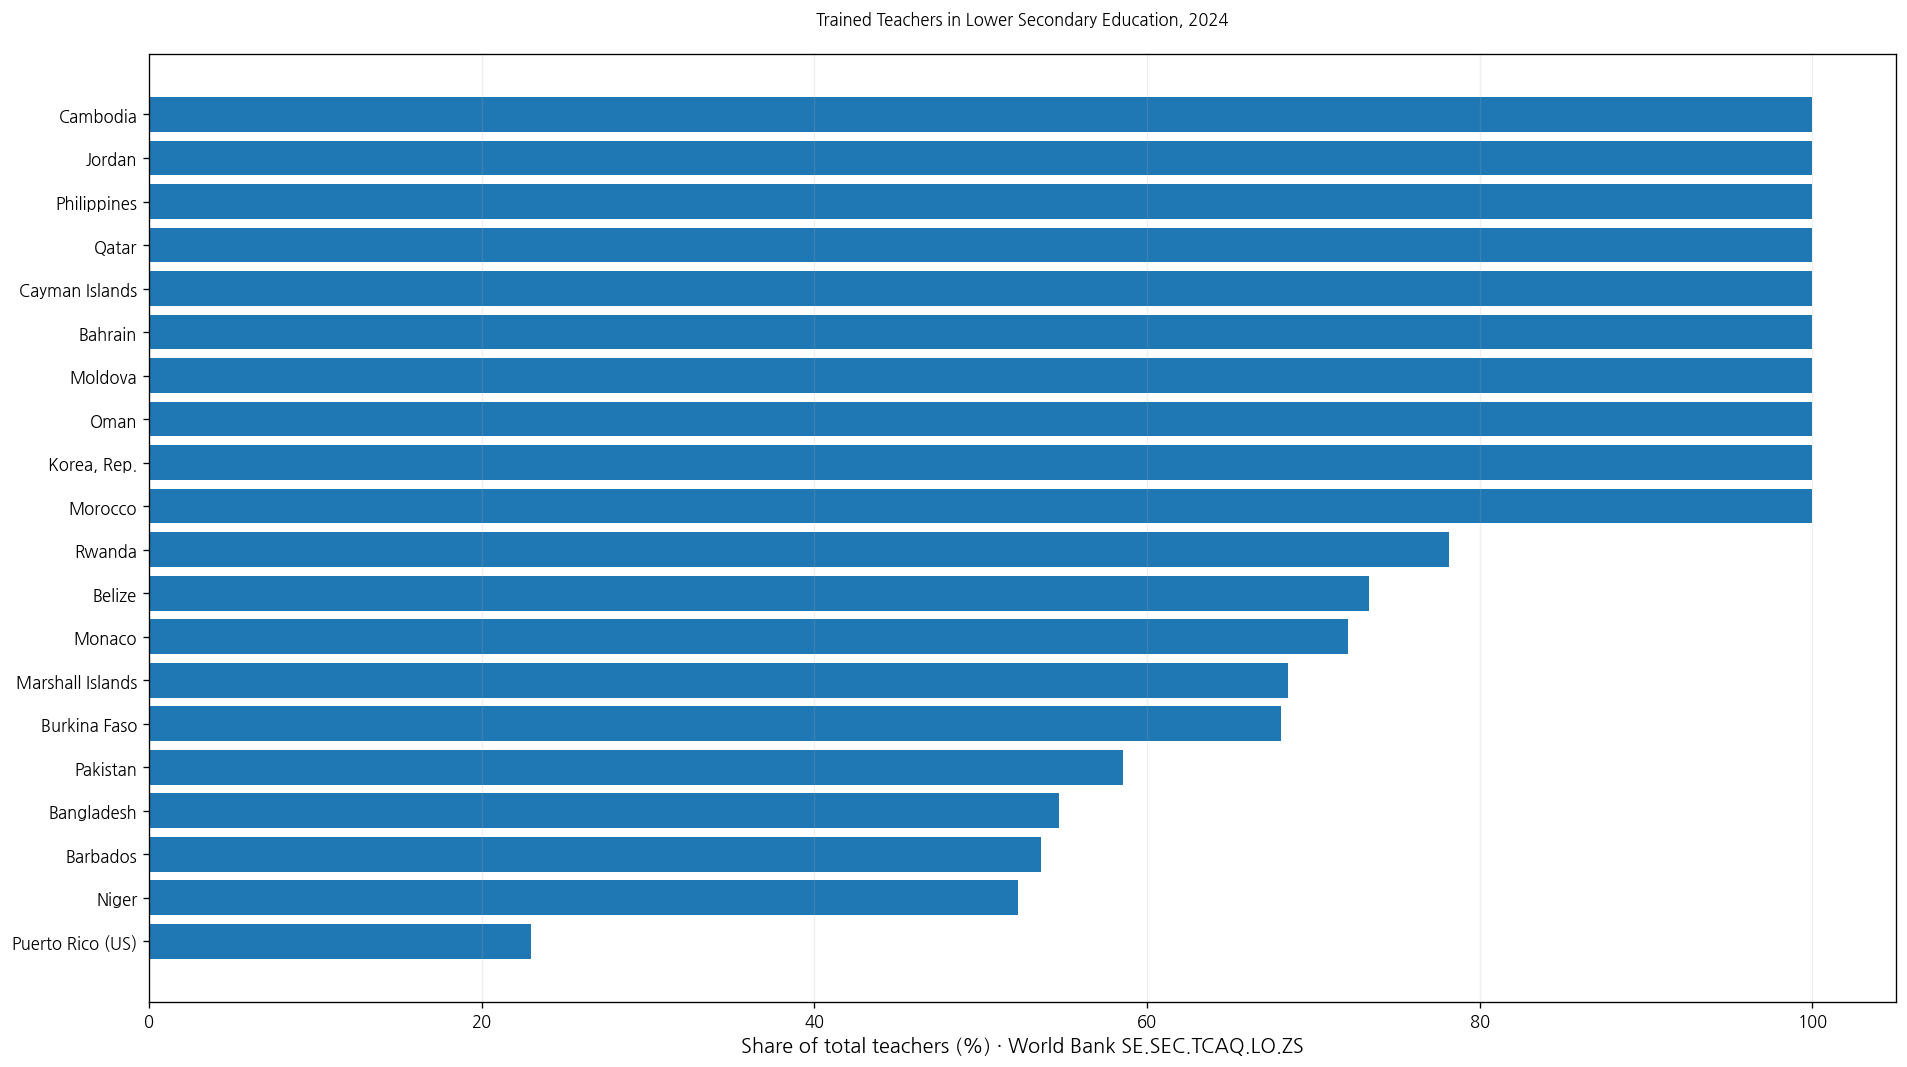
Table of Contents
What ‘trained teachers’ means
In this indicator, trained teachers are teachers who have received the minimum organized training required to teach at the lower-secondary level in the reporting country. That preparation can occur before entering the profession or through recognized in-service training.
The indicator is therefore about whether teachers meet a formal training threshold, not about years of experience, university education in general, or a direct test of classroom skill.
It is not necessarily identical to teacher certification
Teacher training and formal licensing or certification are closely related in many systems, but they are not guaranteed to be identical. Countries can use different combinations of degrees, training programs, examinations, experience, and licensing rules.
For that reason, the series should retain its original meaning—minimum organized teacher training—rather than being relabeled as a universal teacher-license rate.
The 2024 mean is 85.60% and the median is 93.24%
The 2024 subset contains 37 economies. Its mean is 85.60% and median 93.24%. The first quartile is 78.13% and the third quartile 100.00%, putting the middle half roughly between 78.13% and 100%.
20 economies are at or above 90%, 28 are at or above 75%, and 9 are below 75%. Only 1 economy is below 50%. Twelve economies report exactly 100%.
Twelve economies report 100% in 2024
The 2024 data contain a broad tie at the upper bound. Bahrain, Cayman Islands, Jordan, Cambodia, Moldova, Morocco, Oman, Philippines, Qatar, Saudi Arabia, San Marino, and another reporting economy record 100%.
| 2024 high-order position | Economy/territory | Trained lower-secondary teachers |
|---|---|---|
| 1 | Bahrain | 100.00% |
| 2 | Cayman Islands | 100.00% |
| 3 | Jordan | 100.00% |
| 4 | Cambodia | 100.00% |
| 5 | Korea, Rep. | 100.00% |
| 6 | Morocco | 100.00% |
| 7 | Moldova | 100.00% |
| 8 | Oman | 100.00% |
| 9 | Philippines | 100.00% |
| 10 | Qatar | 100.00% |
| 11 | Saudi Arabia | 100.00% |
| 12 | San Marino | 100.00% |
| 13 | Turkmenistan | 99.30% |
| 14 | Azerbaijan | 99.05% |
| 15 | Belarus | 98.56% |
| 16 | El Salvador | 96.49% |
| 17 | Namibia | 95.59% |
| 18 | Macao SAR, China | 95.11% |
| 19 | Viet Nam | 93.24% |
| 20 | Malaysia | 91.72% |
A 100% value means all teachers covered by the reported statistic met the country’s minimum training requirement. It does not mean every teacher has identical expertise, that training programs are equally demanding across countries, or that all students receive the same quality of instruction.
Puerto Rico (US) is lowest in 2024 at 22.98%
At the lower end, Puerto Rico (US) records 22.98%, followed by Niger at 52.22%, Barbados at 53.62%, Bangladesh at 54.69%, Pakistan at 58.57%, Burkina Faso at 68.03%, and Marshall Islands at 68.50%.
| 2024 low-order position | Economy/territory | Trained lower-secondary teachers |
|---|---|---|
| 1 | Puerto Rico (US) | 22.98% |
| 2 | Niger | 52.22% |
| 3 | Barbados | 53.62% |
| 4 | Bangladesh | 54.69% |
| 5 | Pakistan | 58.57% |
| 6 | Burkina Faso | 68.03% |
| 7 | Marshall Islands | 68.50% |
| 8 | Monaco | 72.11% |
| 9 | Belize | 73.35% |
| 10 | Rwanda | 78.13% |
| 11 | Ecuador | 80.71% |
| 12 | Sierra Leone | 80.90% |
| 13 | Armenia | 84.92% |
| 14 | Egypt, Arab Rep. | 86.47% |
| 15 | Kiribati | 87.29% |
| 16 | Bahamas, The | 87.45% |
| 17 | Venezuela, RB | 88.30% |
| 18 | Malaysia | 91.72% |
| 19 | Viet Nam | 93.24% |
| 20 | Macao SAR, China | 95.11% |
A low rate means a smaller share of lower-secondary teachers met the country’s minimum training requirement. It may point to challenges in teacher preparation, recruitment, or access to in-service development, but this single percentage cannot establish the cause.
Minimum training standards can differ across countries
The largest comparability limitation is that the minimum training requirement is defined within each national education system. One country may require a full teacher-education degree, while another may recognize a shorter professional program or a particular in-service pathway.
A difference between 95% and 90% therefore should not automatically be read as a five-point difference in teacher quality. The indicator compares compliance with national training standards rather than a single globally identical curriculum.
A high trained-teacher rate does not guarantee high student achievement
Teacher preparation is an important input, but learning outcomes also depend on class size, instructional time, curriculum, materials, school leadership, attendance, household conditions, language of instruction, and many other factors.
The trained-teacher rate can be analyzed alongside reading or mathematics outcomes, but it should not be treated as a direct measure of student performance.
The percentage does not show the number of trained teachers
A percentage describes composition, not headcount. A large education system with an 80% trained-teacher rate can contain more trained teachers in absolute numbers than a small system reporting 100%.
Comparing teacher workforce size requires separate data on total teacher counts or student-teacher ratios.
Lower and upper secondary should remain separate
Lower secondary and upper secondary are distinct education stages. Subject specialization, staffing patterns, and qualification requirements can differ between them.
An upper-secondary trained-teacher indicator should therefore not be substituted for this lower-secondary series, even when the names look similar.
The 130 latest observations span 1998–2025
Of the 130 latest non-empty observations, 8 are from 2025, 37 from 2024, and 19 from 2023. Some final observations date back as far as 1998.
| Observation year | Economies/territories | Share of 130 |
|---|---|---|
| 2025 | 8 | 6.2% |
| 2024 | 37 | 28.5% |
| 2023 | 19 | 14.6% |
| 2022 | 10 | 7.7% |
| 2021 | 7 | 5.4% |
| 2020 | 5 | 3.8% |
| 2019 | 3 | 2.3% |
| 2018 | 3 | 2.3% |
| 2017 | 3 | 2.3% |
| 2016 | 3 | 2.3% |
| 2015 | 2 | 1.5% |
| 2013 | 2 | 1.5% |
| 2012 | 9 | 6.9% |
| 2011 | 3 | 2.3% |
| 2010 | 3 | 2.3% |
| 2009 | 3 | 2.3% |
| 2008 | 2 | 1.5% |
| 2004 | 2 | 1.5% |
| 2003 | 3 | 2.3% |
| 2002 | 1 | 0.8% |
| 2000 | 1 | 0.8% |
| 1998 | 1 | 0.8% |
The complete file therefore should not be presented as a 130-economy 2025 ranking. The 37 observations dated 2024 provide the strongest recent same-year comparison, while the full table is an inventory of each economy’s latest available value.
Old latest observations may not represent today’s teacher workforce
Teacher-training systems can change through reforms, new licensing rules, recruitment drives, and expansion of professional development. A final observation from the 2000s or 1990s may be historically valid but not representative of the current workforce.
Observation year is therefore essential context whenever the full latest-value file is used.
This percentage has a natural upper bound of 100%
The denominator is total lower-secondary teachers and the numerator is the subset meeting the minimum training requirement. The indicator is therefore normally interpreted between 0% and 100%.
Unlike some gross enrollment ratios that can exceed 100% because of age and enrollment definitions, this trained-teacher share has a clear compositional ceiling.
Complete list of the 130 latest observations
The table below lists each economy and territory’s latest non-empty observation alphabetically. The year should be read together with the percentage because the observations are not from one common year.
| Economy/territory | Observation year | Trained lower-secondary teachers |
|---|---|---|
| Albania | 2021 | 70.55% |
| Andorra | 2012 | 100.00% |
| Angola | 2023 | 87.59% |
| Antigua and Barbuda | 2010 | 38.21% |
| Armenia | 2024 | 84.92% |
| Azerbaijan | 2024 | 99.05% |
| Bahamas, The | 2024 | 87.45% |
| Bahrain | 2024 | 100.00% |
| Bangladesh | 2024 | 54.69% |
| Barbados | 2024 | 53.62% |
| Belarus | 2024 | 98.56% |
| Belize | 2024 | 73.35% |
| Benin | 2000 | 39.21% |
| Bermuda | 2016 | 100.00% |
| Bhutan | 2023 | 100.00% |
| Botswana | 2022 | 99.99% |
| Brazil | 2020 | 76.62% |
| British Virgin Islands | 2003 | 71.57% |
| Brunei Darussalam | 2023 | 89.14% |
| Burkina Faso | 2024 | 68.03% |
| Burundi | 2019 | 70.37% |
| Cabo Verde | 2022 | 70.16% |
| Cambodia | 2024 | 100.00% |
| Cameroon | 2023 | 61.82% |
| Cayman Islands | 2024 | 100.00% |
| Chad | 2022 | 79.22% |
| Colombia | 2022 | 97.77% |
| Comoros | 2011 | 77.89% |
| Congo, Rep. | 2012 | 47.90% |
| Costa Rica | 2020 | 96.76% |
| Croatia | 2003 | 100.00% |
| Cuba | 2023 | 100.00% |
| Cyprus | 2021 | 100.00% |
| Djibouti | 2023 | 71.01% |
| Dominica | 2016 | 48.38% |
| Dominican Republic | 2021 | 100.00% |
| Ecuador | 2024 | 80.71% |
| Egypt, Arab Rep. | 2024 | 86.47% |
| El Salvador | 2024 | 96.49% |
| Equatorial Guinea | 2015 | 11.19% |
| Eritrea | 2013 | 85.74% |
| Ethiopia | 2012 | 89.87% |
| Fiji | 2012 | 100.00% |
| Gambia, The | 2025 | 94.91% |
| Georgia | 2009 | 94.59% |
| Ghana | 2021 | 76.99% |
| Gibraltar | 2017 | 100.00% |
| Grenada | 2018 | 46.12% |
| Guinea | 2008 | 88.85% |
| Guyana | 2009 | 56.62% |
| Honduras | 2004 | 65.37% |
| India | 2025 | 91.67% |
| Indonesia | 2025 | 34.20% |
| Iran, Islamic Rep. | 2017 | 100.00% |
| Iraq | 2004 | 100.00% |
| Jordan | 2024 | 100.00% |
| Kenya | 2023 | 100.00% |
| Kiribati | 2024 | 87.29% |
| Korea, Rep. | 2024 | 100.00% |
| Kuwait | 2021 | 100.00% |
| Lao PDR | 2022 | 93.67% |
| Latvia | 2022 | 100.00% |
| Lebanon | 2023 | 40.40% |
| Lesotho | 2010 | 95.73% |
| Liberia | 2020 | 82.23% |
| Macao SAR, China | 2024 | 95.11% |
| Madagascar | 2019 | 21.86% |
| Malawi | 2023 | 78.73% |
| Malaysia | 2024 | 91.72% |
| Maldives | 2022 | 98.33% |
| Mali | 2023 | 44.28% |
| Marshall Islands | 2024 | 68.50% |
| Mauritania | 2020 | 93.01% |
| Mexico | 2012 | 90.65% |
| Micronesia, Fed. Sts. | 2023 | 23.89% |
| Moldova | 2024 | 100.00% |
| Monaco | 2024 | 72.11% |
| Mongolia | 2023 | 38.13% |
| Morocco | 2024 | 100.00% |
| Mozambique | 2013 | 85.24% |
| Myanmar | 2018 | 89.54% |
| Namibia | 2024 | 95.59% |
| Naoero | 2025 | 100.00% |
| Nepal | 2025 | 97.19% |
| Nicaragua | 2008 | 57.15% |
| Niger | 2024 | 52.22% |
| Nigeria | 2018 | 76.31% |
| Oman | 2024 | 100.00% |
| Pakistan | 2024 | 58.57% |
| Palau | 2023 | 95.12% |
| Panama | 2017 | 94.02% |
| Papua New Guinea | 2012 | 100.00% |
| Paraguay | 2012 | 85.91% |
| Philippines | 2024 | 100.00% |
| Portugal | 2020 | 100.00% |
| Puerto Rico (US) | 2024 | 22.98% |
| Qatar | 2024 | 100.00% |
| Rwanda | 2024 | 78.13% |
| San Marino | 2024 | 100.00% |
| Sao Tome and Principe | 2016 | 20.22% |
| Saudi Arabia | 2024 | 100.00% |
| Senegal | 2022 | 74.98% |
| Serbia | 2011 | 53.05% |
| Sierra Leone | 2024 | 80.90% |
| Slovak Republic | 2022 | 97.60% |
| Solomon Islands | 2019 | 93.92% |
| South Sudan | 2011 | 44.33% |
| Spain | 2023 | 100.00% |
| Sri Lanka | 2023 | 82.88% |
| St. Kitts and Nevis | 2012 | 53.33% |
| St. Lucia | 2023 | 69.86% |
| St. Vincent and the Grenadines | 2010 | 64.30% |
| Suriname | 2021 | 81.86% |
| Tajikistan | 2003 | 93.95% |
| Thailand | 2025 | 100.00% |
| Togo | 2021 | 37.90% |
| Tonga | 1998 | 90.85% |
| Trinidad and Tobago | 2009 | 40.38% |
| Tunisia | 2022 | 100.00% |
| Turkmenistan | 2024 | 99.30% |
| Turks and Caicos Islands | 2002 | 100.00% |
| Tuvalu | 2025 | 60.27% |
| United Arab Emirates | 2023 | 100.00% |
| United States | 2023 | 100.00% |
| Uzbekistan | 2025 | 100.00% |
| Vanuatu | 2015 | 21.47% |
| Venezuela, RB | 2024 | 88.30% |
| Viet Nam | 2024 | 93.24% |
| West Bank and Gaza | 2023 | 100.00% |
| Zambia | 2012 | 92.65% |
How to interpret the comparison
First, the measure concerns the minimum organized teacher training required nationally. Second, it is not necessarily identical to certification or licensing. Third, national training standards can differ, so small cross-country gaps should not be overinterpreted.
Fourth, the rate is not a direct measure of student achievement. Fifth, it does not show the absolute number of teachers. Sixth, the full 130-row file mixes years, so the main same-year comparison uses the 37 observations from 2024. Seventh, lower and upper secondary should remain separate.
Source and calculation
The source is World Bank World Development Indicators SE.SEC.TCAQ.LO.ZS, Trained teachers in lower secondary education (% of total teachers). The 2024 mean, median, quartiles, threshold counts, and rankings use only the 37 observations dated 2024. The complete table preserves all 130 latest non-empty observations.
Frequently Asked Questions
What does the trained-teacher rate mean?
It is the share of lower-secondary teachers who have completed the minimum organized teacher training required in their country.
What is the 2024 median?
The median across the 37 observations dated 2024 is 93.24%, while the mean is 85.60%.
Does 100% mean teacher quality is identical across countries?
No. National minimum training requirements can differ, so 100% means all teachers covered met their country's minimum standard.
Related Articles
Green Map creates custom-edited map images using open geographic data sources such as geoBoundaries, Natural Earth, OpenStreetMap, and government open data. These maps are edited visual materials, not raw data files, and are provided for education, documents, presentations, and graphic reference.