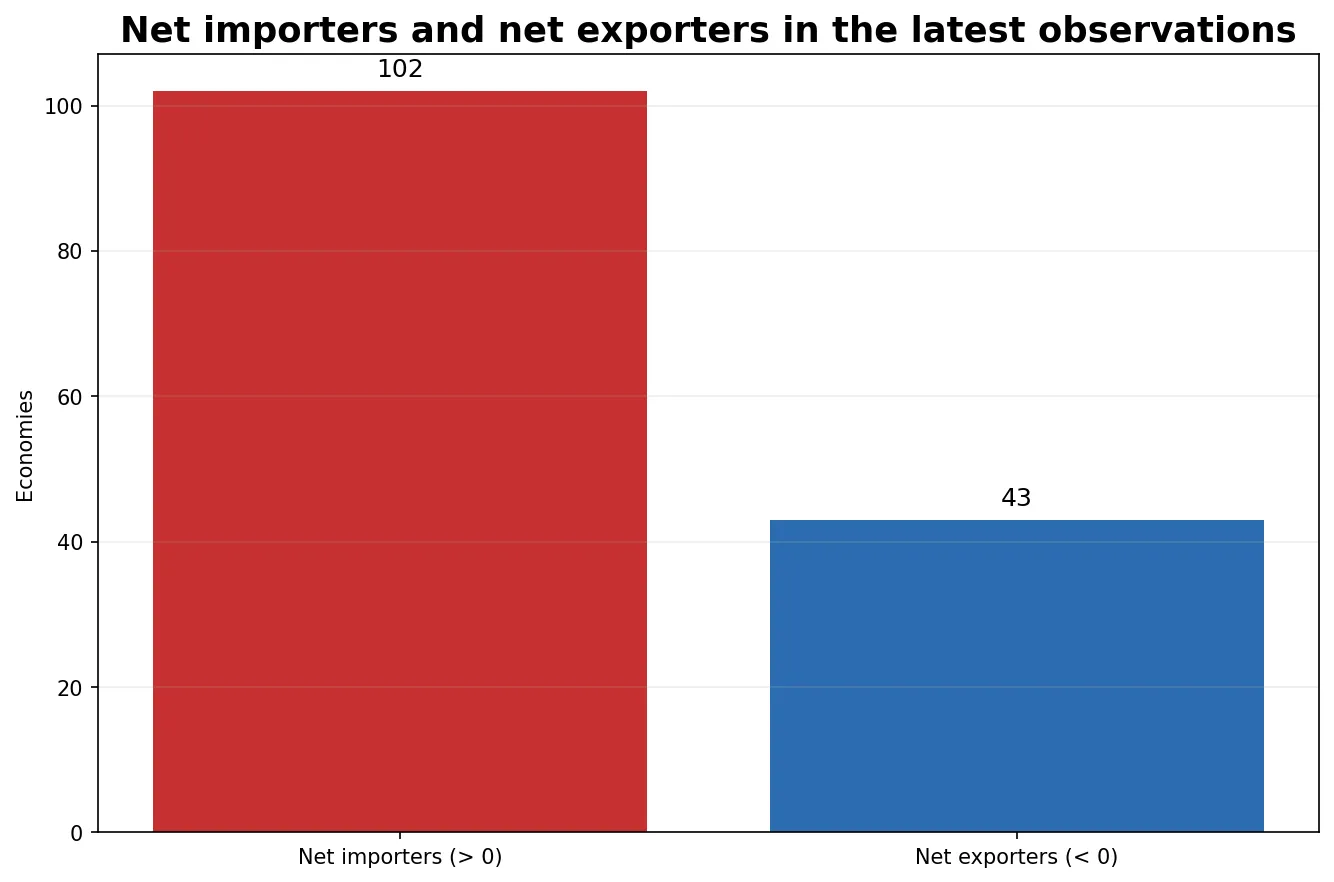
The World Bank indicator “Energy imports, net (% of energy use)” measures the balance between energy imports and exports relative to an economy’s primary-energy use. A positive value identifies a net importer; a negative value identifies a net exporter. The latest non-empty observation set used here contains 145 economies: 102 have positive values and 43 have negative values. The metric is best read as the scale of the net trade balance compared with domestic energy use, not as a simple count of imported fuels or a measure of energy spending.
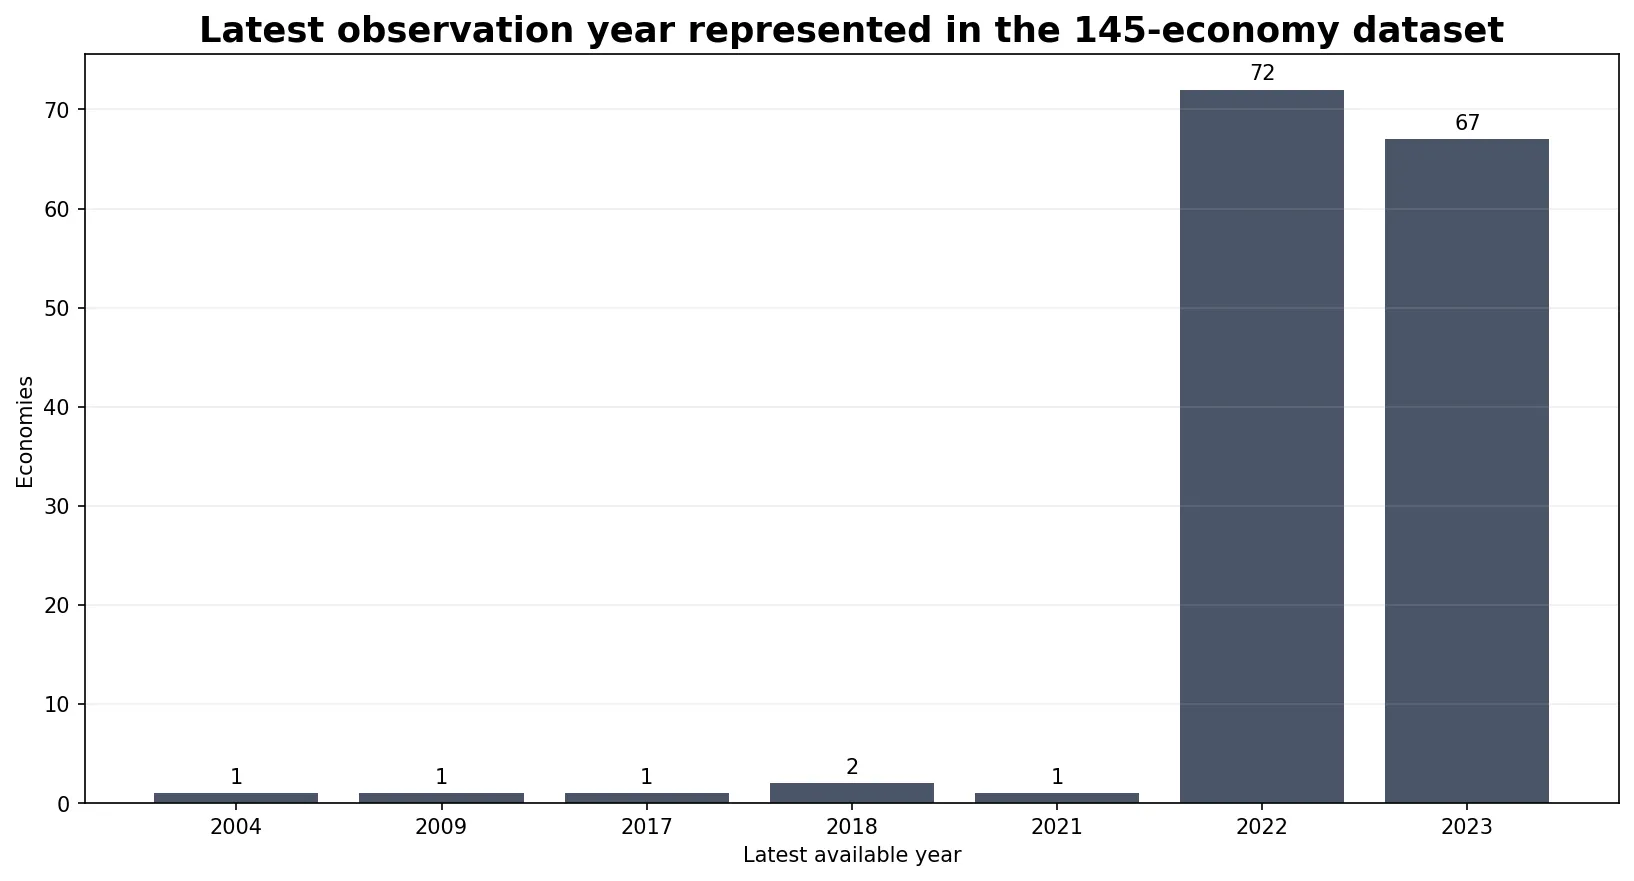
The observation year is not identical across countries. Sixty-seven economies have 2023 as their latest value and 72 have 2022, so 139 of 145 are concentrated in 2022–2023. Six are older: Cambodia is 2021, Curacao and Togo are 2018, Madagascar is 2017, Iceland is 2009, and Eritrea is 2004. The map therefore compares each economy’s latest available observation rather than pretending that all 145 values describe the same calendar year.
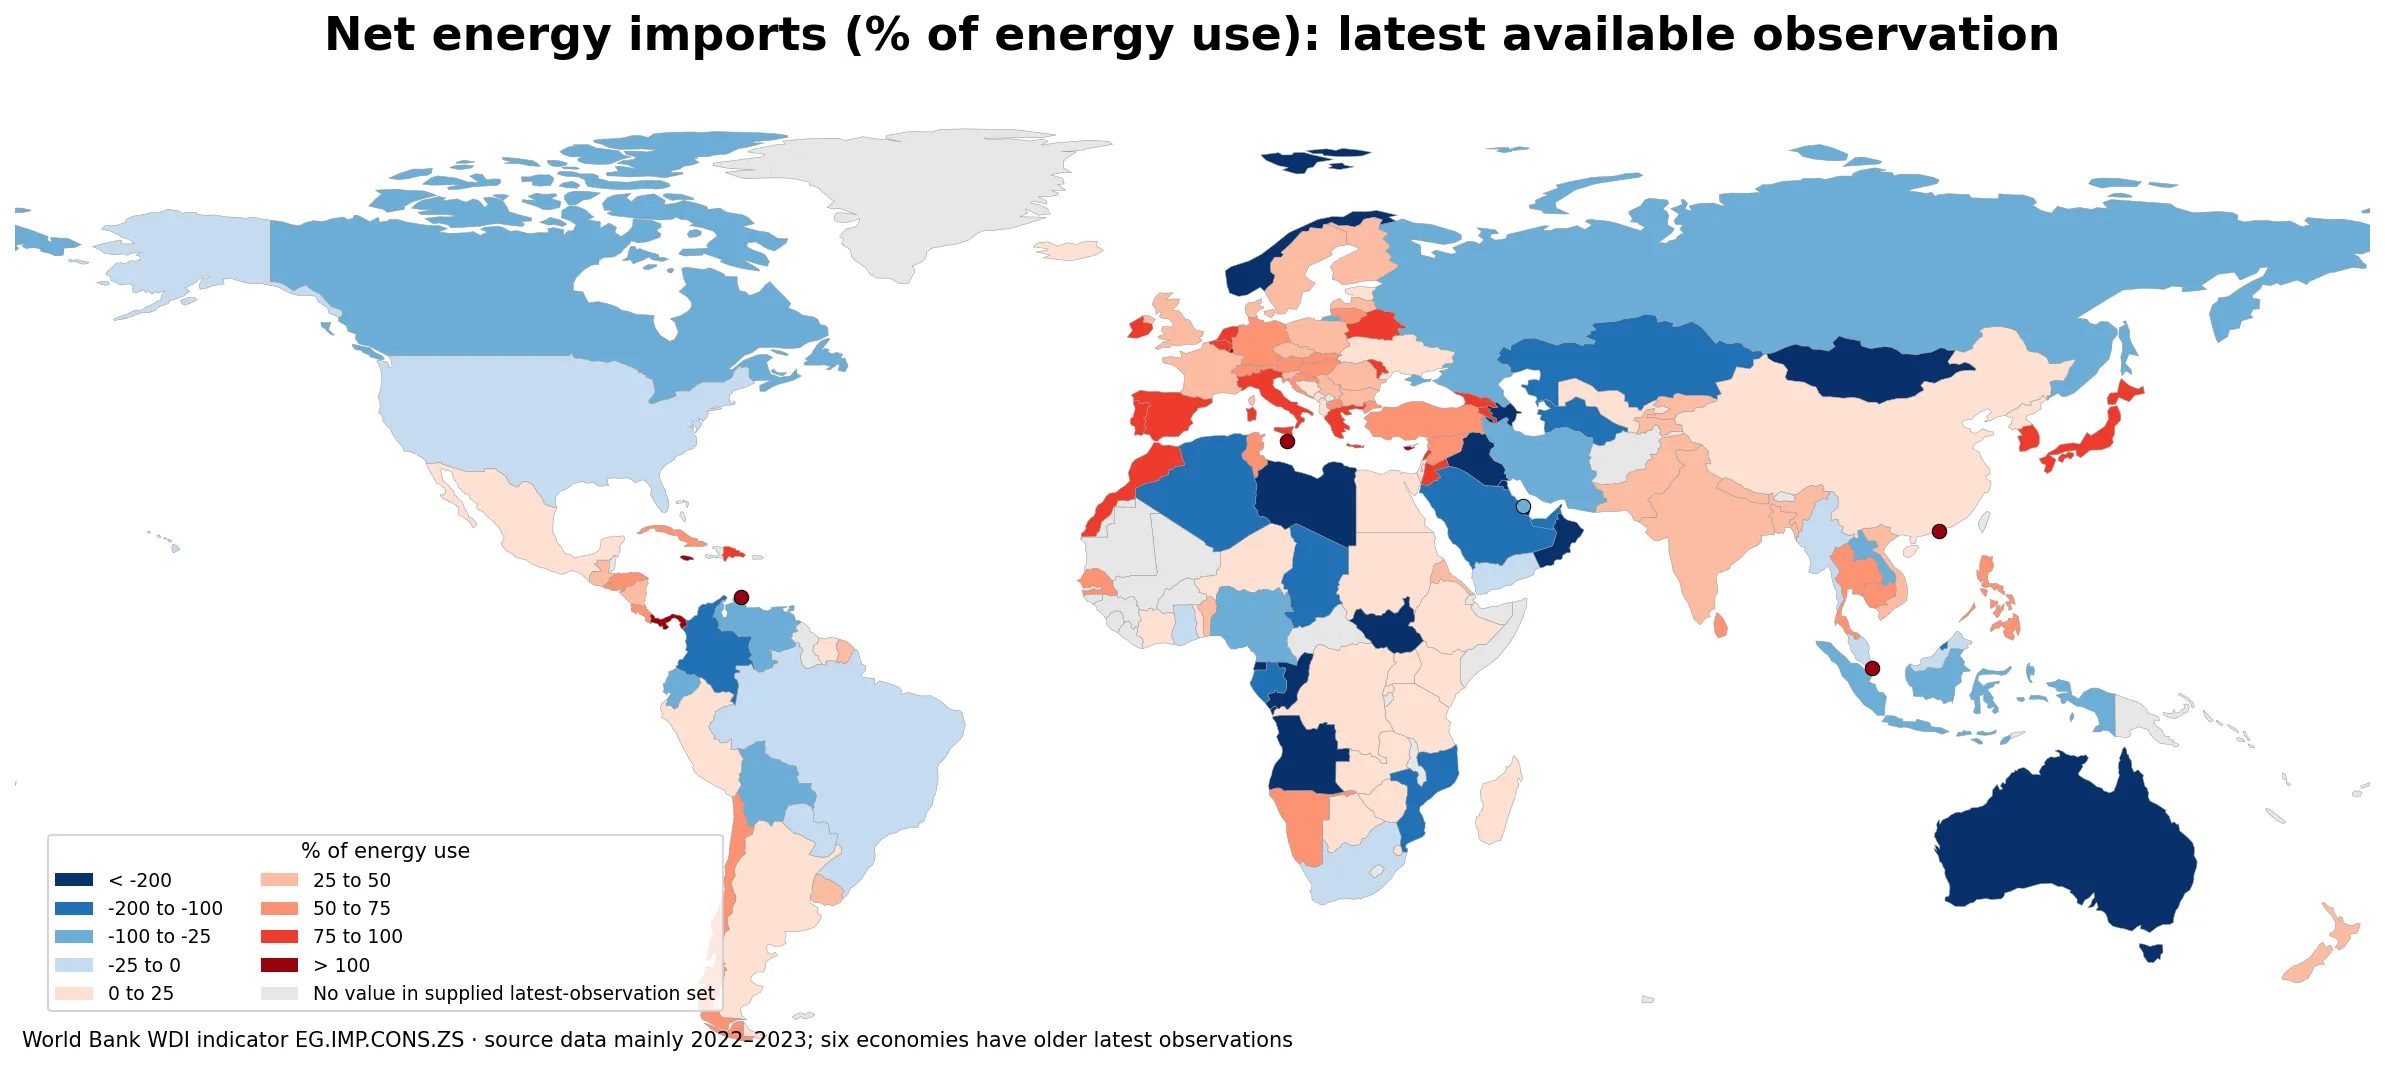
Table of Contents
What net energy imports as a share of energy use measures
The World Development Indicators code is EG.IMP.CONS.ZS. The World Bank defines net energy imports as gross imports minus gross exports, expressed relative to energy use. Energy use refers to primary energy before transformation into other end-use fuels. Its accounting framework combines indigenous production, imports and stock changes, then subtracts exports and fuels supplied to ships and aircraft engaged in international transport. This is therefore not a monetary import-share indicator, an electricity-import percentage, or a measure of the share of household energy that was purchased abroad.
A value of 50% means that net imports are roughly half the size of the energy-use denominator defined by the indicator. A value of -50% means net exports are roughly half that denominator. The minus sign is substantive information, not a missing-value marker. World Bank metadata explicitly states that a negative value indicates a net exporter. Removing the sign would erase the main distinction the indicator is designed to show.
The strongest contrasts in the latest observations
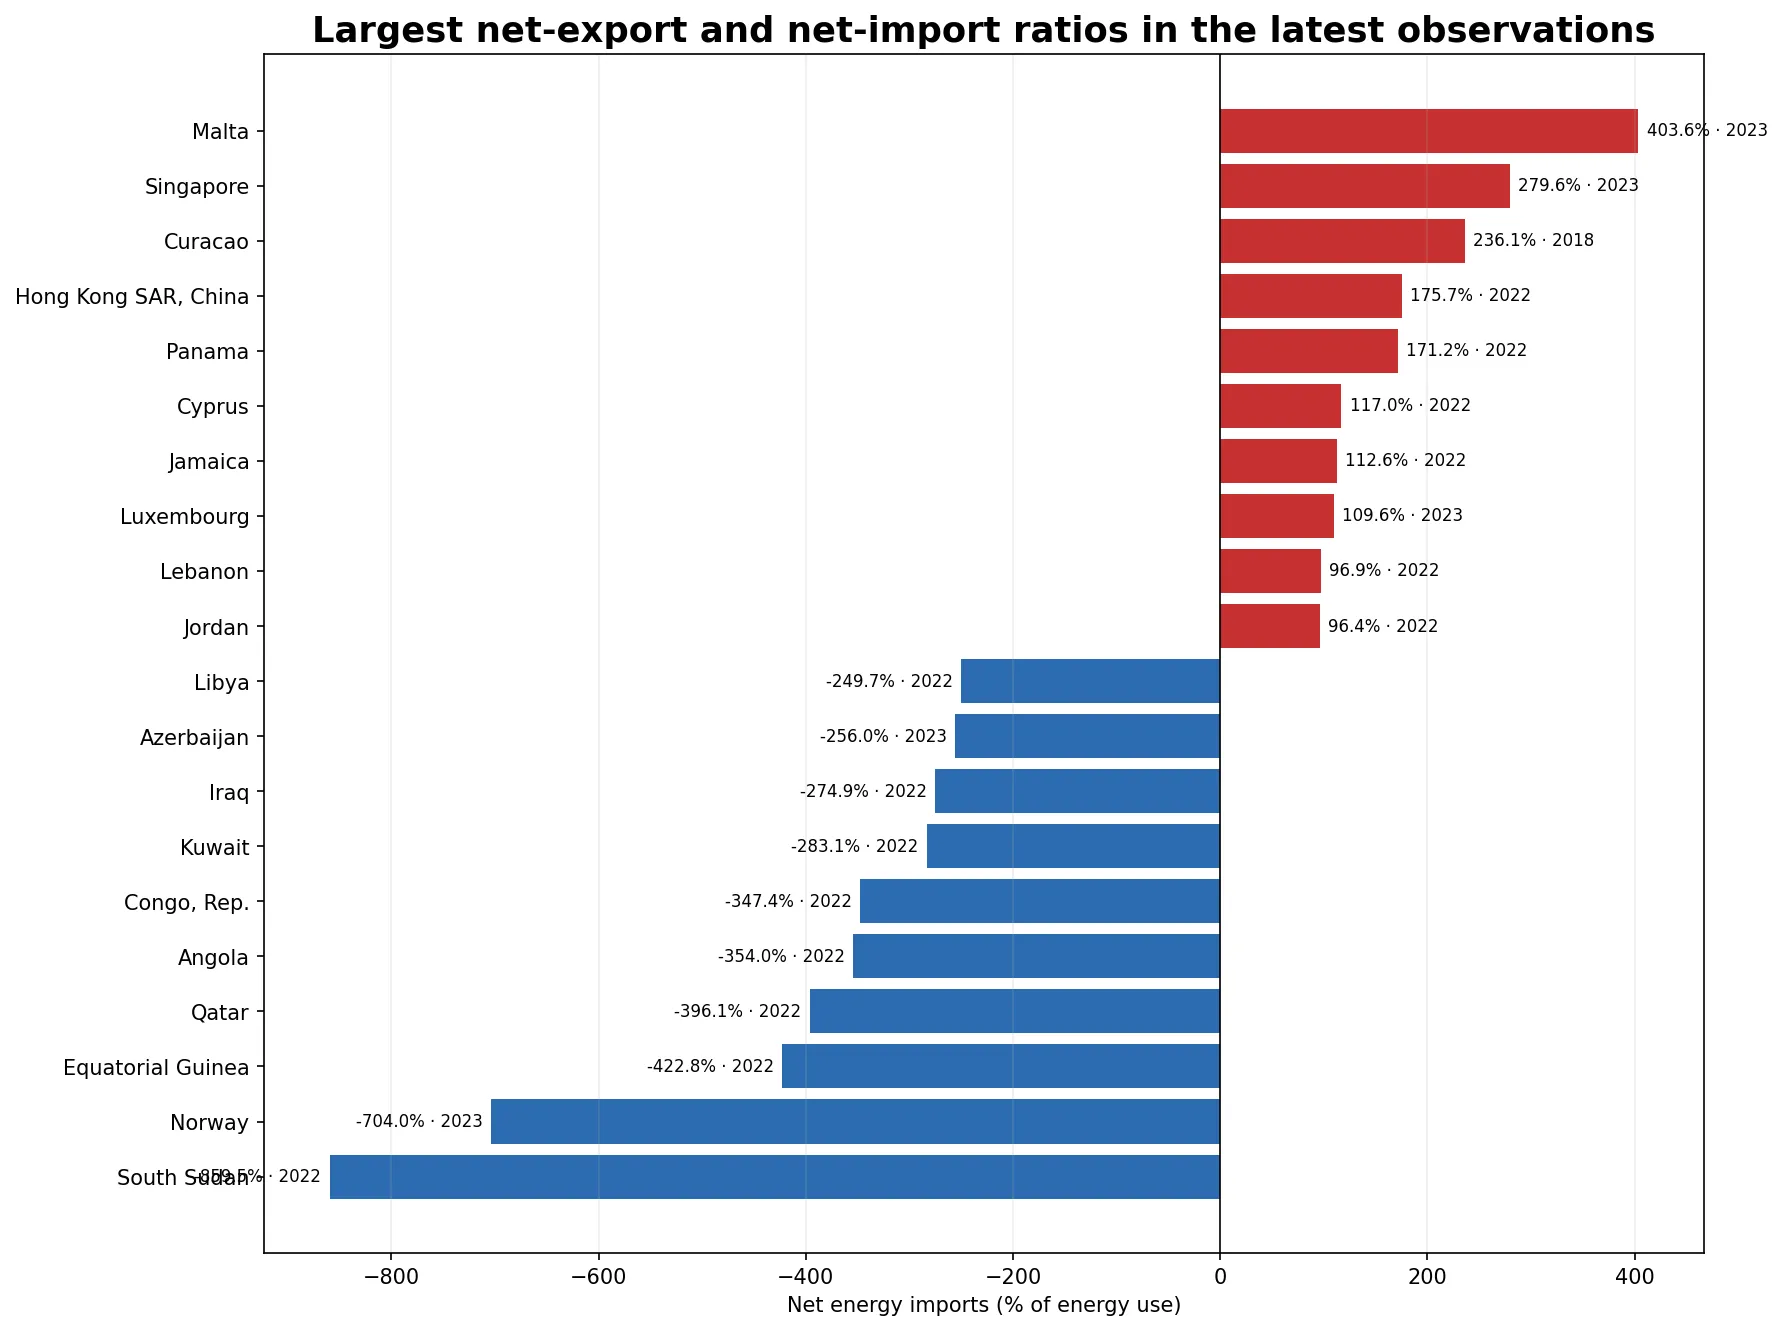
On the positive side, Malta records 403.59% in 2023, Singapore 279.62% in 2023, Curacao 236.12% in 2018, Hong Kong SAR, China 175.71% in 2022, and Panama 171.19% in 2022. These values are unusually large relative to the denominator. They should not automatically be attributed to one factor such as geography, port activity, domestic resource scarcity, or policy without additional evidence. Curacao also illustrates why the year column matters: its latest value is five years older than the 2023 observations.
At the negative extreme, South Sudan is -859.50% in 2022, Norway -703.96% in 2023, Equatorial Guinea -422.77% in 2022, Qatar -396.07% in 2022, and Angola -353.97% in 2022. Large negative magnitudes mean that net exports exceed domestic energy use by a wide margin. They do not mean that energy use itself is negative, and they are not rankings of GDP, production efficiency, or total export revenue.
Why values can exceed 100% or fall below -100%
The indicator is not mechanically bounded between zero and 100. Its numerator is net imports—gross imports minus gross exports—while its denominator is defined energy use. When net imports are larger than the energy-use denominator, the ratio can exceed 100%. Eight observations in this dataset are above 100%: Malta, Singapore, Curacao, Hong Kong SAR, China, Panama, Cyprus, Jamaica, and Luxembourg.
The same arithmetic works in the other direction. When net exports are larger in absolute value than domestic energy use, the indicator can be below -100%. Twenty-three of the latest observations are below -100%. A value such as 403.59% does not mean an economy “consumed 403% energy,” and -703.96% does not imply negative consumption. The values describe a ratio between a net trade balance and the energy-use denominator.
Geographic patterns visible on the map
The map highlights sharp differences even among nearby economies. In Europe, Belgium, Germany, Spain, Italy, Ireland, and the Netherlands are positive, while Norway is deeply negative. In the Middle East, Jordan and Lebanon are strongly positive, whereas Qatar, Kuwait, Iraq, Oman, Saudi Arabia, and the United Arab Emirates are negative. A regional average would therefore conceal some of the most important country-level contrasts.
Asia also contains both signs: Japan and several other economies are positive, while Indonesia is -89.55%, Kazakhstan -119.14%, and Brunei Darussalam -172.55%. Across the Americas, Canada, Colombia, Ecuador, Bolivia, and Brazil are negative, while Chile, Costa Rica, Honduras, Jamaica, and Panama are positive. The spatial pattern is useful for locating clusters and exceptions, but the indicator alone cannot establish why a particular economy sits on one side of zero.
Why the latest-observation year needs to stay visible
A latest-value map can look like a single-year map even when it is not. Here, 139 of the 145 observations come from 2022 or 2023, which provides a relatively recent base for broad comparison. The remaining six observations span 2004 to 2021. Eritrea’s latest value is from 2004 and Iceland’s from 2009, so those figures should not be presented as current conditions without qualification.
This also limits how the ranking should be used. Sorting the latest values is legitimate as a descriptive view of the available dataset, but it does not answer the question “which country was highest in the same year?” A difference between a 2018 observation and a 2023 observation may reflect time as well as structural differences between economies. Any close comparison should therefore check both the value and the year.
Why the median and simple mean point in different directions
The median across the 145 latest observations is 24.93%, which is positive. The simple arithmetic mean is -9.18%, which is negative. The divergence comes from very large negative outliers such as South Sudan and Norway, which pull the unweighted mean downward. Neither statistic is a World Bank global aggregate; they are descriptive summaries of the 145 latest observations.
The country count tells a different story again. There are 102 net importers and 43 net exporters, but counting every economy once does not describe the global volume of energy trade. A small economy and a very large economy have equal weight in that count. A global aggregate would require appropriate energy-use or flow weights rather than a simple average or a majority-of-countries calculation.
Latest observation for all 145 economies
The table below sorts the latest non-empty observations from the largest positive value to the largest negative value. Because the observation years differ, it should be read as a latest-available-value table rather than a synchronized annual league table. Country names follow the source dataset.
| Rank | Economy | Code | Year | Net imports (%) | Status |
|---|---|---|---|---|---|
| 1 | Malta | MLT | 2023 | 403.59 | Net importer |
| 2 | Singapore | SGP | 2023 | 279.62 | Net importer |
| 3 | Curacao | CUW | 2018 | 236.12 | Net importer |
| 4 | Hong Kong SAR, China | HKG | 2022 | 175.71 | Net importer |
| 5 | Panama | PAN | 2022 | 171.19 | Net importer |
| 6 | Cyprus | CYP | 2022 | 117.04 | Net importer |
| 7 | Jamaica | JAM | 2022 | 112.58 | Net importer |
| 8 | Luxembourg | LUX | 2023 | 109.59 | Net importer |
| 9 | Lebanon | LBN | 2022 | 96.92 | Net importer |
| 10 | Jordan | JOR | 2022 | 96.35 | Net importer |
| 11 | Dominican Republic | DOM | 2022 | 94.42 | Net importer |
| 12 | Morocco | MAR | 2023 | 93.64 | Net importer |
| 13 | Greece | GRC | 2023 | 89.25 | Net importer |
| 14 | Belgium | BEL | 2023 | 89.17 | Net importer |
| 15 | Japan | JPN | 2023 | 87.28 | Net importer |
| 16 | Netherlands | NLD | 2023 | 87.02 | Net importer |
| 17 | Ireland | IRL | 2023 | 85.77 | Net importer |
| 18 | Korea, Rep. | KOR | 2023 | 84.60 | Net importer |
| 19 | Moldova | MDA | 2023 | 81.17 | Net importer |
| 20 | Georgia | GEO | 2023 | 79.94 | Net importer |
| 21 | Italy | ITA | 2023 | 79.60 | Net importer |
| 22 | Portugal | PRT | 2023 | 77.24 | Net importer |
| 23 | Belarus | BLR | 2022 | 77.08 | Net importer |
| 24 | Spain | ESP | 2023 | 76.98 | Net importer |
| 25 | Armenia | ARM | 2022 | 76.87 | Net importer |
| 26 | Turkiye | TUR | 2023 | 71.99 | Net importer |
| 27 | Lithuania | LTU | 2023 | 71.46 | Net importer |
| 28 | Germany | DEU | 2023 | 70.49 | Net importer |
| 29 | Senegal | SEN | 2023 | 69.03 | Net importer |
| 30 | Austria | AUT | 2023 | 63.97 | Net importer |
| 31 | North Macedonia | MKD | 2023 | 63.81 | Net importer |
| 32 | Cuba | CUB | 2022 | 62.81 | Net importer |
| 33 | Hungary | HUN | 2023 | 62.51 | Net importer |
| 34 | Chile | CHL | 2023 | 62.28 | Net importer |
| 35 | Syrian Arab Republic | SYR | 2022 | 61.27 | Net importer |
| 36 | Honduras | HND | 2023 | 60.57 | Net importer |
| 37 | Namibia | NAM | 2022 | 60.50 | Net importer |
| 38 | Costa Rica | CRI | 2023 | 60.42 | Net importer |
| 39 | Sri Lanka | LKA | 2022 | 60.04 | Net importer |
| 40 | El Salvador | SLV | 2022 | 59.51 | Net importer |
| 41 | Cambodia | KHM | 2021 | 58.93 | Net importer |
| 42 | Slovak Republic | SVK | 2023 | 57.89 | Net importer |
| 43 | Thailand | THA | 2023 | 57.51 | Net importer |
| 44 | Croatia | HRV | 2023 | 57.29 | Net importer |
| 45 | Philippines | PHL | 2022 | 54.43 | Net importer |
| 46 | Tunisia | TUN | 2022 | 53.14 | Net importer |
| 47 | Switzerland | CHE | 2023 | 51.74 | Net importer |
| 48 | Slovenia | SVN | 2023 | 48.90 | Net importer |
| 49 | Poland | POL | 2023 | 48.82 | Net importer |
| 50 | France | FRA | 2023 | 47.13 | Net importer |
| 51 | Nicaragua | NIC | 2022 | 46.49 | Net importer |
| 52 | Uruguay | URY | 2022 | 46.21 | Net importer |
| 53 | Bangladesh | BGD | 2022 | 44.31 | Net importer |
| 54 | United Kingdom | GBR | 2023 | 44.04 | Net importer |
| 55 | Denmark | DNK | 2023 | 43.79 | Net importer |
| 56 | Serbia | SRB | 2023 | 42.55 | Net importer |
| 57 | Czechia | CZE | 2023 | 41.98 | Net importer |
| 58 | Bulgaria | BGR | 2023 | 40.93 | Net importer |
| 59 | Benin | BEN | 2022 | 40.90 | Net importer |
| 60 | Pakistan | PAK | 2022 | 39.79 | Net importer |
| 61 | Guatemala | GTM | 2022 | 38.36 | Net importer |
| 62 | India | IND | 2023 | 36.09 | Net importer |
| 63 | Eritrea | ERI | 2004 | 34.79 | Net importer |
| 64 | Latvia | LVA | 2023 | 34.31 | Net importer |
| 65 | Viet Nam | VNM | 2022 | 34.00 | Net importer |
| 66 | Kyrgyz Republic | KGZ | 2022 | 33.78 | Net importer |
| 67 | New Zealand | NZL | 2023 | 31.63 | Net importer |
| 68 | Finland | FIN | 2023 | 30.27 | Net importer |
| 69 | Romania | ROU | 2023 | 28.06 | Net importer |
| 70 | Tajikistan | TJK | 2022 | 28.05 | Net importer |
| 71 | Sweden | SWE | 2023 | 27.75 | Net importer |
| 72 | Nepal | NPL | 2022 | 27.41 | Net importer |
| 73 | Bosnia and Herzegovina | BIH | 2023 | 24.93 | Net importer |
| 74 | Montenegro | MNE | 2023 | 24.35 | Net importer |
| 75 | China | CHN | 2023 | 23.96 | Net importer |
| 76 | Botswana | BWA | 2022 | 23.68 | Net importer |
| 77 | Ukraine | UKR | 2023 | 23.59 | Net importer |
| 78 | Albania | ALB | 2023 | 22.70 | Net importer |
| 79 | Kenya | KEN | 2023 | 22.37 | Net importer |
| 80 | Mexico | MEX | 2023 | 21.58 | Net importer |
| 81 | Eswatini | SWZ | 2022 | 20.55 | Net importer |
| 82 | Uganda | UGA | 2022 | 20.49 | Net importer |
| 83 | Iceland | ISL | 2009 | 20.49 | Net importer |
| 84 | Egypt, Arab Rep. | EGY | 2023 | 20.26 | Net importer |
| 85 | Sudan | SDN | 2022 | 18.86 | Net importer |
| 86 | Togo | TGO | 2018 | 18.04 | Net importer |
| 87 | Zimbabwe | ZWE | 2022 | 16.98 | Net importer |
| 88 | Cote d'Ivoire | CIV | 2022 | 14.38 | Net importer |
| 89 | Israel | ISR | 2023 | 13.73 | Net importer |
| 90 | Madagascar | MDG | 2017 | 13.70 | Net importer |
| 91 | Tanzania | TZA | 2022 | 12.93 | Net importer |
| 92 | Suriname | SUR | 2023 | 12.30 | Net importer |
| 93 | Peru | PER | 2022 | 12.19 | Net importer |
| 94 | Ethiopia | ETH | 2022 | 10.79 | Net importer |
| 95 | Rwanda | RWA | 2022 | 10.58 | Net importer |
| 96 | Zambia | ZMB | 2022 | 9.03 | Net importer |
| 97 | Niger | NER | 2022 | 5.41 | Net importer |
| 98 | Korea, Dem. People's Rep. | PRK | 2022 | 4.90 | Net importer |
| 99 | Estonia | EST | 2023 | 3.77 | Net importer |
| 100 | Congo, Dem. Rep. | COD | 2022 | 1.60 | Net importer |
| 101 | Uzbekistan | UZB | 2022 | 1.55 | Net importer |
| 102 | Argentina | ARG | 2023 | 0.42 | Net importer |
| 103 | Malaysia | MYS | 2022 | -0.58 | Net exporter |
| 104 | Paraguay | PRY | 2023 | -4.69 | Net exporter |
| 105 | United States | USA | 2023 | -9.00 | Net exporter |
| 106 | Yemen, Rep. | YEM | 2022 | -11.05 | Net exporter |
| 107 | South Africa | ZAF | 2023 | -12.51 | Net exporter |
| 108 | Brazil | BRA | 2023 | -13.68 | Net exporter |
| 109 | Myanmar | MMR | 2022 | -19.03 | Net exporter |
| 110 | Ghana | GHA | 2022 | -22.37 | Net exporter |
| 111 | Cameroon | CMR | 2022 | -28.71 | Net exporter |
| 112 | Iran, Islamic Rep. | IRN | 2022 | -32.49 | Net exporter |
| 113 | Bahrain | BHR | 2022 | -45.48 | Net exporter |
| 114 | Lao PDR | LAO | 2022 | -49.02 | Net exporter |
| 115 | Nigeria | NGA | 2022 | -66.29 | Net exporter |
| 116 | Bolivia | BOL | 2022 | -67.33 | Net exporter |
| 117 | Ecuador | ECU | 2022 | -69.40 | Net exporter |
| 118 | Venezuela, RB | VEN | 2022 | -73.91 | Net exporter |
| 119 | Russian Federation | RUS | 2022 | -75.14 | Net exporter |
| 120 | Trinidad and Tobago | TTO | 2022 | -75.46 | Net exporter |
| 121 | Indonesia | IDN | 2023 | -89.55 | Net exporter |
| 122 | Canada | CAN | 2023 | -89.63 | Net exporter |
| 123 | Mozambique | MOZ | 2022 | -106.35 | Net exporter |
| 124 | Turkmenistan | TKM | 2022 | -109.78 | Net exporter |
| 125 | Kazakhstan | KAZ | 2023 | -119.14 | Net exporter |
| 126 | Algeria | DZA | 2023 | -129.34 | Net exporter |
| 127 | Colombia | COL | 2023 | -141.97 | Net exporter |
| 128 | United Arab Emirates | ARE | 2022 | -171.48 | Net exporter |
| 129 | Brunei Darussalam | BRN | 2022 | -172.55 | Net exporter |
| 130 | Chad | TCD | 2022 | -177.76 | Net exporter |
| 131 | Saudi Arabia | SAU | 2022 | -178.20 | Net exporter |
| 132 | Gabon | GAB | 2022 | -187.60 | Net exporter |
| 133 | Oman | OMN | 2022 | -213.63 | Net exporter |
| 134 | Australia | AUS | 2023 | -214.47 | Net exporter |
| 135 | Mongolia | MNG | 2022 | -226.43 | Net exporter |
| 136 | Libya | LBY | 2022 | -249.73 | Net exporter |
| 137 | Azerbaijan | AZE | 2023 | -255.96 | Net exporter |
| 138 | Iraq | IRQ | 2022 | -274.88 | Net exporter |
| 139 | Kuwait | KWT | 2022 | -283.10 | Net exporter |
| 140 | Congo, Rep. | COG | 2022 | -347.42 | Net exporter |
| 141 | Angola | AGO | 2022 | -353.97 | Net exporter |
| 142 | Qatar | QAT | 2022 | -396.07 | Net exporter |
| 143 | Equatorial Guinea | GNQ | 2022 | -422.77 | Net exporter |
| 144 | Norway | NOR | 2023 | -703.96 | Net exporter |
| 145 | South Sudan | SSD | 2022 | -859.50 | Net exporter |
Common interpretation mistakes to avoid
- Do not treat the percentage as the physical share of all energy that was imported. It is net imports divided by the indicator’s energy-use denominator.
- Do not convert negative values to zero or missing. Negative values identify net exporters.
- Do not discard values above 100% as impossible. The numerator can exceed the denominator.
- Do not label every observation as 2023. Six economies have older latest values and 72 use 2022.
- Do not interpret the simple mean as a global net-import percentage. It gives every economy equal weight.
- Do not infer a single cause from the map. Production, consumption, trade structure, stocks, international bunkers, policy, and prices require separate evidence.
Source and calculation notes
The values come from the World Bank World Development Indicators series EG.IMP.CONS.ZS. World Bank metadata identifies the International Energy Agency Energy Statistics Data Browser as the underlying source. The comparison uses the latest non-empty observation supplied for each economy, which creates a 2004–2023 range even though the large majority are from 2022–2023.
For the map, country codes were matched to world administrative boundaries. Very small economies that are not visible as polygons at the 1:110m scale were represented with location markers. Missing values were not filled with zero, and the positive/negative sign was preserved. Summary statistics and rankings were calculated directly from the 145 observations.
Frequently Asked Questions
What does a negative net energy imports percentage mean?
A negative value means the economy is a net energy exporter under the World Bank definition. It is not a missing or invalid value.
Can net energy imports exceed 100% of energy use?
Yes. The numerator is net imports and can be larger than the indicator’s energy-use denominator, so the ratio can exceed 100%.
Are all 145 observations from 2023?
No. Sixty-seven are from 2023, 72 from 2022, and six economies have older latest observations from 2004–2021.
Which latest observations are the highest positive and negative values?
Malta has the highest positive value at 403.59% in 2023, while South Sudan has the most negative value at -859.50% in 2022.
Related Articles
Green Map creates custom-edited map images using open geographic data sources such as geoBoundaries, Natural Earth, OpenStreetMap, and government open data. These maps are edited visual materials, not raw data files, and are provided for education, documents, presentations, and graphic reference.