Renewable internal freshwater resources measure renewable water generated within a country from internal river flows and groundwater recharge associated with rainfall. The 2022 World Bank data contain 217 economies and territories, with 181 numeric values and 36 source-missing values. The unit is billion cubic meters.
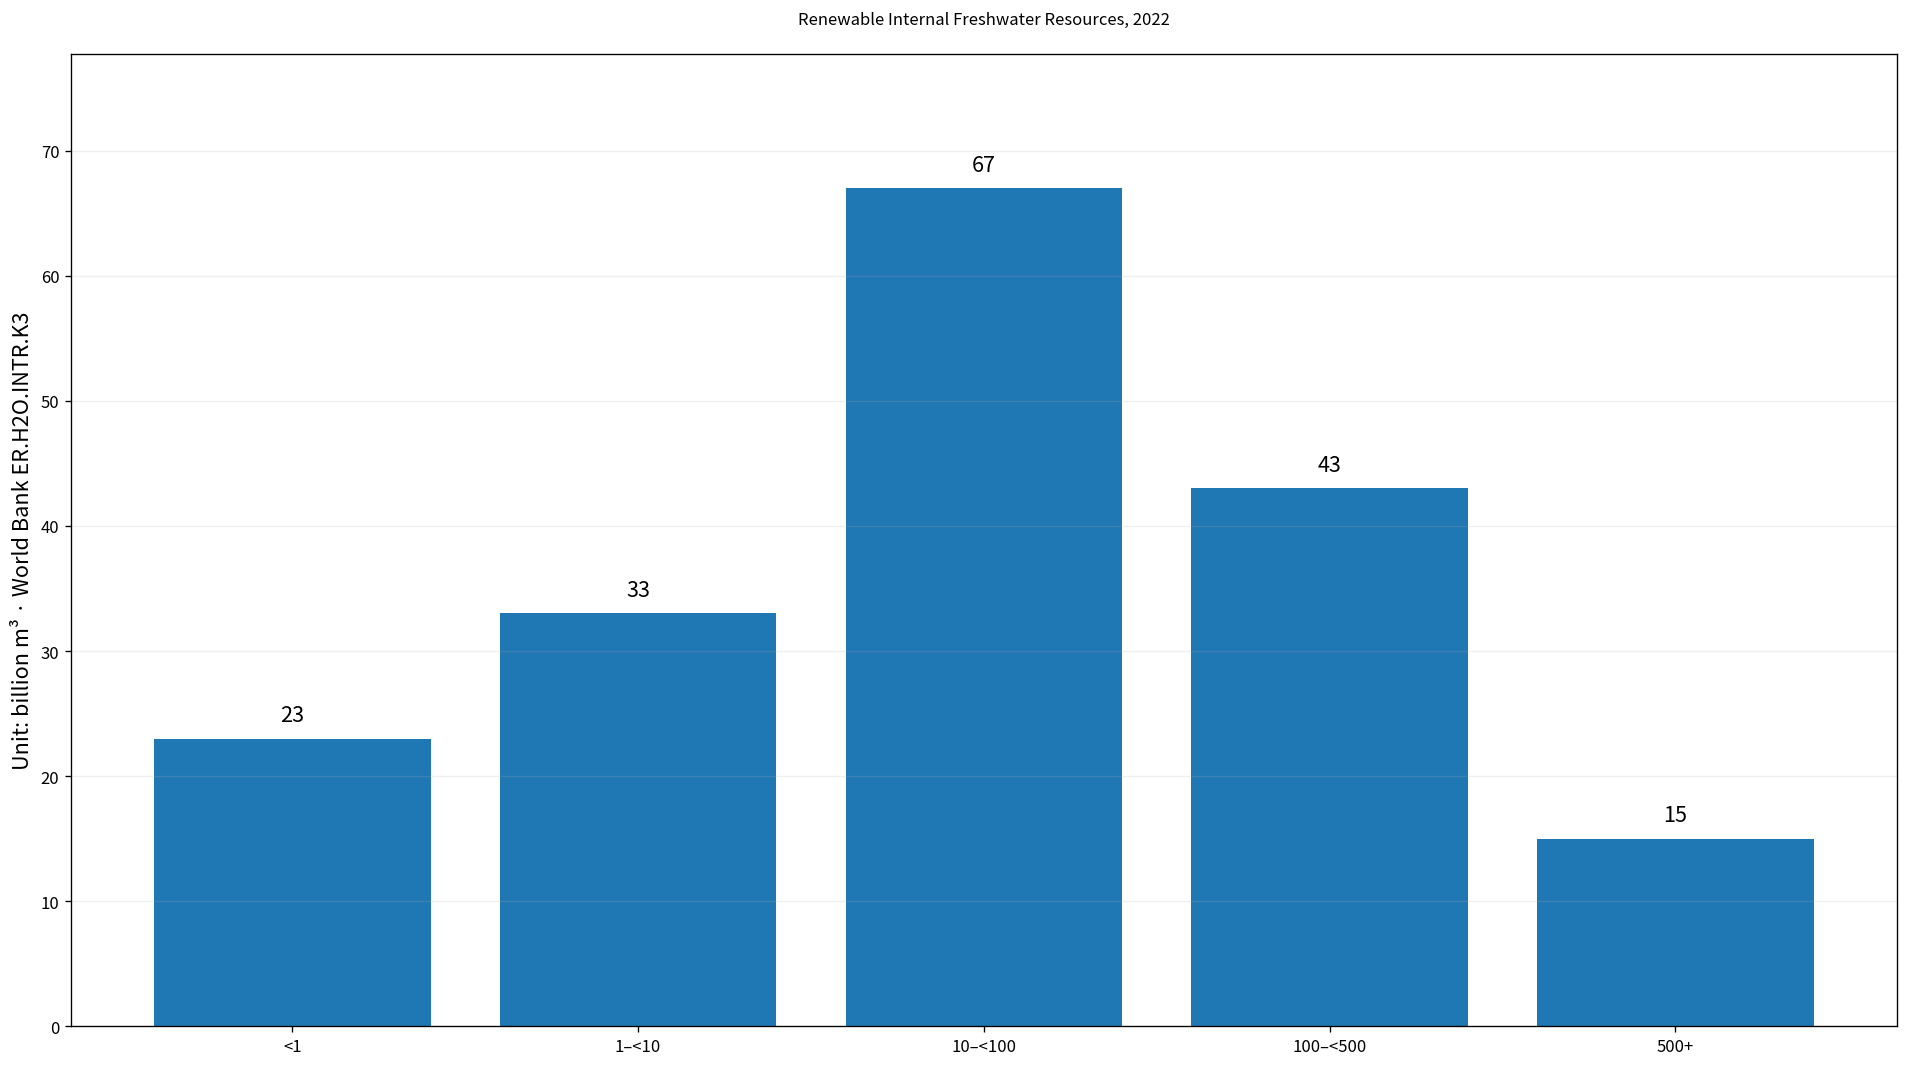
Table of Contents
What renewable internal freshwater resources measure
The indicator focuses on renewable freshwater generated inside national borders, including internal river flows and groundwater recharge from precipitation. It differs from a measure of total water available after adding flows that enter from neighboring countries. The emphasis is on water generated internally.
It is also not a measure of actual freshwater withdrawal or household, agricultural, or industrial water use. A country can have a large renewable resource base and still face local scarcity or high demand. Another country with a small internal resource base may rely on desalination, water imports, reuse, or nonrenewable groundwater.
The 2022 frame has 181 numeric values and 36 missing values
The same-year comparison uses the 181 numeric observations from the 217-row 2022 frame. The remaining 36 rows have no 2022 source value and are not converted to zero. A separate latest-observation series includes 2021 values for a small number of places, but those earlier values are not substituted into the 2022 comparison.
The median is 34.8 billion m³ and the simple mean is 236.5 billion m³. The first quartile is 6.0 and the third quartile 141.0 billion m³. The large gap between the mean and median reflects a strongly right-skewed distribution.
Brazil is highest at 5,661 billion m³
Brazil records 5,661 billion m³, followed by the Russian Federation at 4,312, Canada at 2,850, the United States at 2,818, and China at 2,812.9. Colombia, Indonesia, Peru, India, and Myanmar also exceed 1,000 billion m³.
| Rank | Economy/territory | 2022 renewable internal freshwater resources |
|---|---|---|
| 1 | Brazil | 5,661.0 billion m³ |
| 2 | Russian Federation | 4,312.0 billion m³ |
| 3 | Canada | 2,850.0 billion m³ |
| 4 | United States | 2,818.0 billion m³ |
| 5 | China | 2,812.9 billion m³ |
| 6 | Colombia | 2,145.0 billion m³ |
| 7 | Indonesia | 2,018.7 billion m³ |
| 8 | Peru | 1,641.0 billion m³ |
| 9 | India | 1,446.0 billion m³ |
| 10 | Myanmar | 1,002.8 billion m³ |
| 11 | Congo, Dem. Rep. | 900 billion m³ |
| 12 | Chile | 885 billion m³ |
| 13 | Venezuela, RB | 805 billion m³ |
| 14 | Papua New Guinea | 801 billion m³ |
| 15 | Malaysia | 580 billion m³ |
| 16 | Australia | 492 billion m³ |
| 17 | Philippines | 479 billion m³ |
| 18 | Ecuador | 442.4 billion m³ |
| 19 | Japan | 430 billion m³ |
| 20 | Mexico | 409 billion m³ |
10 numeric observations are at least 1,000 billion m³, 15 are at least 500 billion m³, and 58 are at least 100 billion m³. A relatively small group of very large values pulls the arithmetic mean far above the median.
The median is 34.8 billion m³
The median of 34.8 billion m³ is the middle value when the 181 numeric observations are ordered by size. The interquartile range runs from 6.0 to 141.0 billion m³. This center is far below the mean of 236.5 billion m³ because the upper tail extends into the thousands.
By band, 23 observations are below 1 billion m³, 33 are from 1 to below 10, 67 are from 10 to below 100, 43 are from 100 to below 500, and 15 are at least 500. The featured chart uses these bands so the middle and lower parts of the distribution remain visible.
Twenty-three observations are below 1 billion m³
At the low end, Kuwait is reported at 0.0 billion m³. Bahrain records 0.004, Naoero 0.01, St. Kitts and Nevis 0.024, Maldives 0.03, Malta 0.0505, Antigua and Barbuda 0.052, Qatar 0.056, and Barbados 0.08. The United Arab Emirates is at 0.15 billion m³.
| Low-order position | Economy/territory | 2022 renewable internal freshwater resources |
|---|---|---|
| 1 | Kuwait | 0 billion m³ |
| 2 | Bahrain | 0.004 billion m³ |
| 3 | Naoero | 0.01 billion m³ |
| 4 | St. Kitts and Nevis | 0.024 billion m³ |
| 5 | Maldives | 0.03 billion m³ |
| 6 | Malta | 0.0505 billion m³ |
| 7 | Antigua and Barbuda | 0.052 billion m³ |
| 8 | Qatar | 0.056 billion m³ |
| 9 | Barbados | 0.08 billion m³ |
| 10 | St. Vincent and the Grenadines | 0.1 billion m³ |
| 11 | United Arab Emirates | 0.15 billion m³ |
| 12 | Dominica | 0.2 billion m³ |
| 13 | Grenada | 0.2 billion m³ |
| 14 | Cabo Verde | 0.3 billion m³ |
| 15 | Djibouti | 0.3 billion m³ |
| 16 | St. Lucia | 0.3 billion m³ |
| 17 | Andorra | 0.3156 billion m³ |
| 18 | Mauritania | 0.4 billion m³ |
| 19 | Singapore | 0.6 billion m³ |
| 20 | Jordan | 0.682 billion m³ |
| 21 | Bahamas, The | 0.7 billion m³ |
| 22 | Libya | 0.7 billion m³ |
| 23 | Cyprus | 0.78 billion m³ |
| 24 | Egypt, Arab Rep. | 1 billion m³ |
| 25 | Luxembourg | 1 billion m³ |
Kuwait’s zero is a published numeric observation, not a missing value, so it is preserved. It should not be interpreted as meaning that the country has no water supply of any kind. The indicator covers renewable internal freshwater only and does not capture desalination, imported water, reuse, or nonrenewable groundwater.
Country size and hydroclimate both matter
Because this is an absolute volume measure, large countries with extensive river systems, high precipitation, or substantial groundwater recharge can rank high. Small or arid economies can rank low. But no single factor explains the ranking: area, precipitation, evapotranspiration, topography, geology, and hydrology all contribute.
The same resource volume can have very different implications depending on population and demand. A more complete water-availability assessment would combine this indicator with renewable resources per capita, freshwater withdrawals, water stress, storage, and rainfall variability.
Internal resources are different from external inflows
The indicator emphasizes water generated within a country’s borders. It is therefore distinct from external river inflows crossing a border. Economies that depend heavily on transboundary rivers can look much smaller on an internal-resource measure than on a measure that includes external renewable water.
A large internal total also does not guarantee that water is close to population centers or available throughout the year. Geographic distribution, seasonality, infrastructure, water quality, and access all affect the practical usefulness of the resource.
Complete 2022 frame of 217 economies and territories
The table below lists all 217 rows in the 2022 frame. The 36 rows without a source value are marked ‘No value’. Missing observations are not replaced with zero or with values from an earlier year.
| Economy/territory | 2022 renewable internal freshwater resources |
|---|---|
| Afghanistan | 47.15 billion m³ |
| Albania | 26.9 billion m³ |
| Algeria | 11.25 billion m³ |
| American Samoa | No value |
| Andorra | 0.3156 billion m³ |
| Angola | 148 billion m³ |
| Antigua and Barbuda | 0.052 billion m³ |
| Argentina | 292 billion m³ |
| Armenia | 6.859 billion m³ |
| Aruba | No value |
| Australia | 492 billion m³ |
| Austria | 55 billion m³ |
| Azerbaijan | 8.115 billion m³ |
| Bahamas, The | 0.7 billion m³ |
| Bahrain | 0.004 billion m³ |
| Bangladesh | 105 billion m³ |
| Barbados | 0.08 billion m³ |
| Belarus | 34 billion m³ |
| Belgium | 12 billion m³ |
| Belize | 15.26 billion m³ |
| Benin | 10.3 billion m³ |
| Bermuda | No value |
| Bhutan | 78 billion m³ |
| Bolivia | 303.5 billion m³ |
| Bosnia and Herzegovina | 35.5 billion m³ |
| Botswana | 2.4 billion m³ |
| Brazil | 5,661.0 billion m³ |
| British Virgin Islands | No value |
| Brunei Darussalam | 8.5 billion m³ |
| Bulgaria | 21 billion m³ |
| Burkina Faso | 12.5 billion m³ |
| Burundi | 10.06 billion m³ |
| Cabo Verde | 0.3 billion m³ |
| Cambodia | 120.6 billion m³ |
| Cameroon | 273 billion m³ |
| Canada | 2,850.0 billion m³ |
| Cayman Islands | No value |
| Central African Republic | 141 billion m³ |
| Chad | 15 billion m³ |
| Channel Islands | No value |
| Chile | 885 billion m³ |
| China | 2,812.9 billion m³ |
| Colombia | 2,145.0 billion m³ |
| Comoros | 1.2 billion m³ |
| Congo, Dem. Rep. | 900 billion m³ |
| Congo, Rep. | 222 billion m³ |
| Costa Rica | 113 billion m³ |
| Cote d’Ivoire | 76.84 billion m³ |
| Croatia | 37.7 billion m³ |
| Cuba | 38.12 billion m³ |
| Curacao | No value |
| Cyprus | 0.78 billion m³ |
| Czechia | 13.15 billion m³ |
| Denmark | 6 billion m³ |
| Djibouti | 0.3 billion m³ |
| Dominica | 0.2 billion m³ |
| Dominican Republic | 23.5 billion m³ |
| Ecuador | 442.4 billion m³ |
| Egypt, Arab Rep. | 1 billion m³ |
| El Salvador | 15.63 billion m³ |
| Equatorial Guinea | 26 billion m³ |
| Eritrea | 2.8 billion m³ |
| Estonia | 12.71 billion m³ |
| Eswatini | 2.64 billion m³ |
| Ethiopia | 122 billion m³ |
| Faroe Islands | No value |
| Fiji | 28.55 billion m³ |
| Finland | 107 billion m³ |
| France | 200 billion m³ |
| French Polynesia | No value |
| Gabon | 164 billion m³ |
| Gambia, The | 3 billion m³ |
| Georgia | 58.13 billion m³ |
| Germany | 107 billion m³ |
| Ghana | 30.3 billion m³ |
| Gibraltar | No value |
| Greece | 58 billion m³ |
| Greenland | No value |
| Grenada | 0.2 billion m³ |
| Guam | No value |
| Guatemala | 109.2 billion m³ |
| Guinea | 226 billion m³ |
| Guinea-Bissau | 16 billion m³ |
| Guyana | 241 billion m³ |
| Haiti | 13.01 billion m³ |
| Honduras | 90.66 billion m³ |
| Hong Kong SAR, China | No value |
| Hungary | 6 billion m³ |
| Iceland | 170 billion m³ |
| India | 1,446.0 billion m³ |
| Indonesia | 2,018.7 billion m³ |
| Iran, Islamic Rep. | 128.5 billion m³ |
| Iraq | 35.2 billion m³ |
| Ireland | 49 billion m³ |
| Isle of Man | No value |
| Israel | No value |
| Italy | 182.5 billion m³ |
| Jamaica | 10.82 billion m³ |
| Japan | 430 billion m³ |
| Jordan | 0.682 billion m³ |
| Kazakhstan | 64.35 billion m³ |
| Kenya | 20.7 billion m³ |
| Kiribati | No value |
| Korea, Dem. People’s Rep. | 67 billion m³ |
| Korea, Rep. | 64.85 billion m³ |
| Kosovo | No value |
| Kuwait | 0 billion m³ |
| Kyrgyz Republic | 48.93 billion m³ |
| Lao PDR | 190.4 billion m³ |
| Latvia | 16.94 billion m³ |
| Lebanon | 4.8 billion m³ |
| Lesotho | 5.23 billion m³ |
| Liberia | 200 billion m³ |
| Libya | 0.7 billion m³ |
| Liechtenstein | No value |
| Lithuania | 15.46 billion m³ |
| Luxembourg | 1 billion m³ |
| Macao SAR, China | No value |
| Madagascar | 337 billion m³ |
| Malawi | 16.14 billion m³ |
| Malaysia | 580 billion m³ |
| Maldives | 0.03 billion m³ |
| Mali | 60 billion m³ |
| Malta | 0.0505 billion m³ |
| Marshall Islands | No value |
| Mauritania | 0.4 billion m³ |
| Mauritius | 2.751 billion m³ |
| Mexico | 409 billion m³ |
| Micronesia, Fed. Sts. | No value |
| Moldova | 1.62 billion m³ |
| Monaco | No value |
| Mongolia | 34.8 billion m³ |
| Montenegro | No value |
| Morocco | 29 billion m³ |
| Mozambique | 100.3 billion m³ |
| Myanmar | 1,002.8 billion m³ |
| Namibia | 6.16 billion m³ |
| Naoero | 0.01 billion m³ |
| Nepal | 198.2 billion m³ |
| Netherlands | 11 billion m³ |
| New Caledonia | No value |
| New Zealand | 327 billion m³ |
| Nicaragua | 156.21 billion m³ |
| Niger | 3.5 billion m³ |
| Nigeria | 221 billion m³ |
| North Macedonia | 5.4 billion m³ |
| Northern Mariana Islands | No value |
| Norway | 382 billion m³ |
| Oman | 1.4 billion m³ |
| Pakistan | 55 billion m³ |
| Palau | No value |
| Panama | 136.6 billion m³ |
| Papua New Guinea | 801 billion m³ |
| Paraguay | 117 billion m³ |
| Peru | 1,641.0 billion m³ |
| Philippines | 479 billion m³ |
| Poland | 53.6 billion m³ |
| Portugal | 38 billion m³ |
| Puerto Rico (US) | 7.1 billion m³ |
| Qatar | 0.056 billion m³ |
| Romania | 42.38 billion m³ |
| Russian Federation | 4,312.0 billion m³ |
| Rwanda | 9.5 billion m³ |
| Samoa | No value |
| San Marino | No value |
| Sao Tome and Principe | 2.18 billion m³ |
| Saudi Arabia | 2.4 billion m³ |
| Senegal | 25.8 billion m³ |
| Serbia | 8.407 billion m³ |
| Seychelles | No value |
| Sierra Leone | 160 billion m³ |
| Singapore | 0.6 billion m³ |
| Sint Maarten (Dutch part) | No value |
| Slovak Republic | 12.6 billion m³ |
| Slovenia | 18.67 billion m³ |
| Solomon Islands | 44.7 billion m³ |
| Somalia, Fed. Rep. | 6 billion m³ |
| South Africa | 44.8 billion m³ |
| South Sudan | 26 billion m³ |
| Spain | 111.2 billion m³ |
| Sri Lanka | 52.8 billion m³ |
| St. Kitts and Nevis | 0.024 billion m³ |
| St. Lucia | 0.3 billion m³ |
| St. Martin (French part) | No value |
| St. Vincent and the Grenadines | 0.1 billion m³ |
| Sudan | 4 billion m³ |
| Suriname | 99 billion m³ |
| Sweden | 171 billion m³ |
| Switzerland | 40.4 billion m³ |
| Syrian Arab Republic | 7.132 billion m³ |
| Tajikistan | 63.46 billion m³ |
| Tanzania | 84 billion m³ |
| Thailand | 224.51 billion m³ |
| Timor-Leste | 8.215 billion m³ |
| Togo | 11.5 billion m³ |
| Tonga | No value |
| Trinidad and Tobago | 3.84 billion m³ |
| Tunisia | 4.195 billion m³ |
| Turkiye | 227 billion m³ |
| Turkmenistan | 1.405 billion m³ |
| Turks and Caicos Islands | No value |
| Tuvalu | No value |
| Uganda | 39 billion m³ |
| Ukraine | 55.1 billion m³ |
| United Arab Emirates | 0.15 billion m³ |
| United Kingdom | 145 billion m³ |
| United States | 2,818.0 billion m³ |
| Uruguay | 92.2 billion m³ |
| Uzbekistan | 16.34 billion m³ |
| Vanuatu | 10 billion m³ |
| Venezuela, RB | 805 billion m³ |
| Viet Nam | 359.42 billion m³ |
| Virgin Islands (U.S.) | No value |
| West Bank and Gaza | No value |
| Yemen, Rep. | 2.1 billion m³ |
| Zambia | 80.2 billion m³ |
| Zimbabwe | 12.26 billion m³ |
How to interpret the data
First, this is an absolute renewable internal freshwater-resource volume, not water use. Second, a large total does not automatically imply high per-capita availability. Third, external transboundary inflows are a separate concept. Fourth, missing 2022 values should remain missing rather than being filled with zero or earlier observations.
Water-resource estimates can also reflect long-term hydrological conditions and methodological updates. Assessing current drought or water scarcity requires additional evidence on recent rainfall, storage, withdrawals, demand, and water stress.
Source and calculation
The source is World Bank World Development Indicators ER.H2O.INTR.K3, Renewable internal freshwater resources, total (billion cubic meters). The mean, median, quartiles, resource bands, and rankings are calculated from the 181 numeric observations in the 2022 same-year frame.
Frequently Asked Questions
Is renewable internal freshwater resources the same as water use?
No. It measures renewable freshwater generated within a country, not actual withdrawals or consumption.
What is the 2022 median?
The median across the 181 numeric observations is 34.8 billion m³.
Were the 36 missing values treated as zero?
No. Rows without a 2022 source value remain missing and are excluded from the numeric statistics and rankings.
Related Articles
Green Map creates custom-edited map images using open geographic data sources such as geoBoundaries, Natural Earth, OpenStreetMap, and government open data. These maps are edited visual materials, not raw data files, and are provided for education, documents, presentations, and graphic reference.