World Bank indicator IC.FRM.CRDC.FL.ZS provides a latest available estimate of the share of firms classified as fully credit constrained in 171 countries and economies. Survey years range from 2013 to 2025: 62 observations are from 2025, 48 from 2024, and 45 from 2023. Across all latest observations, the unweighted mean is 14.28% and the median is 10.21%.
The measure is not simply the percentage of firms without a bank loan. It combines whether a firm uses external finance with its loan-application behavior and outcome. Firms that have enough capital and do not need a loan are treated differently from firms that avoid applying because of unfavorable conditions or believe they would be rejected.
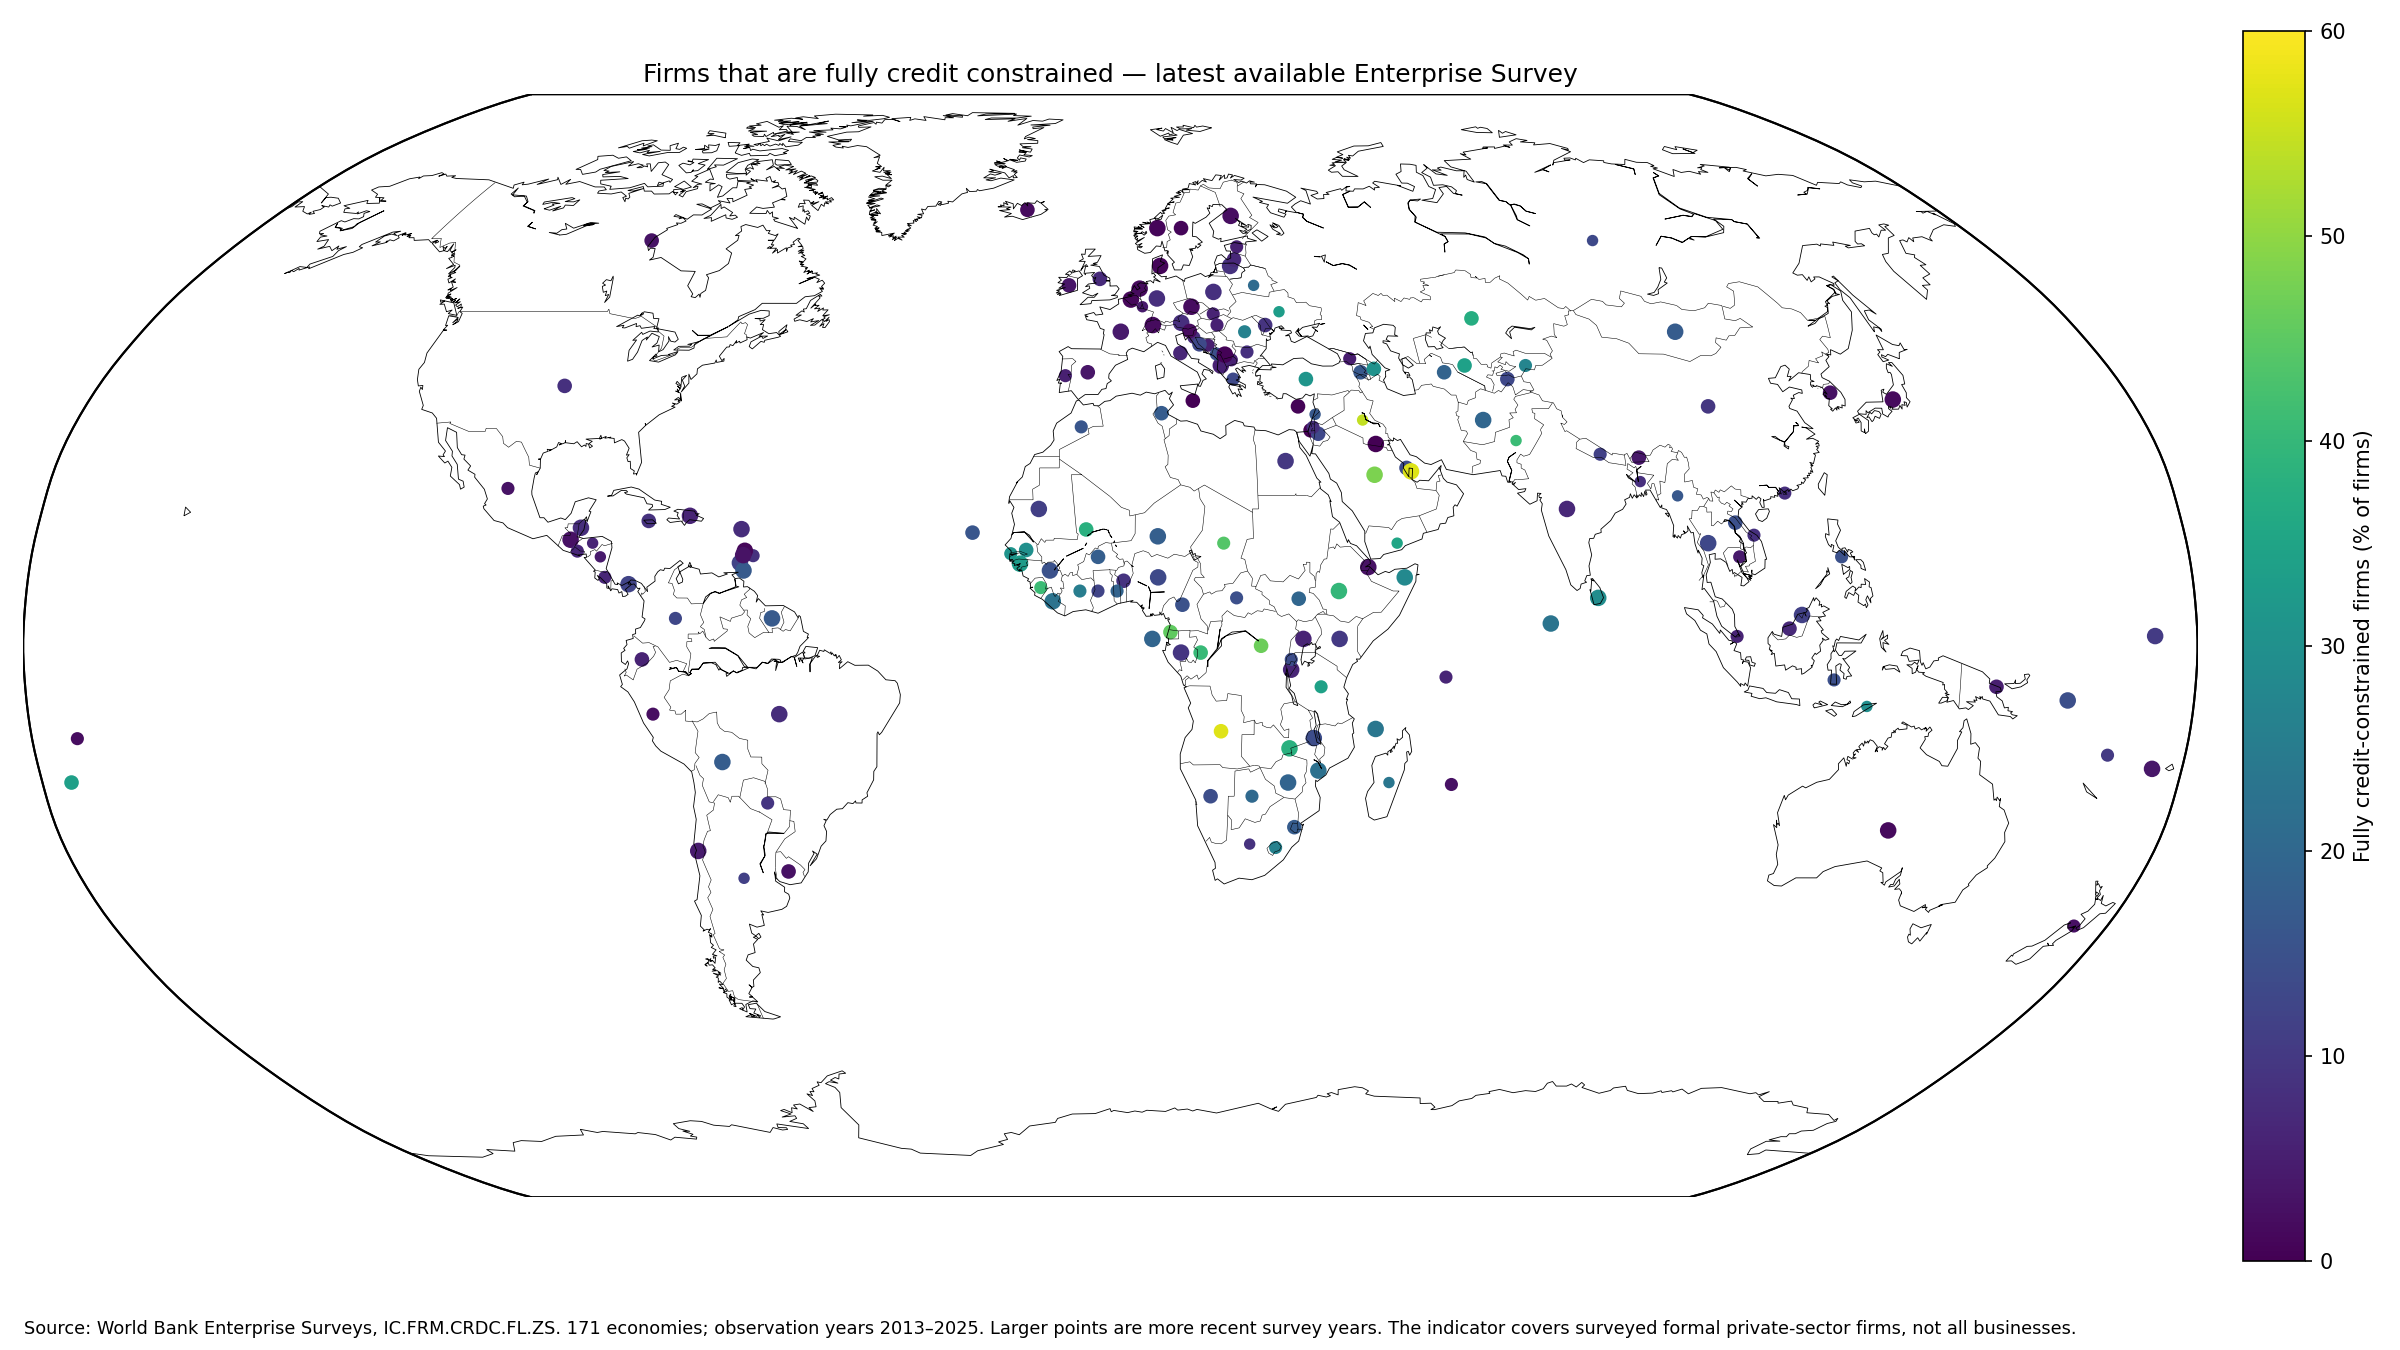
Table of Contents
How a fully credit-constrained firm is defined
The definition developed in the World Bank study by Islam and Rodriguez Meza combines financing sources and loan outcomes. A fully constrained firm has no external source of finance and either did not apply for a loan for a reason other than having enough capital, or applied and had the loan application rejected.
Discouragement reasons include complex procedures, unfavorable terms, high collateral requirements, unsuitable loan size or maturity, and the belief that an application would not be approved. A rejected borrower can still be classified as fully constrained when it uses equity finance for investment under the study’s definition.
A firm without a loan is not automatically credit constrained
A firm that did not apply because it had sufficient capital is classified as credit unconstrained. A firm whose loan application was approved in full is also in the unconstrained group.
That distinction is why the indicator cannot be replaced by the share of firms without a bank loan or line of credit. Non-borrowing can reflect either lack of need or barriers to access, and the survey tries to distinguish those situations.
The survey universe is narrower than all businesses
The World Bank Enterprise Surveys generally target registered, non-agricultural private-sector firms with at least five employees, focusing on manufacturing and services. Firms that are 100% government owned are not part of the standard Enterprise Survey universe.
A country value of 20% therefore does not mean 20% of every business, informal enterprise, sole trader, farm, and state enterprise in the country is fully credit constrained. It is an estimate for the formal private-sector population covered by the survey design.
The median latest observation is 10.21%
The median across 171 latest observations is 10.21%. The middle half lies between 5.47% and 18.84%. The mean of 14.28% is higher than the median because a group of country estimates above 40% stretches the upper tail.
For a typical country observation, the median and distribution bands are therefore more informative than the mean alone.
Nearly half of latest observations are below 10%
41 observations are below 5% and 44 are from 5% to under 10%. Together they account for 85 of the 171 economies. Another 48 are from 10% to under 20%, 15 from 20% to under 30%, 13 from 30% to under 40%, and 10 are at least 40%.
| Fully credit-constrained firms | Economies | Share of 171 |
|---|---|---|
| Below 5% | 41 | 24.0% |
| 5% to under 10% | 44 | 25.7% |
| 10% to under 20% | 48 | 28.1% |
| 20% to under 30% | 15 | 8.8% |
| 30% to under 40% | 13 | 7.6% |
| 40% or more | 10 | 5.8% |
The highest latest observations come from different survey years
Across all latest observations, Angola records 57.16%, Qatar 56.76%, Iraq 54.57%, Saudi Arabia 48.07%, and the Democratic Republic of Congo 46.42%.
Angola is a 2024 survey, Qatar and Saudi Arabia are from 2025, and Iraq is from 2022. The full table is therefore a latest-available comparison, not a synchronized 2025 ranking.
| Latest-observation rank | Country or economy | Survey year | Fully credit-constrained firms |
|---|---|---|---|
| 1 | Angola | 2024 | 57.16% |
| 2 | Qatar | 2025 | 56.76% |
| 3 | Iraq | 2022 | 54.57% |
| 4 | Saudi Arabia | 2025 | 48.07% |
| 5 | Congo, Dem. Rep. | 2024 | 46.42% |
| 6 | Equatorial Guinea | 2024 | 45.34% |
| 7 | Chad | 2023 | 43.85% |
| 8 | Sierra Leone | 2023 | 41.01% |
| 9 | Pakistan | 2022 | 40.94% |
| 10 | Congo, Rep. | 2024 | 40.33% |
| 11 | Ethiopia | 2025 | 39.61% |
| 12 | Mali | 2024 | 38.13% |
| 13 | Zambia | 2025 | 38.10% |
| 14 | Kazakhstan | 2024 | 37.22% |
| 15 | Yemen, Rep. | 2013 | 35.30% |
The synchronized 2025 subset contains 62 economies
Among the 62 observations from 2025, Qatar records 56.76%, Saudi Arabia 48.07%, Ethiopia 39.61%, Zambia 38.10%, and Guinea-Bissau 32.99%.
| 2025 rank | Country or economy | Fully credit-constrained firms |
|---|---|---|
| 1 | Qatar | 56.76% |
| 2 | Saudi Arabia | 48.07% |
| 3 | Ethiopia | 39.61% |
| 4 | Zambia | 38.10% |
| 5 | Guinea-Bissau | 32.99% |
| 6 | Sri Lanka | 29.17% |
| 7 | Somalia, Fed. Rep. | 28.16% |
| 8 | Comoros | 23.44% |
| 9 | Maldives | 23.15% |
| 10 | Liberia | 22.78% |
| 11 | Mozambique | 22.16% |
| 12 | Afghanistan | 19.51% |
| 13 | Sao Tome and Principe | 19.23% |
| 14 | Zimbabwe | 19.14% |
| 15 | Niger | 17.88% |
The 2025 subset has an unweighted mean of 12.68% and median of 9.53%. The first quartile is 3.84% and the third quartile 17.46%. For same-year comparison, this subset is temporally cleaner than the 171-economy latest-value table.
The 2025 spread remains wide
In 2025, 18 observations are below 5%, 15 are from 5% to under 10%, 18 from 10% to under 20%, 6 from 20% to under 30%, 3 from 30% to under 40%, and 2 are at least 40%.
The same survey year still contains estimates from around 1% to above 50%. That variation documents large cross-country differences in the survey measure, but it does not by itself identify the policy or institutional cause of those differences.
Reported zeros are not missing values
Three latest observations are exactly 0%: Kuwait, Malta, and Israel. These are reported numeric values, not missing observations filled with zero.
Economies outside the 171-row coverage should not be treated as 0%. Absence from this latest-value dataset and a survey estimate of zero are different statistical states.
A low fully constrained share does not mean finance is frictionless
A low value can coexist with partially credit-constrained firms. Firms that have some external finance but face discouragement, partial loan approval, or certain rejected-loan situations can be classified as partially constrained rather than fully constrained.
A broader view of financial access can therefore combine this indicator with the partially constrained share, the percentage of firms with a bank loan or line of credit, and measures of bank financing for working capital or investment.
The percentage is a survey estimate, not a raw international firm count
Enterprise Surveys use country-specific sampling designs and survey weights to represent the covered firm population. The published percentage should not be interpreted as a simple international count of respondent firms.
Sample sizes and precision differ by country. Detailed country analysis should consult the survey documentation, sampling frame, and standard errors where available.
Survey-year differences matter
Among the 171 latest observations, 62 are from 2025, 48 from 2024, and 45 from 2023; the remainder are from 2013–2022. Enterprise Surveys are not an annual administrative series collected in every country at the same time.
Credit conditions can change with interest rates, the business cycle, banking conditions, collateral frameworks, and firms’ demand for finance. Older survey estimates should therefore not be presented as if they were 2025 conditions.
| Survey year | Economies |
|---|---|
| 2025 | 62 |
| 2024 | 48 |
| 2023 | 45 |
| 2022 | 4 |
| 2021 | 1 |
| 2020 | 2 |
| 2019 | 3 |
| 2018 | 1 |
| 2017 | 1 |
| 2016 | 3 |
| 2013 | 1 |
Firm size and sector can differ from the national average
The World Bank research finds that the prevalence of credit constraints differs by firm size and between manufacturing and services. A country-level percentage is a weighted aggregate across the firms represented in that country’s survey.
It should not be used to predict the financing situation of one specific small firm, large firm, or industry. Firm-level or subgroup analysis requires Enterprise Survey microdata or disaggregated indicators.
Correlation with firm performance is not automatically causal
World Bank research reports negative associations between credit constraints and several performance measures, but it explicitly cautions against treating those relationships as simple causal effects.
Poor performance can make lenders reluctant to lend, while restricted finance can also limit firm activity. Country-level comparisons with growth or productivity should therefore preserve that two-way uncertainty.
The simple country mean is not a world firm-weighted prevalence
The 14.28% mean gives each of the 171 economies equal weight. A country with a very large formal private sector and a small economy each contribute one national percentage.
A worldwide prevalence across firms would require country firm-population weights and a consistent international aggregation method. The mean and median used here summarize the cross-country distribution only.
Source and calculation notes
The source is World Bank indicator IC.FRM.CRDC.FL.ZS from Enterprise Surveys. The classification follows the fully, partially, and unconstrained framework described in the World Bank research by Islam and Rodriguez Meza. The analysis uses 171 latest non-empty country observations and separately summarizes the 62 surveys dated 2025.
All 171 country codes are matched to geographic centroids for the map, producing a 100% match. Point size marks survey recency, and reported zeros are kept separate from economies without an observation in the dataset.
Frequently Asked Questions
Does fully credit constrained simply mean a firm has no bank loan?
No. The measure combines external-finance use with loan-application reasons and outcomes. Firms that do not need a loan because they have enough capital are not classified as constrained.
Do Enterprise Surveys cover every business?
No. The standard surveys mainly cover registered, non-agricultural formal private firms with at least five employees in manufacturing and services.
Are all 171 observations from 2025?
No. Survey years range from 2013 to 2025, with 62 observations from 2025, 48 from 2024, and 45 from 2023.
Related Articles
Green Map creates custom-edited map images using open geographic data sources such as geoBoundaries, Natural Earth, OpenStreetMap, and government open data. These maps are edited visual materials, not raw data files, and are provided for education, documents, presentations, and graphic reference.