Agriculture covers 66.73% of Clark County in the supplied 2025 land-cover summary, but the county does not read as one uninterrupted field. Forest accounts for another 23.30% and forms branching belts and irregular patches between large farm blocks. Developed areas are smaller and more concentrated around separate settlement centers. This Clark County Illinois Land Cover Map pairs those current patterns with impervious-surface and 1985–2025 class-difference views.
Four WebP previews are shown on the page, while the four original 2480 × 1754-pixel JPG maps are packaged together in one ZIP. They work well for county profiles, classroom comparison, presentations, and general land-cover reference. The asset manifest does not mark these files as meeting an A3 high-resolution reference, so a test print is sensible before using them at a large physical size.
Table of Contents
Farm cover dominates the numbers, while forest breaks up the field pattern
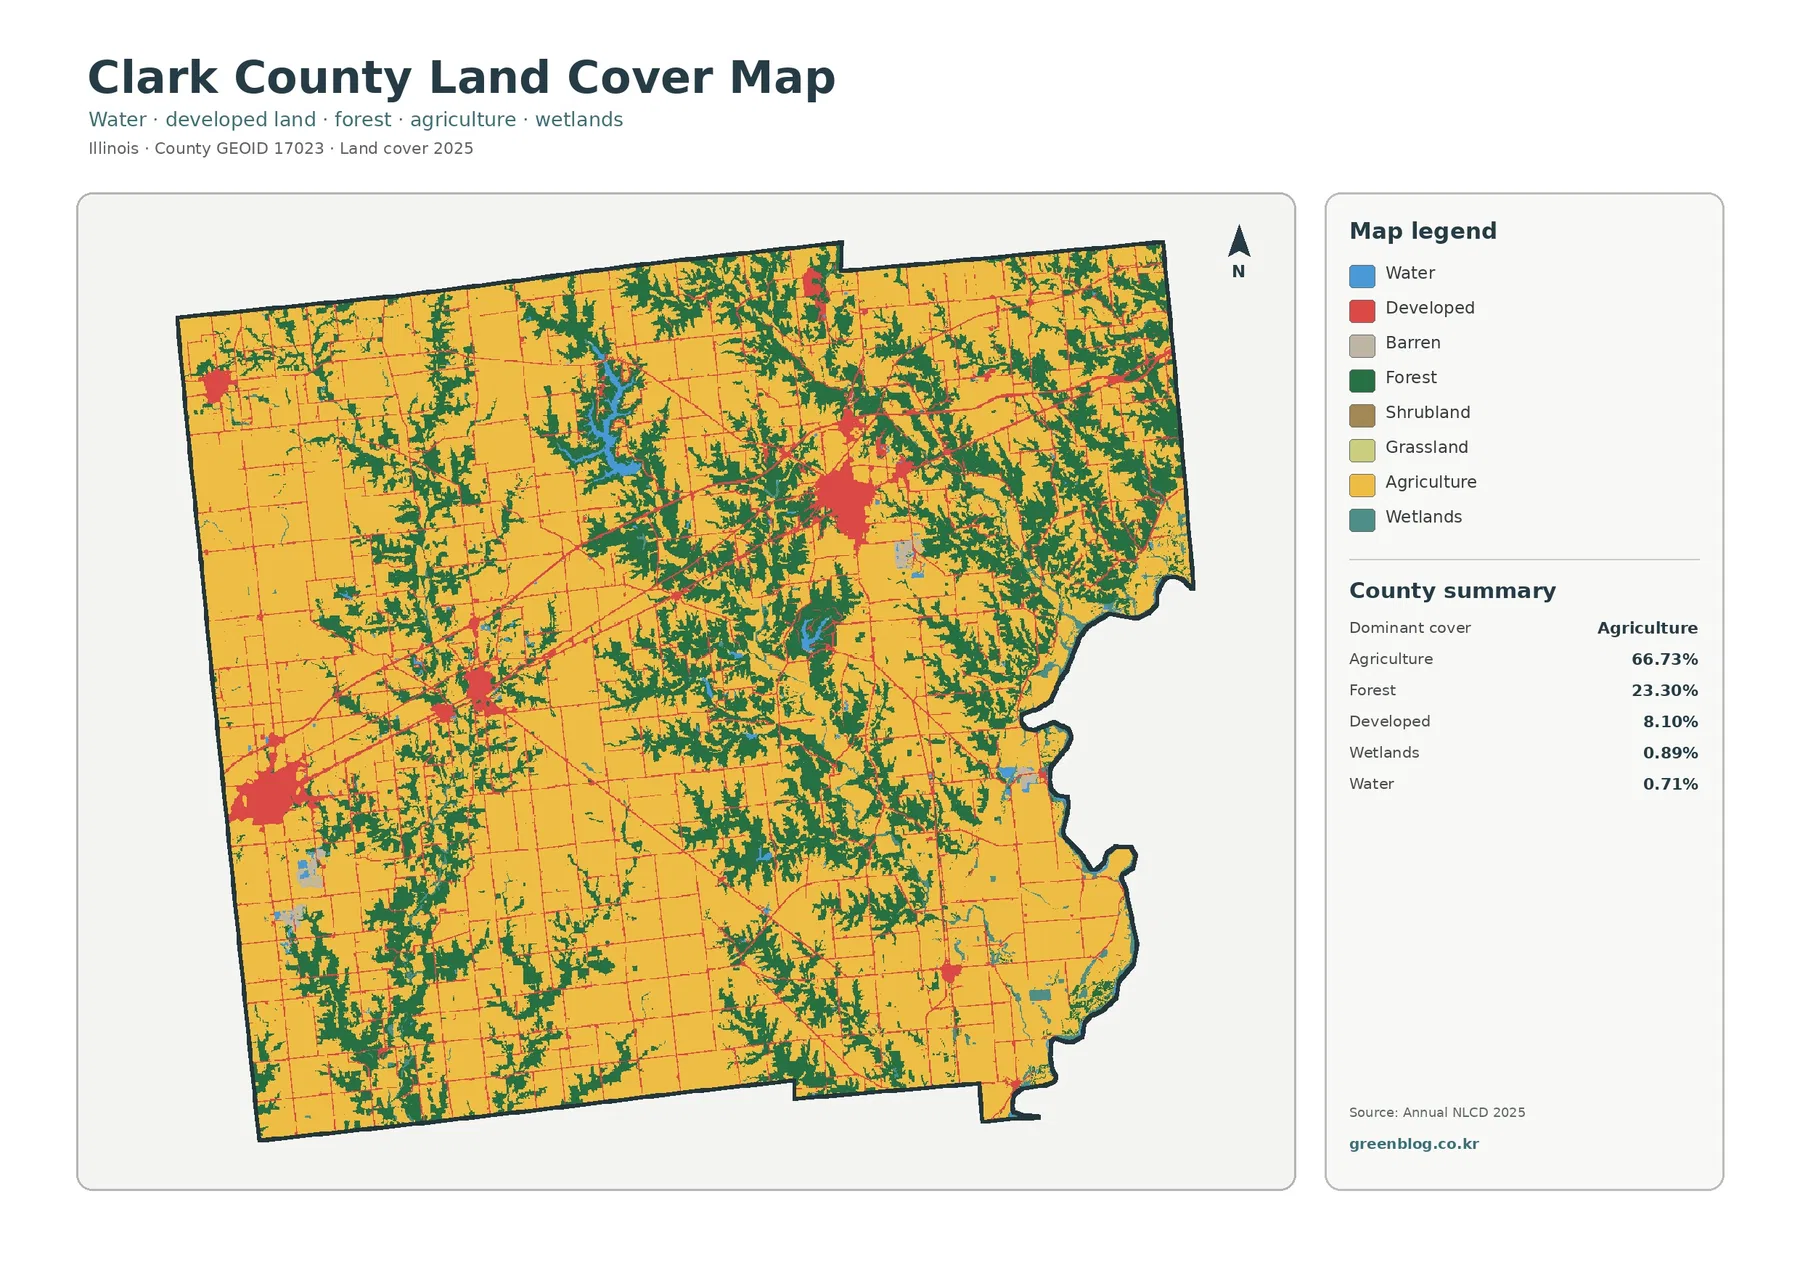
Yellow agricultural cover fills most of the county and matches the 66.73% summary. It is especially broad across the western, southern, and northern portions of the map, where large blocks create a strong rural pattern. The county is not visually uniform, however. Dark green forest repeatedly cuts into those blocks, and red developed clusters interrupt the field pattern at several distinct locations.
Forest makes up 23.30% of the current classification. Rather than sitting only in one corner, it appears as a mixture of wider patches and narrow, branching strips that extend through the interior and become especially noticeable across the central and eastern portions of the county. That shape matters as much as the percentage because it shows where natural cover remains interwoven with a largely agricultural landscape.
Developed land is 8.10%, a much smaller share than agriculture or forest. Its red cells are concentrated rather than evenly scattered. The largest cluster east of center broadly aligns with the Marshall area, a major southwest cluster aligns with Casey, and another west-central cluster is consistent with Martinsville. A smaller northwestern concentration is also visible near the part of the county where Westfield is located. These are broad geographic associations, not municipal boundary lines.
Wetlands account for 0.89% and open water for 0.71%. Blue and teal cells appear in small features and narrow corridors rather than as a dominant countywide surface. Some sit near the branching forest pattern, which is useful when comparing vegetation with drainage settings. The Illinois EPA Embarras River watershed material provides named hydrologic context for Clark County, but the land-cover preview itself should not be used to label every visible strip with a stream name.
Land cover is a surface classification, not a zoning or ownership map. A cell labeled agriculture does not identify a particular crop, farm operator, or parcel boundary. A developed cell can include lawns, trees, and open ground around buildings. Legal land use, building eligibility, flood regulation, wetland jurisdiction, and property boundaries all require different records and should not be inferred from these colors.
Hard surfaces reveal several town centers instead of one continuous urban area
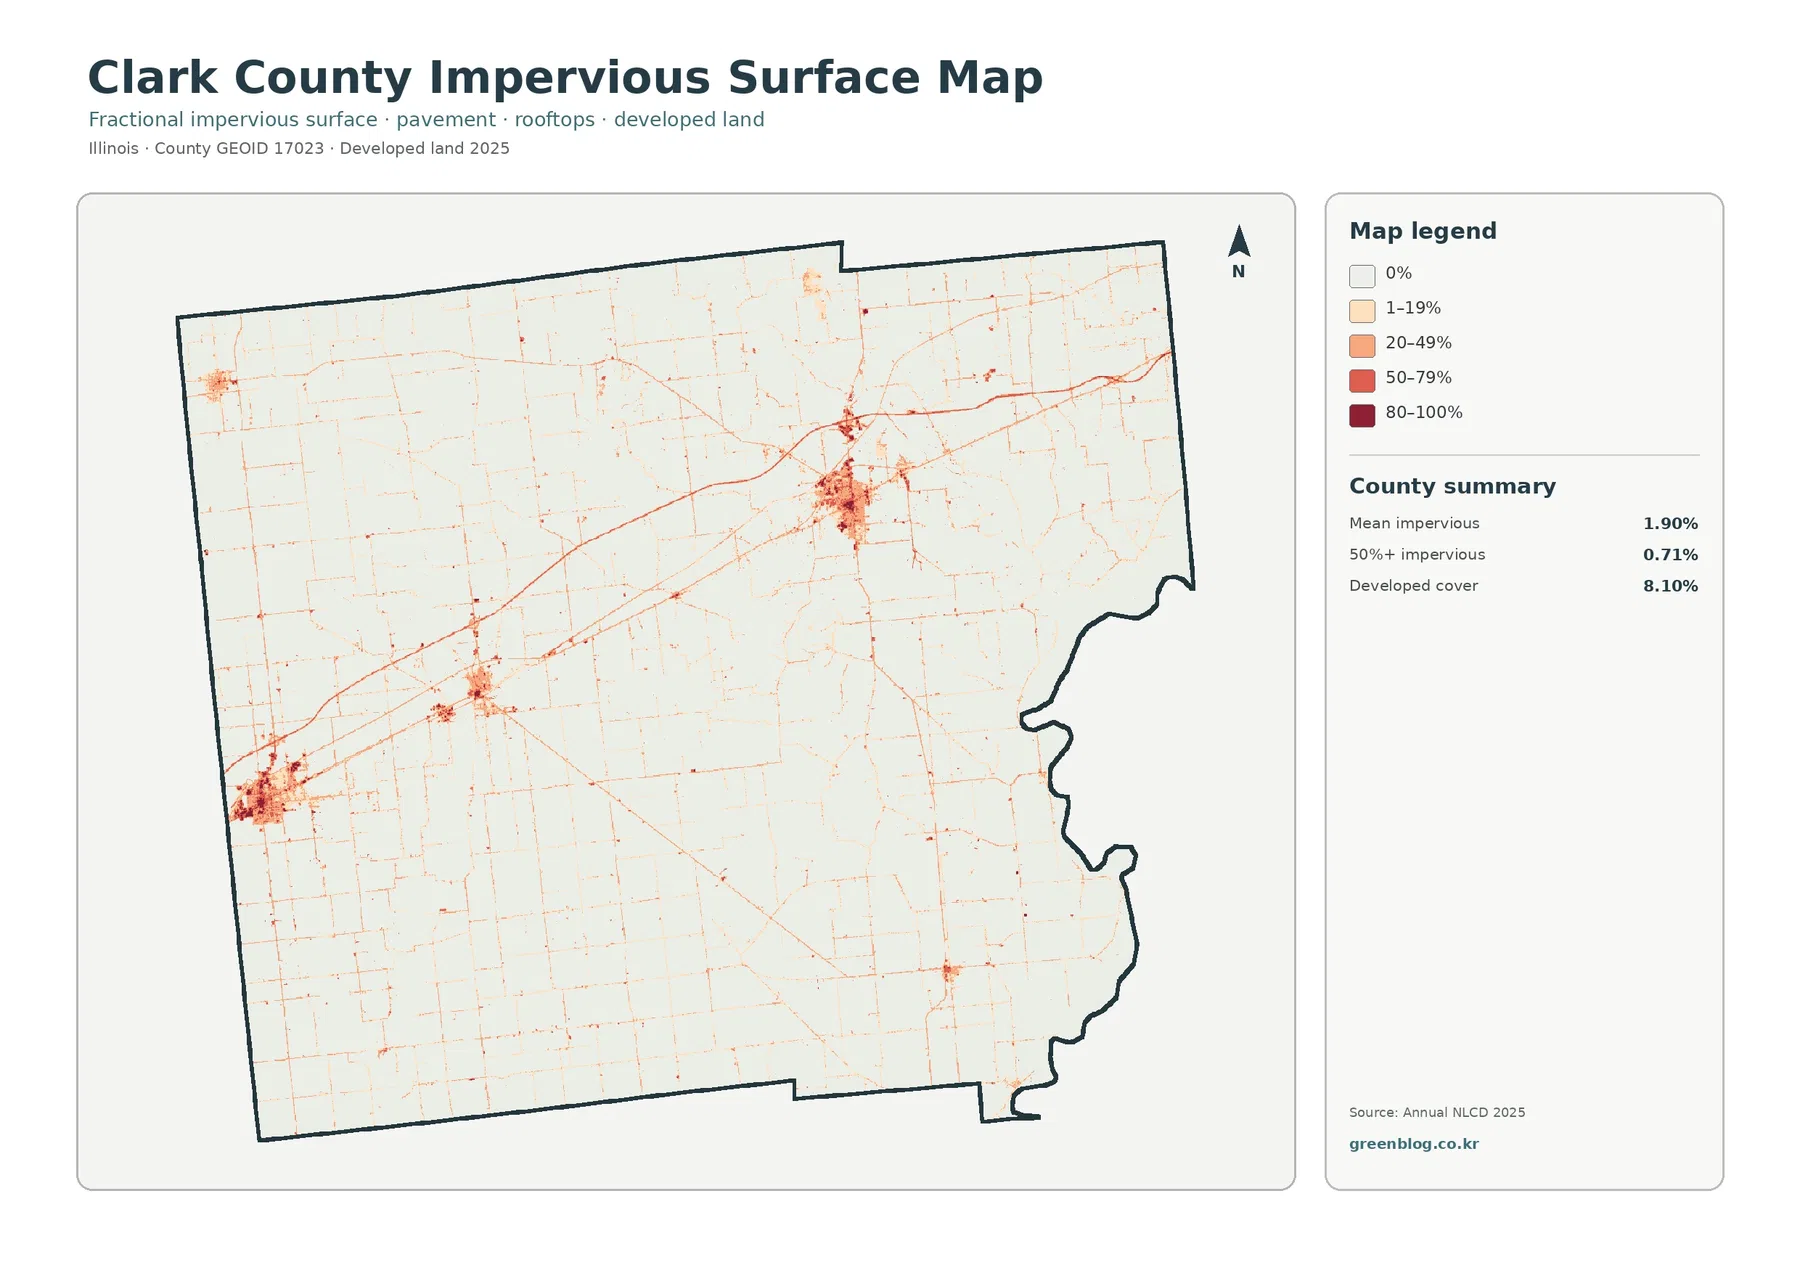
The impervious map removes much of the visual weight from farmland and forest, making built surfaces easier to compare. Mean impervious cover is 1.90%, and 0.71% of the county is mapped at 50% or greater imperviousness. Those values are lower than the 8.10% developed-cover share because developed classes can contain both hard and permeable surfaces. A residential block, for example, can include roofs and pavement along with lawns and trees.
The east-central, southwest, and west-central concentrations stand out immediately, while smaller marks appear elsewhere. The county government lists Marshall, Casey, Martinsville, Westfield, West Union, Darwin, Moonshine, and Oilfield among its communities. The major hard-surface clusters broadly correspond to the first several of those population centers, but this image has no municipal outlines, so the colored edge should never be treated as a city limit.
Thin orange and red traces connect or radiate from the stronger clusters. They resemble transportation-related hard surfaces, yet the preview does not label road names or functional classes. It is therefore safer to describe them as linear impervious features rather than assigning a highway number from appearance alone. Illinois Department of Transportation maps are the appropriate companion source when a specific route needs to be named.
A low countywide mean can hide strong local concentrations. Large rural areas near zero pull the average down, while compact town centers contain much higher percentages. For that reason, the location and continuity of the darker cells tell a clearer story about development intensity than the 1.90% mean by itself. The layer is useful for runoff context, but it is not a flood-risk map because rainfall, soil, elevation, drainage networks, and infrastructure also matter.
The 1985–2025 comparison is a class-difference screen, not a development total
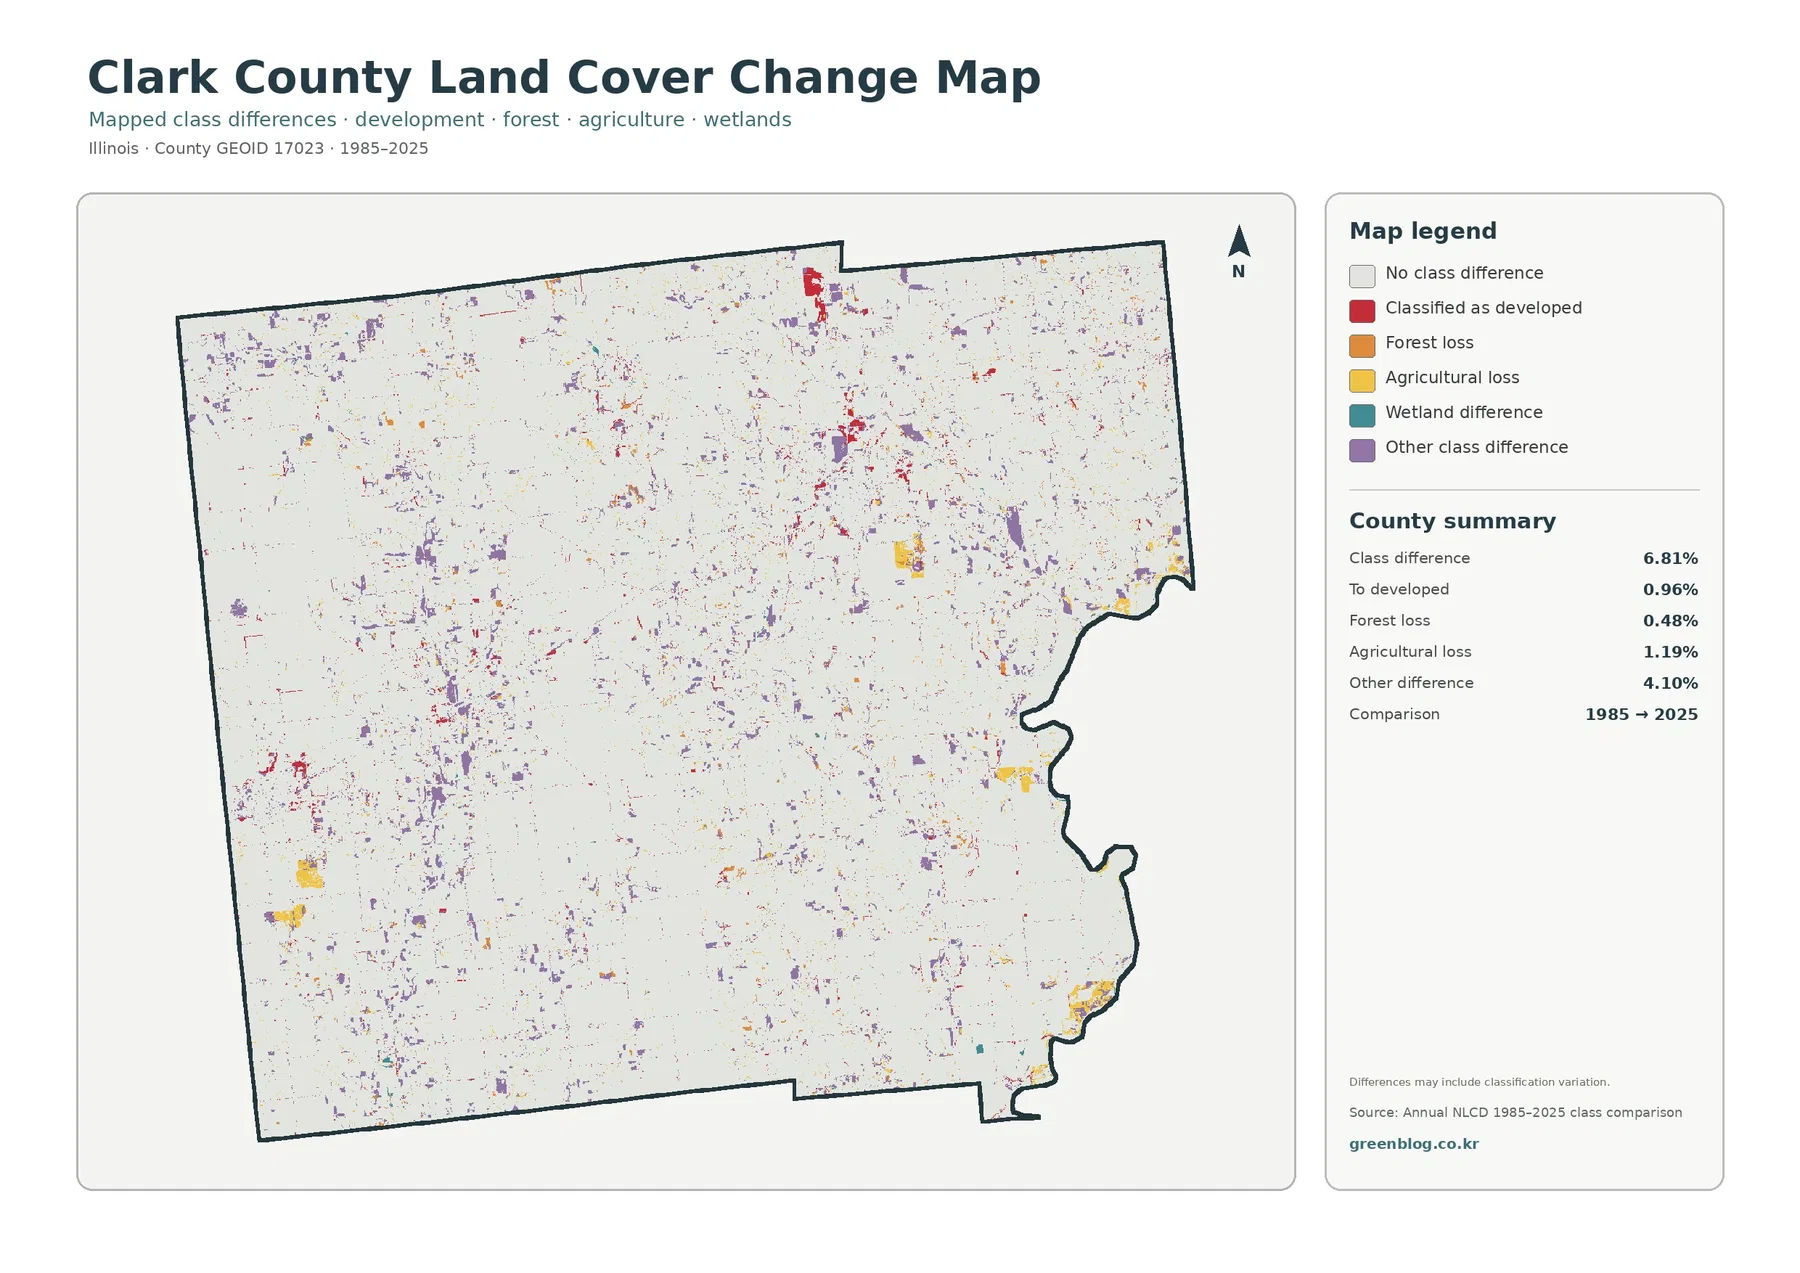
Clark County has 6.81% total class difference in the supplied comparison. The summary separately reports 0.96% classified as developed, 0.48% forest loss, 1.19% agricultural loss, and 4.10% other difference. The legend also includes wetland difference, but no independent wetland percentage is printed in the summary, so it would be inappropriate to estimate one from the colors and present it as an official statistic.
Most of the map remains in the no-class-difference background, while colored cells are scattered through many parts of the county. Red developed-conversion marks are visible around some settlement areas and in a few linear or isolated patches. Agricultural-loss colors appear in several small groups, and purple other-difference cells are widely dispersed. The result is a map of selected change locations rather than a picture of countywide replacement of one cover by another.
The word “loss” should be read narrowly. A forest-loss cell was forest at the 1985 endpoint and received another class in 2025; the map does not say whether the reason was clearing, agriculture, construction, storm damage, seasonal appearance, image quality, or classification variation. The same caution applies to agricultural loss. Intermediate-year imagery, permits, local records, and field evidence are needed to establish timing and cause.
The map itself warns that differences may include classification variation. That note is important because “other difference” at 4.10% is the largest listed component of the 6.81% total. Treating every colored cell as physical disturbance would therefore overstate what the comparison supports. A better use is to identify areas where a closer look at historical imagery or local records may be worthwhile.
Removing developed colors makes the agriculture–forest boundary easier to follow
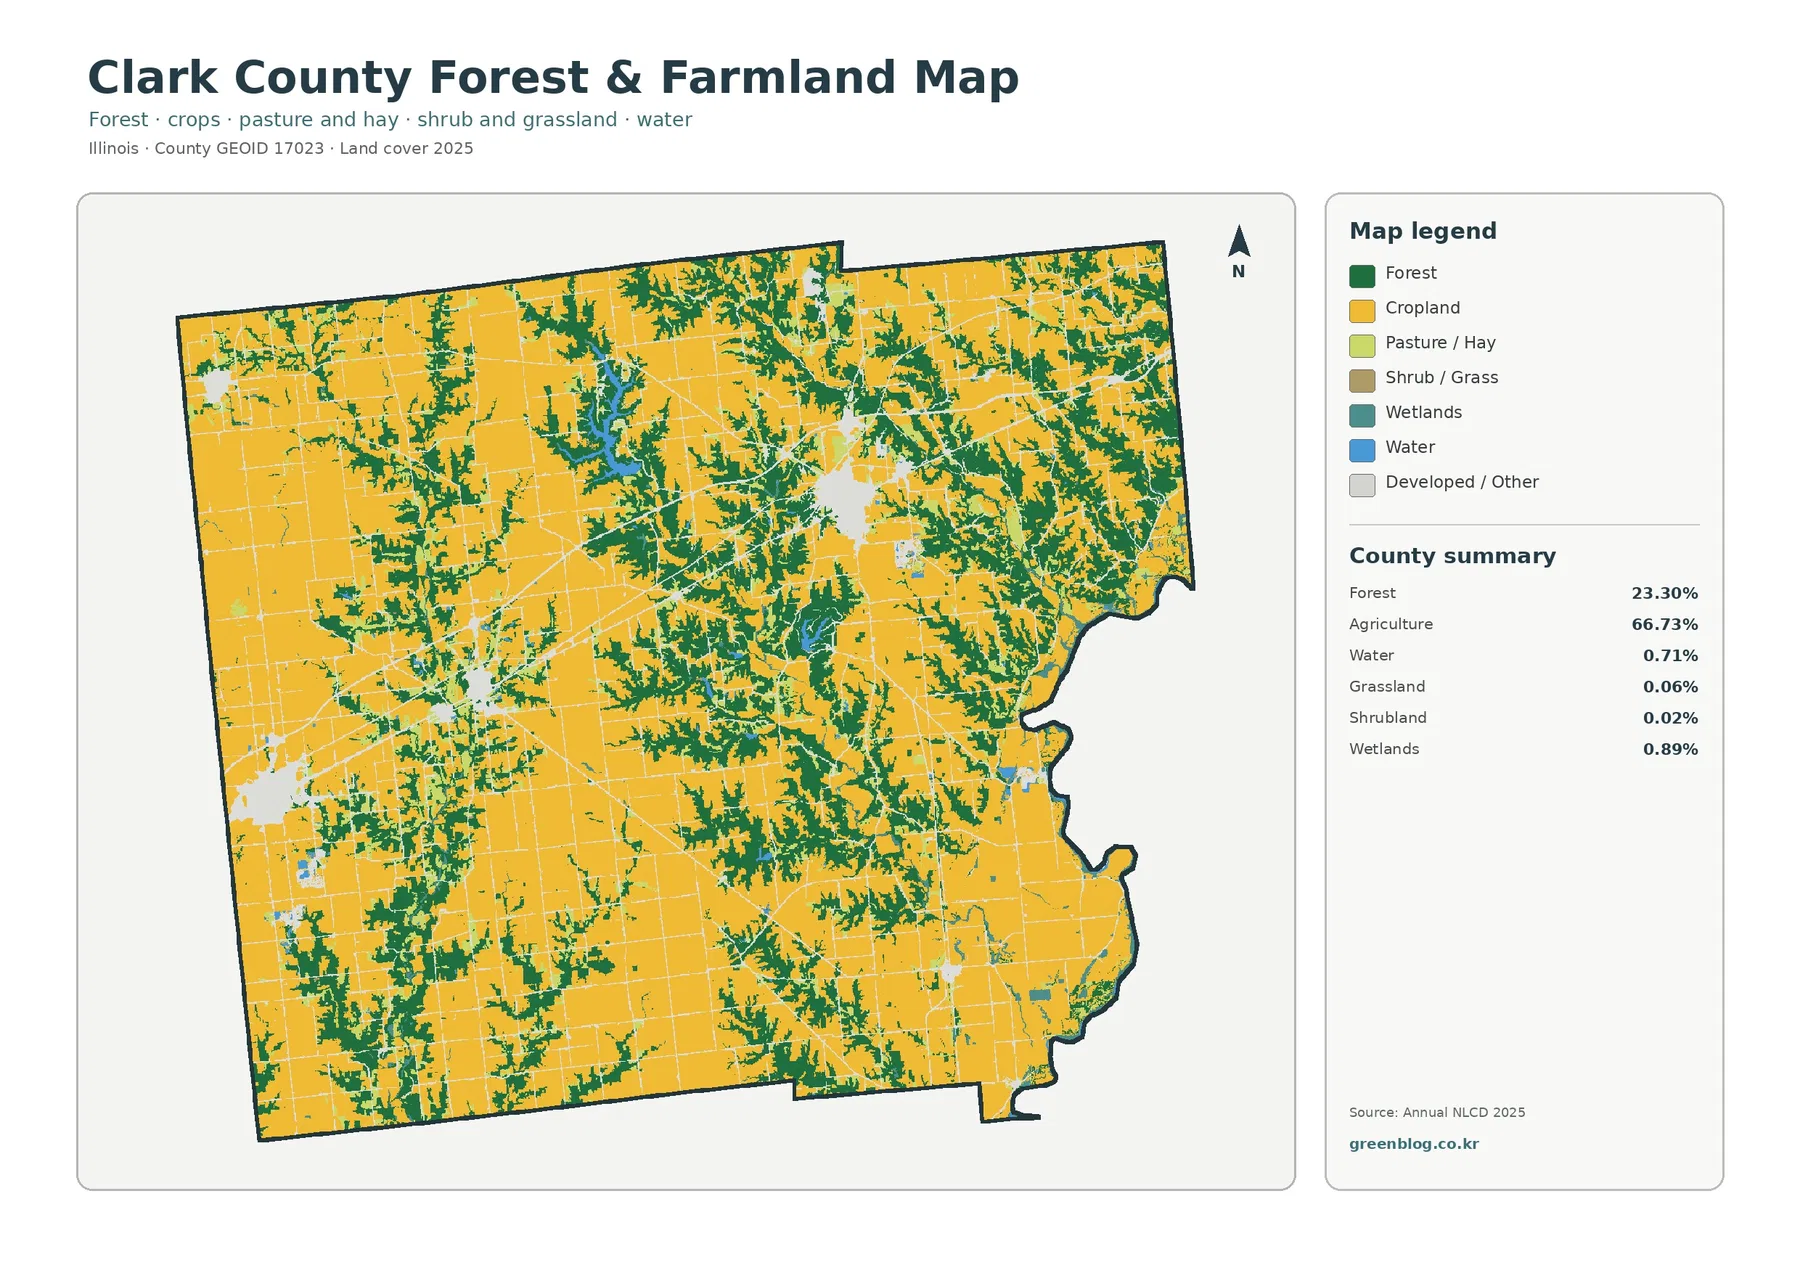
On the forest-and-farmland view, the dominant yellow farm cover becomes more continuous because developed and miscellaneous surfaces fade into the background. Dark forest then stands out along branching paths and irregular blocks. This makes it easier to see that the 23.30% forest share is not simply one reserve of trees outside the farm belt; wooded cover threads through the working landscape in many places.
Grassland is only 0.06% and shrubland 0.02% in the county summary. Those very small shares help prevent a common misreading of open land. Most of the broad open color in Clark County is classified as agriculture, not generic grassland. The map also does not identify crop species, pasture management, or ownership, so it should be used for broad surface comparison rather than a field-by-field agricultural inventory.
Wetlands at 0.89% and water at 0.71% are separate classes even though both are associated with wet conditions. Blue indicates exposed water, while wetland classes can include vegetated or seasonally saturated surfaces. Small ponds, narrow channels, tree lines, and roadside features may occupy only part of a 30-meter cell and can be absorbed into the predominant class. A detailed hydrography layer is better for tracing exact channels.
Illinois EPA watershed mapping places Clark County within the Embarras River system and shows the river and tributaries in relation to Marshall and Casey. That source gives useful context for the many wooded, branching shapes seen in the land-cover maps. The two products should still be kept distinct: one classifies surface cover, while the watershed map names water features and drainage structure at a different scale and for a different purpose.
What the four views say together about Clark County
The current summary is strongly agricultural, but the other layers prevent that single number from becoming the whole description. Agriculture covers 66.73%, forest 23.30%, and developed land 8.10%, with wetlands and water together occupying much smaller shares. The visual pattern adds another layer of meaning: forest breaks the farm matrix into many sections, development forms separate town clusters, and water-related cells appear as small but locally visible features.
For a county overview, the general 2025 map is the best starting point because every major class remains visible. The forest-and-farmland version works better when the question is how wooded cover intersects with agricultural ground. The impervious layer is more useful for comparing settlement intensity, and the endpoint-difference map belongs later in a presentation so its change colors are not confused with current land-cover classes.
Marshall serves as the county government location, and the official Clark County communities page lists Casey, Martinsville, Westfield, and several smaller communities as well. Those place names help a reader orient the broad clusters, but the land-cover package intentionally does not supply municipal polygons or named roads. If a project depends on an exact town boundary, transportation corridor, parcel, or stream, add the appropriate authoritative layer rather than stretching this map beyond its purpose.
Scale and classification limits matter when zooming in
Annual NLCD products generally use 30-meter raster cells. A raster is a grid of small squares, and each cell receives a predominant class even when several real surfaces share that space. A cell might contain crops, a tree line, a ditch, a driveway, grass, and part of a building but still display only one category. Enlarging the image increases the size of the pixels on screen; it does not create parcel-level detail that was never in the source data.
The current maps use the supplied 2025 observation year. Construction, harvest, timber work, vegetation recovery, storm effects, or water conditions after that observation period may not appear. The 1985–2025 comparison is also an endpoint comparison, so it does not identify the exact year when a cell changed. For a site-specific or time-sensitive question, recent imagery and local records should be checked.
These limitations define the right uses rather than reducing the value of the maps. They are well suited to countywide comparisons, environmental education, broad development context, and screening for areas that merit closer study. They are not substitutes for surveys, parcel records, engineering plans, legal wetland determinations, flood studies, or field verification. Keeping that distinction clear makes the maps more useful and less likely to be misread.
Using the four original JPG maps without duplicating the same message
The download contains one JPG for 2025 land cover, one focused on forest and farmland, one for impervious surface and developed land, and one for 1985–2025 class differences. Each file is 2480 × 1754 pixels. If only two images are needed, begin with the current countywide map and choose a second layer that answers a different question rather than repeating the same pattern in another palette.
A classroom sequence can start with the full legend, move to the vegetation-focused map, and then compare the 8.10% developed share with the 1.90% mean impervious value. That sequence helps explain why “developed land” and “hard surface” are related but not identical. A historical discussion can add the endpoint-difference map afterward, with a clear note that its colors represent classification differences rather than proof of a specific cause.
For printed handouts and reports, keep the original aspect ratio and check the legend at the intended size. The manifest records the JPGs as original-resolution 2480 × 1754 files but does not flag them as meeting the package’s A3 high-resolution reference. They can be useful digital and document graphics, while very large physical output should be tested with the actual printer and viewing distance in mind.
Frequently Asked Questions
Is Clark County almost entirely farmland?
Agriculture is the largest class at 66.73%, but forest still covers 23.30% and forms a conspicuous branching pattern through the farm-dominated landscape. Developed land adds another 8.10% in concentrated settlement areas. Calling the county “agricultural” is reasonable at a broad scale, but calling it uniformly farmland would miss the wooded corridors and separate town clusters visible in the maps.
Why is developed cover 8.10% when mean impervious cover is only 1.90%?
Developed land can include both hard and permeable surfaces around homes, businesses, roads, and other built areas. Lawns, trees, and exposed soil may occur inside a developed class. Impervious percentage focuses more narrowly on roofs, pavement, parking areas, and similar hard surfaces, so the countywide mean can be much lower than the broader developed-cover share.
Does the 6.81% class difference mean 6.81% of Clark County was developed or damaged after 1985?
No. The 6.81% figure is the total share of cells whose endpoint class differs between 1985 and 2025. Only 0.96% is specifically listed as classified as developed, while 0.48% is forest loss, 1.19% agricultural loss, and 4.10% other difference. The comparison may also include classification variation, so it should be used as a screening layer rather than a direct measure of damage.
Sources and Reference Data
- MRLC Annual NLCD Data – official access point for annual land-cover and comparison products
- USGS Annual NLCD Land Cover Classification – class definitions and guidance for agriculture, forest, developed land, wetlands, and related categories
- U.S. Census Bureau TIGER/Line Shapefiles – official county-boundary reference for Clark County
- Clark County, Illinois – Communities – official county list including Casey, Marshall, Martinsville, Westfield, and other communities
- Illinois EPA – Embarras River Watershed – watershed and named-river context for the Clark County area
- Illinois Department of Transportation – General Highway Maps – official road-network context when a route needs to be identified
Map File Information
The ZIP contains four original JPG maps for comparing Clark County agriculture, branching forest cover, town-centered development and impervious surfaces, and 1985–2025 class differences.
- Included Files: General land cover, forest and farmland, impervious/developed surface, and land-cover change maps
- File Type: Four original JPG map files bundled in one ZIP archive
- Intended Use: Printing, education, presentations, and map-based projects
Related Maps
- Adams County Illinois Land Cover Map
- Alexander County Illinois Land Cover Map
- Bond County Illinois Land Cover Map
Green Map creates custom-edited map images using open geographic data sources such as geoBoundaries, Natural Earth, OpenStreetMap, and government open data. These maps are edited visual materials, not raw data files, and are provided for education, documents, presentations, and graphic reference.