U.S. primary energy production was highly concentrated in a small group of states in 2024. The 50 states and the District of Columbia in this EIA State Energy Data System slice sum to 98861232 billion Btu, or about 98.861 quadrillion Btu. Texas leads with 28288241 billion Btu, followed by Pennsylvania at 9911312, New Mexico at 8522809, West Virginia at 6301950, and Wyoming at 5195486 billion Btu. Texas alone accounts for about 28.6% of this 51-jurisdiction sum.
Primary energy production is not the same thing as electricity generation or end-use energy consumption. SEDS adds state production of coal, crude oil, marketed natural gas, nuclear electric power energy, and renewable energy after converting those sources into common Btu units. The result provides a broad measure of the scale of the energy supply base located within each state.
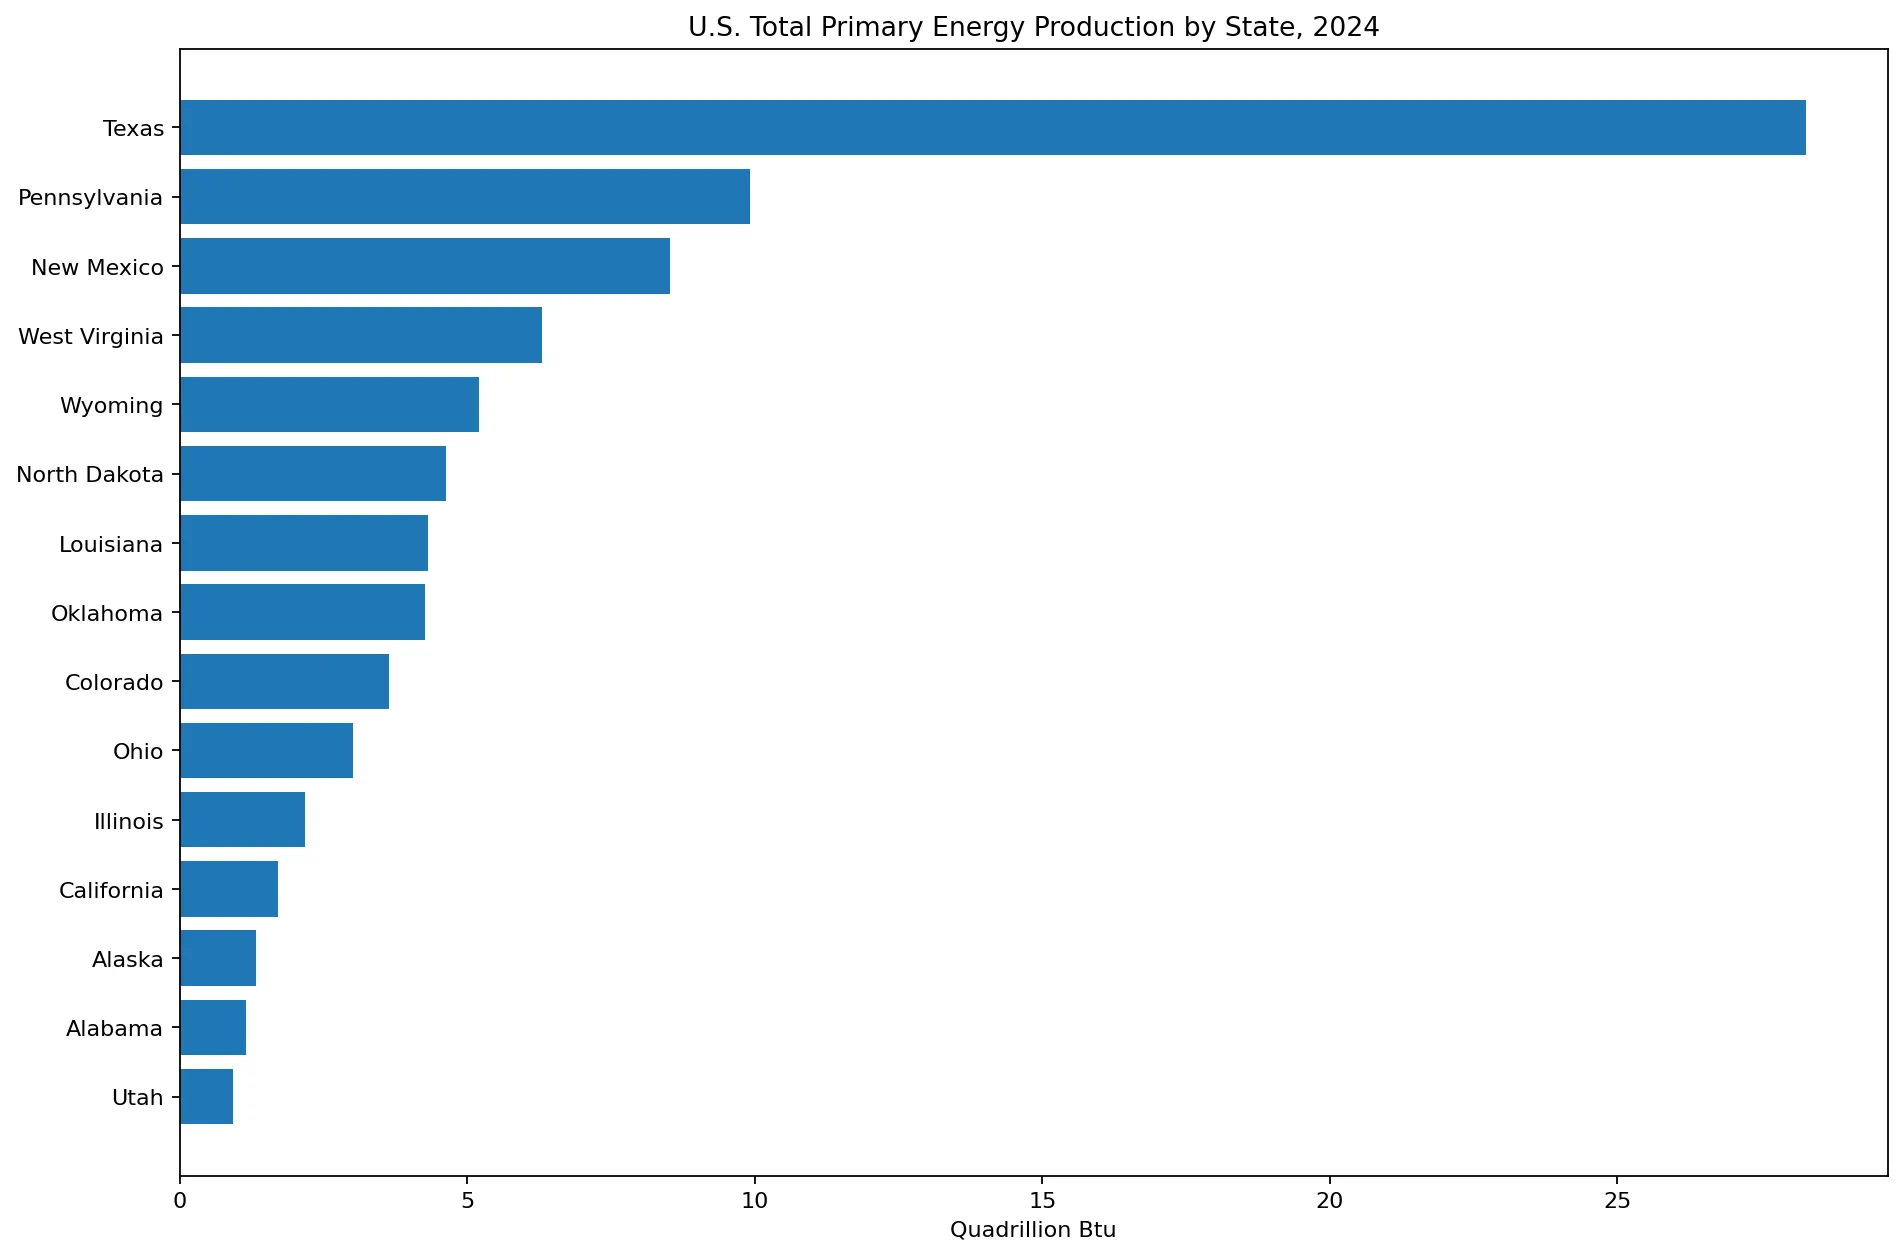
Table of Contents
What primary energy production means
Primary energy is energy accounted for at the source before it is transformed into another energy carrier for final use. In SEDS, total primary energy production combines coal production, crude oil production, marketed natural gas production, nuclear electric-power energy, and renewable energy production. Because these sources have very different physical units, EIA converts them into Btu before adding them.
Production answers a different question from consumption. A state can produce much more energy than it uses and send fuels or electricity to other states, while another state can consume large amounts of energy even though its own primary energy production is small. State production therefore describes supply geography rather than the location of final demand.
The measure is broader than electric generation. Crude oil and natural gas can be used in transportation, industry, buildings, and power generation, while nuclear and many renewable energy sources enter the accounting largely through electricity production. The indicator is best understood as an overall state energy-supply measure.
Texas produces about 28.29 quadrillion Btu
Texas records 28288241 billion Btu, equivalent to about 28.288 quadrillion Btu. That is roughly 2.85 times Pennsylvania’s 9.911 quadrillion Btu and represents 28.6% of the sum of the 51 jurisdictions in this dataset. Texas combines very large crude oil and natural gas production with substantial renewable energy production, giving it an unusually broad and large energy supply base.
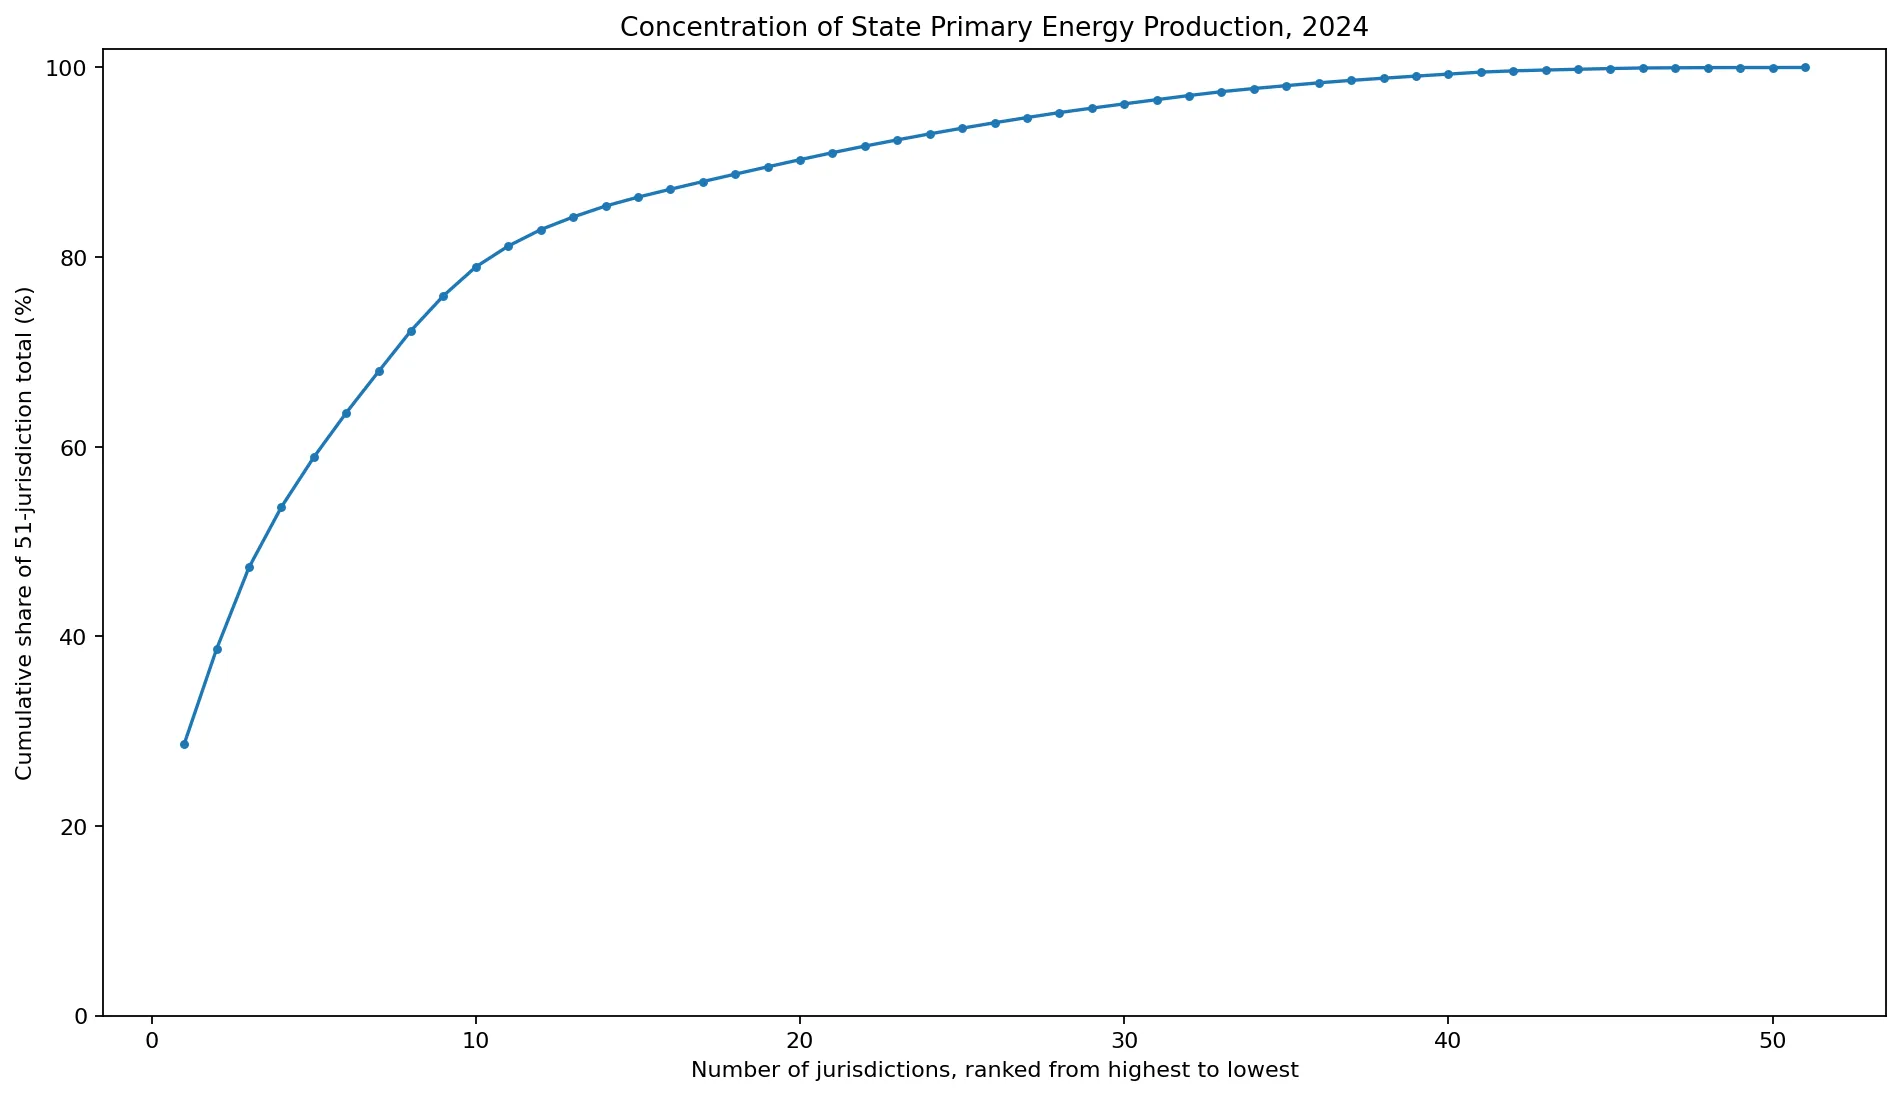
Pennsylvania ranks second at 9911312 billion Btu and New Mexico third at 8522809. Together, the top three account for about 47.3% of the 51-jurisdiction sum. Adding West Virginia and Wyoming raises the top-five share to about 58.9%. More than half of the state-and-D.C. total is therefore concentrated in five states.
North Dakota, Louisiana, Oklahoma, Colorado, and Ohio complete the top ten. The first ten jurisdictions together account for about 79.0% of the total in this state slice. This extreme concentration means an unweighted state average does not describe a typical state very well.
The top ten account for about 79% of the state-and-D.C. total
Cumulative shares rise quickly. Texas alone contributes 28.6%, the top three 47.3%, the top five 58.9%, and the top ten 79.0%. The remaining 41 jurisdictions share only about 21% of the combined value. U.S. primary energy production is therefore geographically concentrated in a relatively small number of major producing states.
This pattern is not a population ranking. Energy production depends heavily on geology, resource endowments, wind and water resources, nuclear plant locations, infrastructure, land availability, and the historical development of energy industries. Wyoming and North Dakota therefore rank far above many much more populous states.
The median is far below the mean
The unweighted mean across the 51 jurisdictions is about 1938456 billion Btu, while the median is only 566659. The mean is roughly 3.42 times the median because Texas and several other very large producers stretch the upper tail. The middle 50% of jurisdictions lie between about 221918 and 1231220 billion Btu.
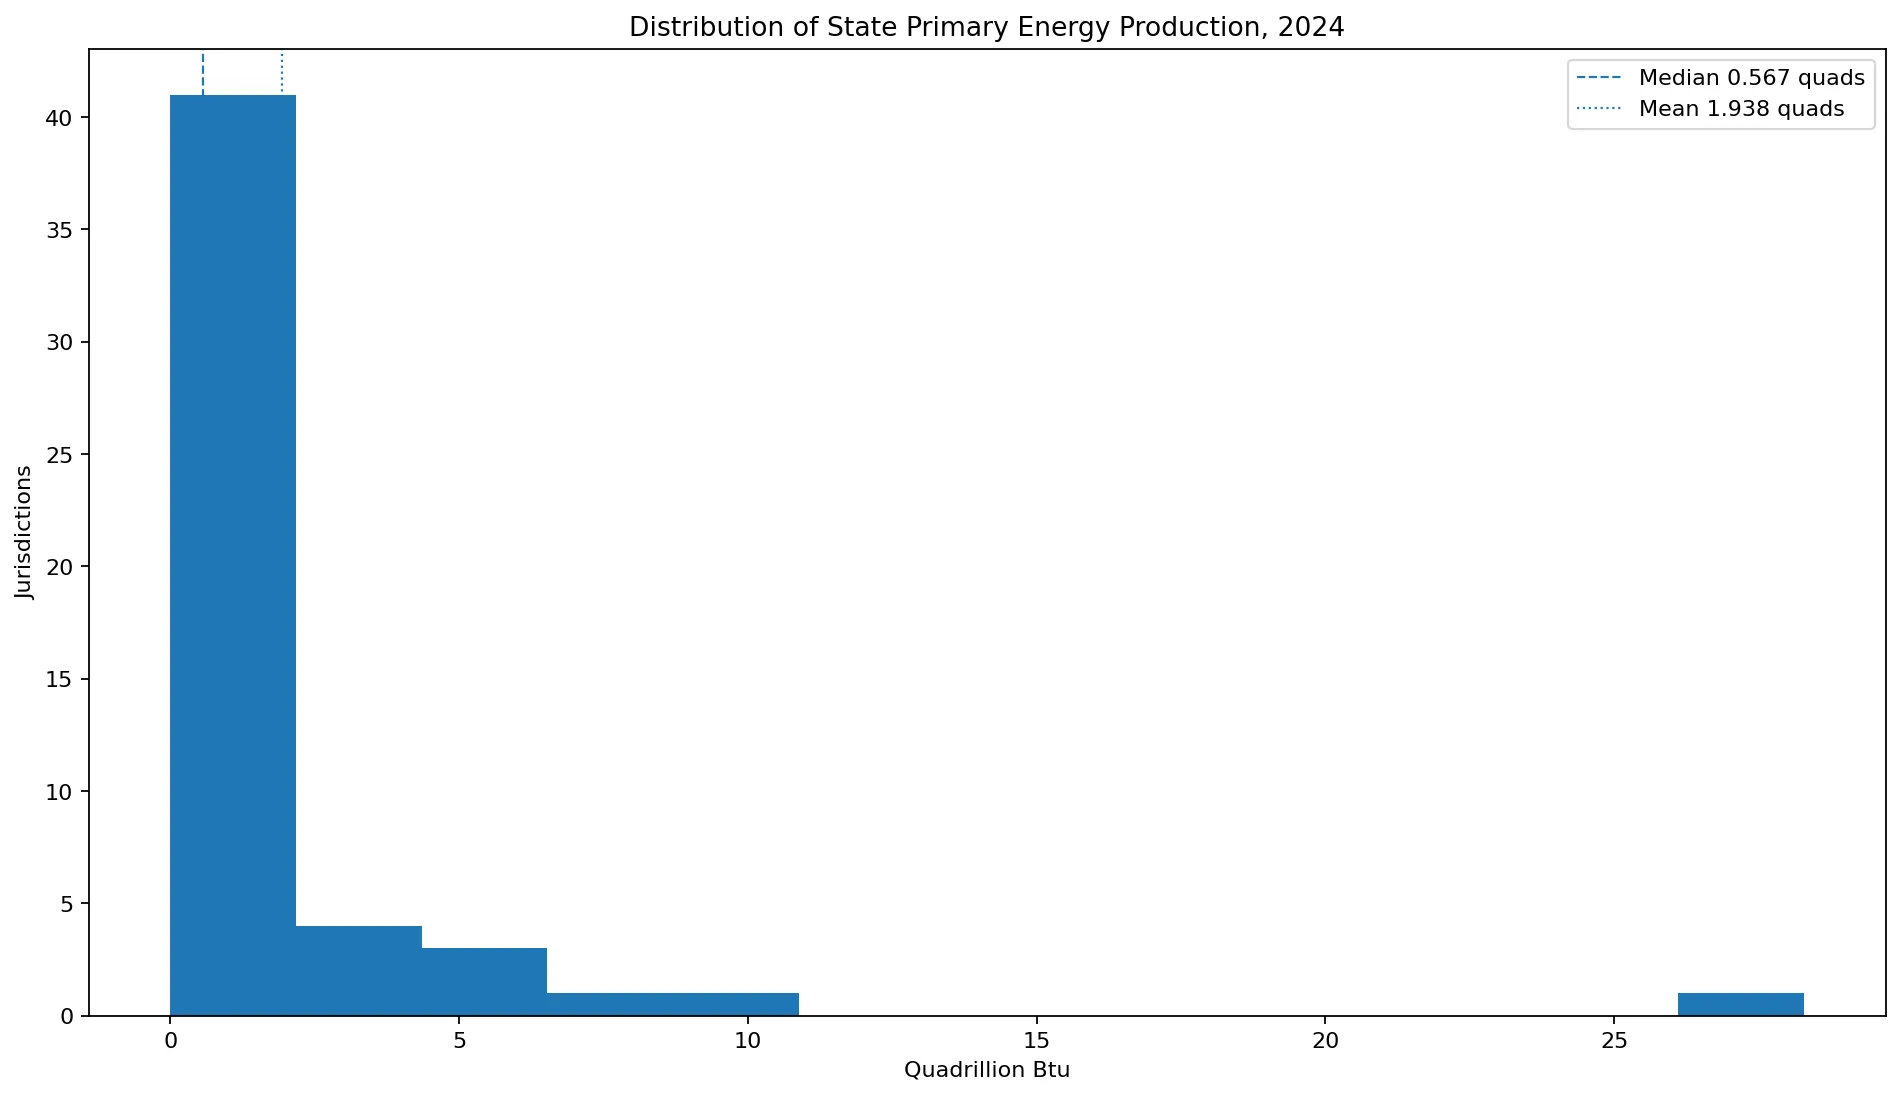
For a description of a typical state, the median is more informative than the mean alone. For understanding national supply concentration, the sum and cumulative shares of major producing states are more useful. Those statistics answer different questions and should be read together.
The smallest values are in D.C. and Delaware
At the lower end, the District of Columbia records 1907 billion Btu and Delaware 2932. Rhode Island follows at 7929, Hawaii at 17856, Vermont at 18841, Massachusetts at 58773, Nevada at 76291, Idaho at 77508, Maine at 88440, and New Hampshire at 132485 billion Btu.
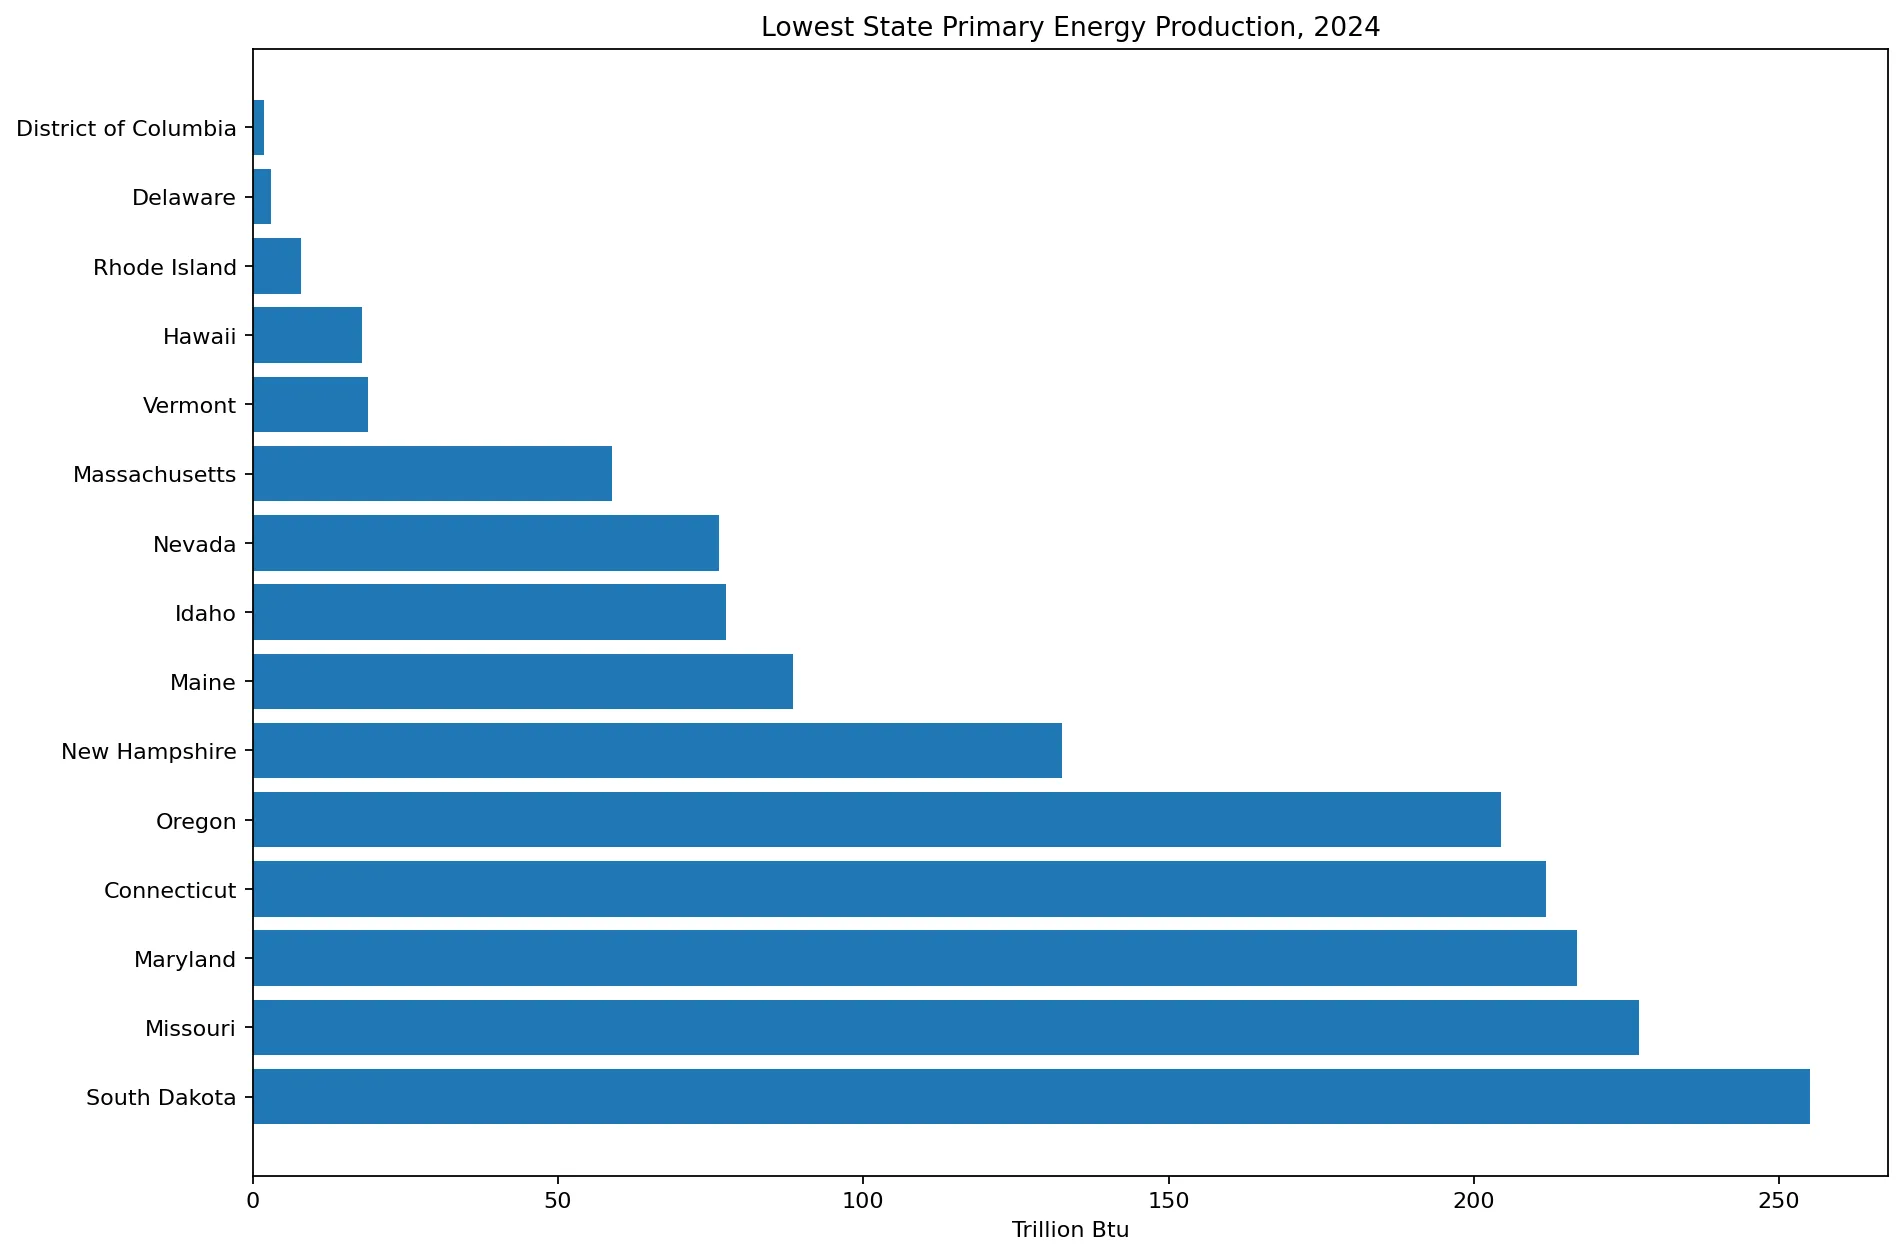
Low production does not imply low energy consumption. A state or district can import electricity and fuels from other parts of the country or from abroad. Large service-oriented or urban economies can have substantial energy demand without a large local primary energy production base.
Why the 51-jurisdiction sum is not the official U.S. total
The 51 observations in this dataset sum to about 98.861 quadrillion Btu. EIA’s SEDS technical documentation explicitly notes that the U.S. primary energy production total is not equal to the sum of state values. Federal offshore crude oil and natural gas production and certain biofuels available only at the U.S. level are included in the national total but are not allocated to individual states.
For that reason, Texas’s 28.6% share in this article is a share of the 50-state-plus-D.C. sum, not necessarily 28.6% of EIA’s official U.S. total. Analyses of the national energy balance should use the national SEDS or Monthly Energy Review totals rather than reconstructing the U.S. total from the state rows.
U.S. production exceeded consumption in 2024
EIA reported that total U.S. primary energy production exceeded consumption in 2024 and that net energy exports reached a record high. That national surplus does not mean every state was a net supplier. The country combines very large producing states such as Texas, Pennsylvania, New Mexico, West Virginia, and Wyoming with states whose consumption is much larger than their own production.
SEDS also provides a state calculation of total primary energy consumption minus total primary energy production. The balance reflects interstate energy flows, international trade, and stock changes, making it useful for distinguishing major supply states from major demand states.
Nuclear and renewable energy are included
Primary energy production should not be equated with fossil-fuel extraction. SEDS includes nuclear electric power and renewable energy alongside coal, crude oil, and marketed natural gas. A state with limited fossil resources can therefore record meaningful primary energy production through nuclear, hydroelectric, wind, solar, biomass, or geothermal energy.
For noncombustible renewable electricity, EIA’s conversion methodology matters in long historical comparisons. Recent SEDS data use the captured energy approach for sources such as wind, solar, hydroelectric, and geothermal electricity. A user comparing 2024 with much older years should check the methodological notes before interpreting small changes.
How to use the official EIA tables
EIA’s SEDS complete-data page provides 2024 state primary energy production in both physical and Btu units. The Total Energy Production technical notes define total primary energy production as the sum of coal, crude oil, marketed natural gas, nuclear, and renewable energy and explain why the national total contains production not allocated to states.
All 51 jurisdictions in 2024
The table below lists the 50 states and the District of Columbia from the largest to the smallest 2024 primary energy production value. The unit is billion Btu.
| Rank | State | Code | Year | Billion Btu |
|---|---|---|---|---|
| 1 | Texas | TX | 2024 | 28288241 |
| 2 | Pennsylvania | PA | 2024 | 9911312 |
| 3 | New Mexico | NM | 2024 | 8522809 |
| 4 | West Virginia | WV | 2024 | 6301950 |
| 5 | Wyoming | WY | 2024 | 5195486 |
| 6 | North Dakota | ND | 2024 | 4630474 |
| 7 | Louisiana | LA | 2024 | 4317884 |
| 8 | Oklahoma | OK | 2024 | 4256887 |
| 9 | Colorado | CO | 2024 | 3634286 |
| 10 | Ohio | OH | 2024 | 3011962 |
| 11 | Illinois | IL | 2024 | 2172437 |
| 12 | California | CA | 2024 | 1708706 |
| 13 | Alaska | AK | 2024 | 1319631 |
| 14 | Alabama | AL | 2024 | 1142809 |
| 15 | Utah | UT | 2024 | 925535 |
| 16 | Iowa | IA | 2024 | 825517 |
| 17 | Virginia | VA | 2024 | 797822 |
| 18 | Georgia | GA | 2024 | 776457 |
| 19 | Montana | MT | 2024 | 762038 |
| 20 | Indiana | IN | 2024 | 748639 |
| 21 | Kentucky | KY | 2024 | 726666 |
| 22 | South Carolina | SC | 2024 | 690219 |
| 23 | Arkansas | AR | 2024 | 643744 |
| 24 | North Carolina | NC | 2024 | 627290 |
| 25 | Kansas | KS | 2024 | 594654 |
| 26 | Michigan | MI | 2024 | 566659 |
| 27 | Florida | FL | 2024 | 540812 |
| 28 | New York | NY | 2024 | 519895 |
| 29 | Washington | WA | 2024 | 460799 |
| 30 | Tennessee | TN | 2024 | 449129 |
| 31 | Arizona | AZ | 2024 | 434023 |
| 32 | Minnesota | MN | 2024 | 434014 |
| 33 | Nebraska | NE | 2024 | 400785 |
| 34 | New Jersey | NJ | 2024 | 328612 |
| 35 | Wisconsin | WI | 2024 | 300347 |
| 36 | Mississippi | MS | 2024 | 294412 |
| 37 | South Dakota | SD | 2024 | 255122 |
| 38 | Missouri | MO | 2024 | 226980 |
| 39 | Maryland | MD | 2024 | 216856 |
| 40 | Connecticut | CT | 2024 | 211882 |
| 41 | Oregon | OR | 2024 | 204488 |
| 42 | New Hampshire | NH | 2024 | 132485 |
| 43 | Maine | ME | 2024 | 88440 |
| 44 | Idaho | ID | 2024 | 77508 |
| 45 | Nevada | NV | 2024 | 76291 |
| 46 | Massachusetts | MA | 2024 | 58773 |
| 47 | Vermont | VT | 2024 | 18841 |
| 48 | Hawaii | HI | 2024 | 17856 |
| 49 | Rhode Island | RI | 2024 | 7929 |
| 50 | Delaware | DE | 2024 | 2932 |
| 51 | District of Columbia | DC | 2024 | 1907 |
Frequently Asked Questions
Which state had the highest primary energy production in 2024?
Texas was highest at 28288241 billion Btu, about 28.6% of the combined 50-state and D.C. sum in this dataset.
What is included in total primary energy production?
EIA SEDS combines coal, crude oil, marketed natural gas, nuclear electric power energy, and renewable energy production in common Btu units.
Does the sum of all state values equal the official U.S. total?
No. Federal offshore crude oil and natural gas production and certain biofuels are included only at the U.S. level and are not allocated to individual states.
Does high primary energy production mean high energy consumption?
Not necessarily. Production measures the local supply base, while consumption measures energy use. A major producing state can export energy to other states.
Related Articles
Green Map creates custom-edited map images using open geographic data sources such as geoBoundaries, Natural Earth, OpenStreetMap, and government open data. These maps are edited visual materials, not raw data files, and are provided for education, documents, presentations, and graphic reference.