Life expectancy at birth is one of the clearest summary measures of mortality conditions, but it needs to be read carefully. The UNDP Human Development Report 2025 dataset provides 195 country and territory observations for 2023. The highest value is Monaco at 86.37 years, while the lowest is Nigeria at 54.46 years. The median is 73.57 years and the simple country average is 73.18 years. Because every row refers to 2023, this comparison does not mix current observations with older reference years.
A value of 80 years does not mean that every baby born in 2023 is predicted to live exactly 80 years. Life expectancy at birth is a period life-table measure: it asks how long a newborn would live on average if the age-specific mortality rates observed around the reference year remained unchanged throughout that person’s life. Mortality patterns can later improve or worsen, so the eventual experience of a real birth cohort can be different. The indicator is best understood as a compact measure of current mortality conditions rather than a personal forecast.
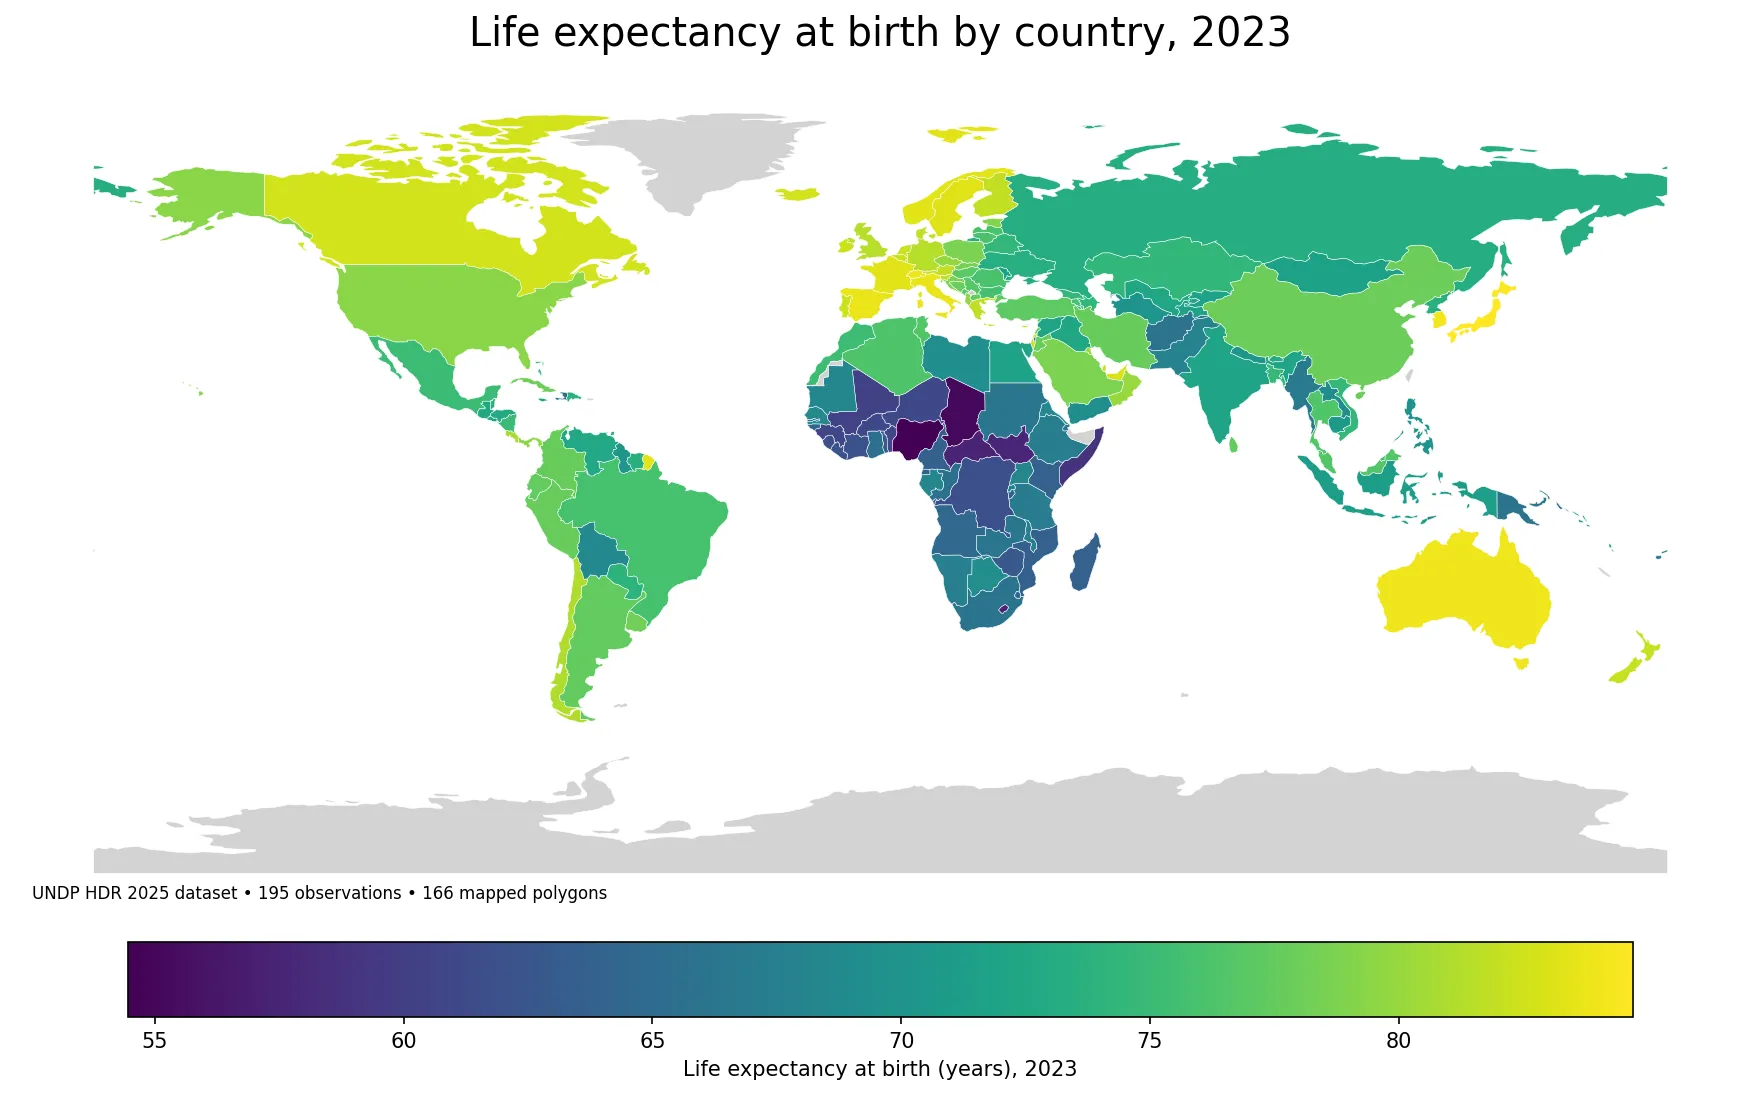
Table of Contents
What life expectancy at birth measures
UNDP uses life expectancy at birth as the health indicator in the Human Development Index. The concept is based on age-specific mortality rates across the whole life course. Infant and child mortality matter, but so do deaths among young adults, working-age adults and older people. A reduction in premature deaths at any age can raise the measure, while a broad mortality shock can lower it. This is why life expectancy can summarize many different health and social risks in one number.
The same strength is also a limitation. Life expectancy is an outcome measure, not a diagnosis of why mortality is high or low. Medical care, vaccination, sanitation, nutrition, housing, education, road safety, violence, environmental exposures, smoking, alcohol, obesity and income conditions can all affect mortality. Two countries with similar life expectancy can therefore arrive at that result through very different patterns of disease and death.
The highest values cluster in the mid-80s
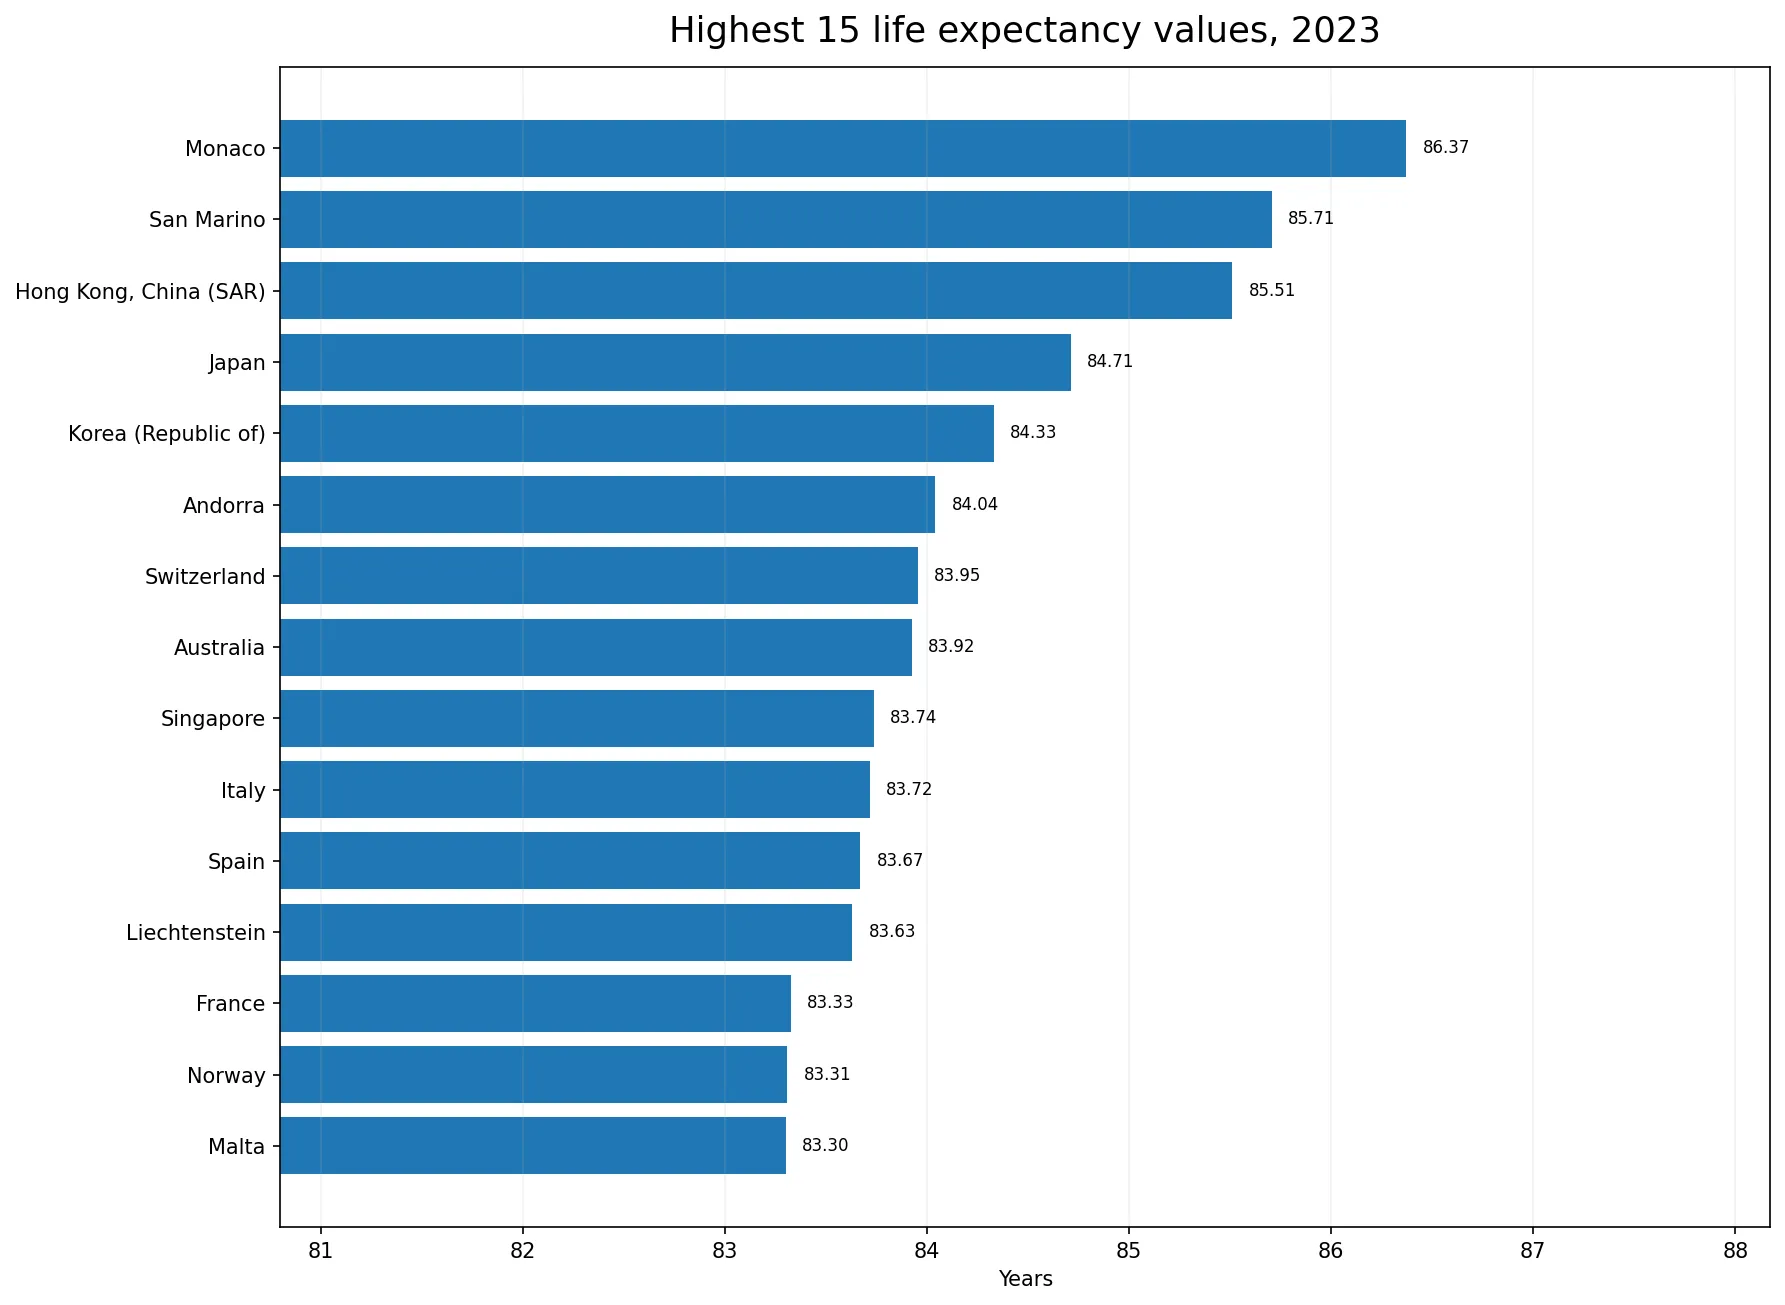
At the top of the 2023 distribution, Monaco records 86.37 years, San Marino 85.71 and Hong Kong, China (SAR) 85.51. Japan follows at 84.71 years, Korea (Republic of) at 84.33, Andorra at 84.04, Switzerland at 83.95, Australia at 83.92, Singapore at 83.74 and Italy at 83.72. Only three observations are at least 85 years, while 41 reach 80 years or more.
The small gaps among many high-value countries are important to keep in perspective. A difference of a few tenths of a year does not by itself establish that one health system is broadly better than another. Population composition, mortality measurement, recent shocks and cause-specific patterns can all matter. The top group is useful for describing the observed distribution, but explaining why a country is near the top requires more detailed evidence than a single life-expectancy figure.
Six observations remain below 60 years
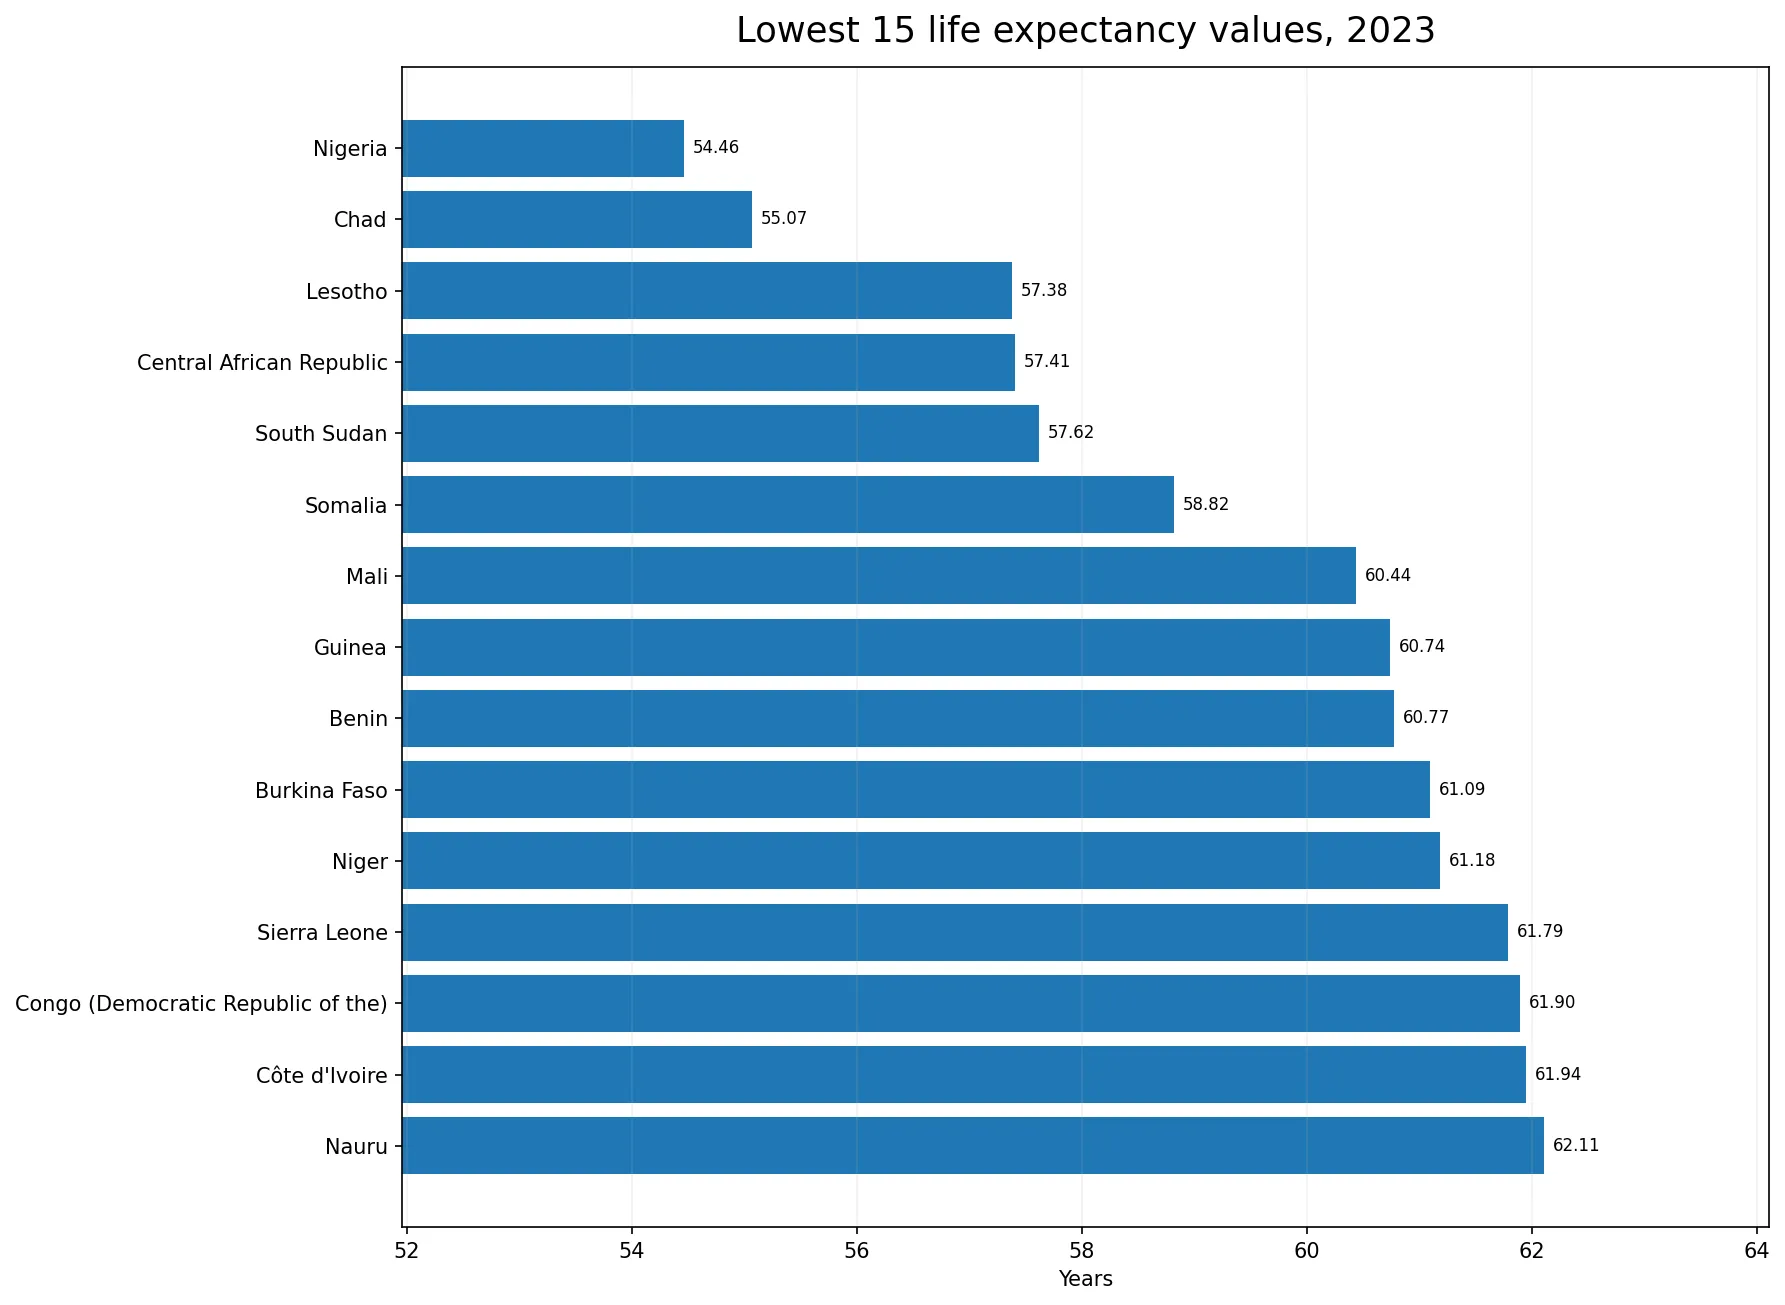
The lower tail is much farther from the global middle. Nigeria records 54.46 years, Chad 55.07, Lesotho 57.38, Central African Republic 57.41, South Sudan 57.62 and Somalia 58.82. These are the six observations below 60 years. Twenty-eight observations are below 65 years, including Mali, Guinea, Benin, Burkina Faso, Niger, Sierra Leone, Democratic Republic of the Congo and Côte d’Ivoire.
A low national value should not be reduced to a single disease or a single measure of health spending. Premature mortality can reflect infectious disease, maternal and child health risks, malnutrition, chronic disease, conflict and violence, injuries, access to safe water and sanitation, health-service access and wider economic and social conditions. National averages also hide differences between regions, sexes and income groups. The figure shows the overall mortality outcome, not which subgroup or cause contributes most.
Most observations fall between 70 and 80 years
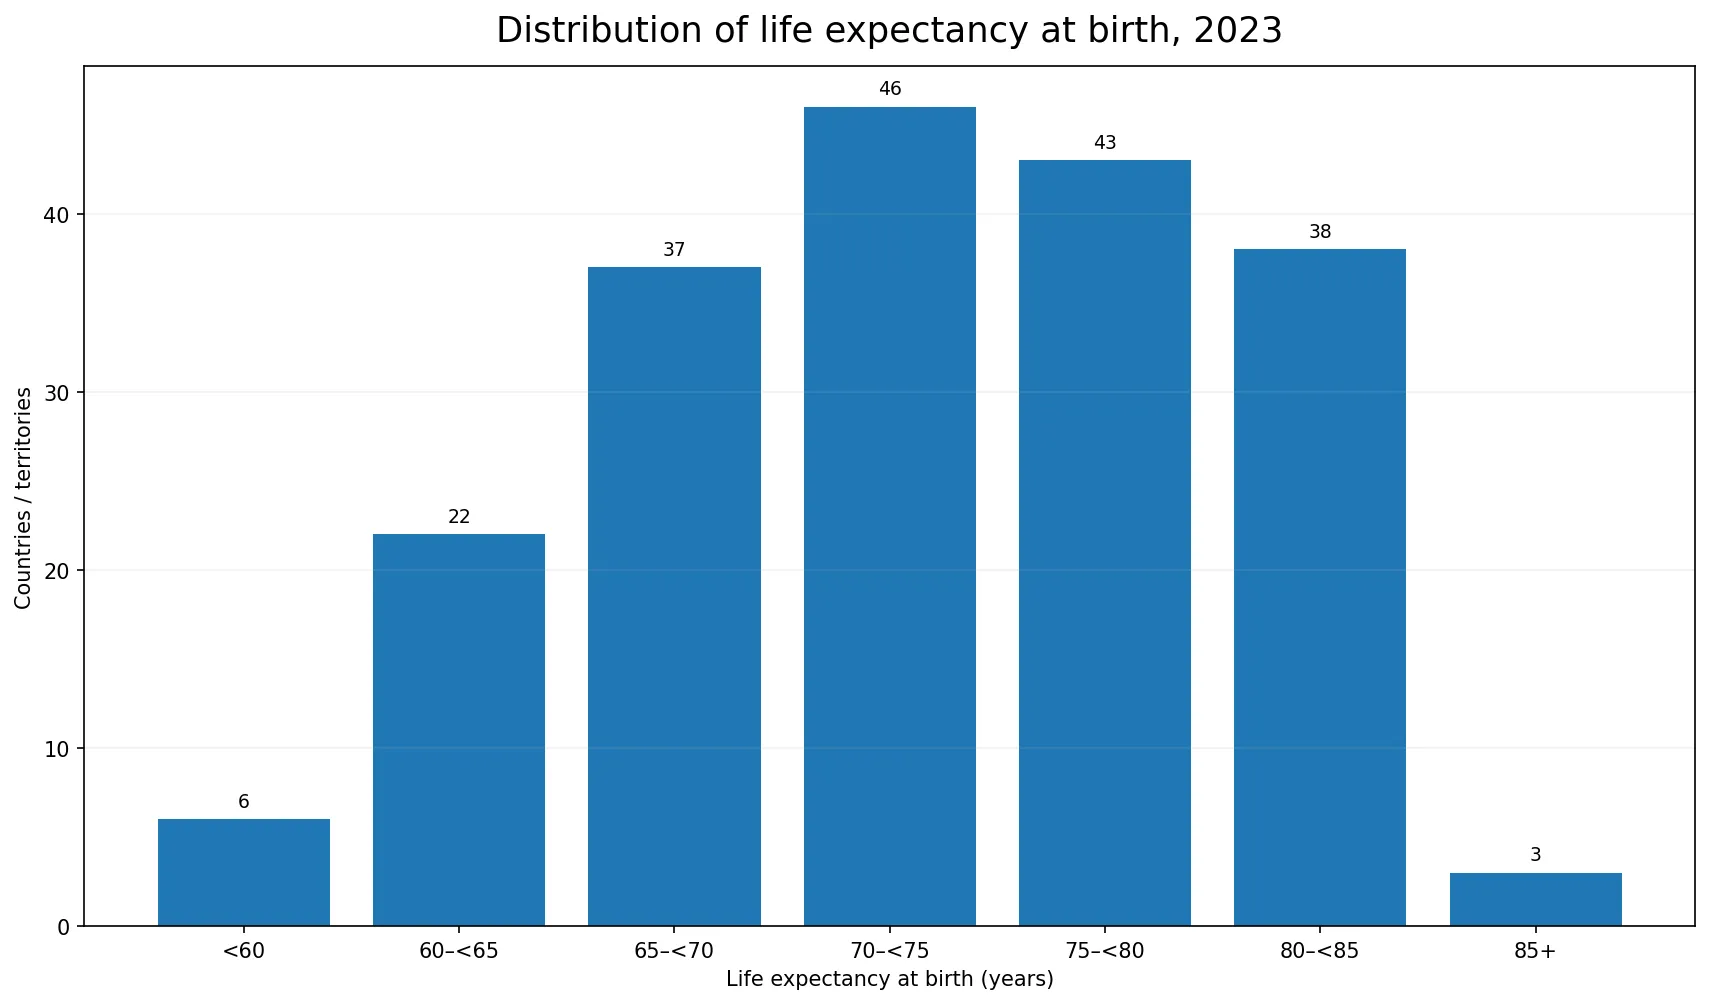
Grouping the 195 observations shows 6 below 60 years, 22 from 60 to under 65, 37 from 65 to under 70, 46 from 70 to under 75, 43 from 75 to under 80, 38 from 80 to under 85 and 3 at 85 years or more. The single largest interval is 70 to under 75 years. Altogether 130 observations reach at least 70 years, while 65 remain below 70.
The first quartile is 67.52 years and the third quartile is 78.46, so the middle half of the country and territory observations lies roughly between those two values. The mean of 73.18 years and median of 73.57 are close, but the full range is wide: more than 31 years separate the minimum and maximum. A global-looking average therefore cannot substitute for the shape of the country distribution.
Major-country examples within the full distribution
A few large economies illustrate how positions differ within the same 2023 distribution. Japan records 84.71 years, France 83.33, Canada 82.63, Germany 81.38 and the United States 79.30. China is at 77.95, Brazil at 75.85 and India at 72.00. These are unweighted country observations. Their simple average is not the same thing as world population life expectancy, which would require population weighting and a different aggregation method.
Country ranking should also not be treated as an all-purpose health ranking. Life expectancy captures mortality, but it does not directly measure disability, years lived in poor health, mental health, quality of care, financial protection or inequality in access. Two countries can have similar life expectancy and very different healthy-life expectancy, disease burdens and within-country gaps.
Life expectancy is not the average age at death
Life expectancy at birth is often confused with the average age of people who died in a particular year. The two measures answer different questions. The average age at death is strongly shaped by the current age structure: an older population naturally has more deaths at older ages. Period life expectancy instead combines age-specific mortality rates in a standardized hypothetical life table, reducing the direct effect of how many people happen to be in each age group.
That distinction matters when countries have very different demographic structures. A young population and an old population can have similar age-specific mortality at some ages but very different average ages at death. Life expectancy provides a more comparable summary of mortality rates, although it can still be affected by data quality, incomplete death registration and statistical estimation. Small decimal differences should therefore be read with caution, especially where vital-registration systems are less complete.
A single 2023 value cannot establish a trend
This dataset is a cross-section: it compares countries and territories at one reference year. It cannot by itself show that a country’s life expectancy is rising or falling. To make a trend claim, the same indicator must be compared across multiple years. A high 2023 value does not guarantee continued improvement, and a low value does not tell us whether the country recently declined, recovered or remained stable.
Trend analysis is especially important around major mortality shocks. Pandemic years, conflicts, disasters or abrupt economic disruptions can temporarily move life expectancy, while long-run changes in cardiovascular mortality, smoking, vaccination, maternal health or living standards operate over different time scales. A complete explanation therefore needs both the 2023 level and a time series, ideally alongside cause-of-death and age-specific mortality data.
What this measure does not tell us
Life expectancy says nothing directly about how many of those years are lived in good health. A country can add years of life while also having a substantial burden of disability or chronic disease. Healthy life expectancy, disability-adjusted measures and cause-specific disease indicators answer different questions. The metric also does not reveal inequalities hidden inside the national average, such as gaps by sex, income, ethnicity, region or education.
It is also not a direct measure of health-care spending efficiency. Higher spending may support better access and treatment, but expenditure levels are only one input among many. Public health, primary care, prevention, social conditions and behavior all contribute. The safest interpretation is that life expectancy summarizes the mortality outcome generated by a broad set of conditions, while separate indicators are needed to identify mechanisms.
All 195 country and territory observations
The table below lists the 195 observations from the UNDP Human Development Report 2025 dataset, all for 2023, sorted from highest to lowest life expectancy at birth. Very small countries and territories may be hard to see on the low-resolution map, but no observation is removed from the table. Values are shown to two decimal places for readability.
| Rank | Country / territory | Year | Life expectancy at birth (years) |
|---|---|---|---|
| 1 | Monaco | 2023 | 86.37 |
| 2 | San Marino | 2023 | 85.71 |
| 3 | Hong Kong, China (SAR) | 2023 | 85.51 |
| 4 | Japan | 2023 | 84.71 |
| 5 | Korea (Republic of) | 2023 | 84.33 |
| 6 | Andorra | 2023 | 84.04 |
| 7 | Switzerland | 2023 | 83.95 |
| 8 | Australia | 2023 | 83.92 |
| 9 | Singapore | 2023 | 83.74 |
| 10 | Italy | 2023 | 83.72 |
| 11 | Spain | 2023 | 83.67 |
| 12 | Liechtenstein | 2023 | 83.63 |
| 13 | France | 2023 | 83.33 |
| 14 | Norway | 2023 | 83.31 |
| 15 | Malta | 2023 | 83.30 |
| 16 | Sweden | 2023 | 83.26 |
| 17 | United Arab Emirates | 2023 | 82.91 |
| 18 | Iceland | 2023 | 82.69 |
| 19 | Canada | 2023 | 82.63 |
| 20 | Ireland | 2023 | 82.41 |
| 21 | Israel | 2023 | 82.41 |
| 22 | Qatar | 2023 | 82.37 |
| 23 | Portugal | 2023 | 82.36 |
| 24 | Luxembourg | 2023 | 82.23 |
| 25 | Netherlands | 2023 | 82.16 |
| 26 | Belgium | 2023 | 82.11 |
| 27 | New Zealand | 2023 | 82.09 |
| 28 | Austria | 2023 | 81.96 |
| 29 | Denmark | 2023 | 81.93 |
| 30 | Finland | 2023 | 81.91 |
| 31 | Greece | 2023 | 81.86 |
| 32 | Cyprus | 2023 | 81.65 |
| 33 | Slovenia | 2023 | 81.60 |
| 34 | Germany | 2023 | 81.38 |
| 35 | United Kingdom | 2023 | 81.30 |
| 36 | Bahrain | 2023 | 81.28 |
| 37 | Chile | 2023 | 81.17 |
| 38 | Maldives | 2023 | 81.04 |
| 39 | Costa Rica | 2023 | 80.80 |
| 40 | Kuwait | 2023 | 80.41 |
| 41 | Oman | 2023 | 80.03 |
| 42 | Czechia | 2023 | 79.83 |
| 43 | Albania | 2023 | 79.60 |
| 44 | Panama | 2023 | 79.59 |
| 45 | United States | 2023 | 79.30 |
| 46 | Estonia | 2023 | 79.15 |
| 47 | Saudi Arabia | 2023 | 78.73 |
| 48 | Poland | 2023 | 78.63 |
| 49 | Croatia | 2023 | 78.58 |
| 50 | Slovakia | 2023 | 78.34 |
| 51 | Uruguay | 2023 | 78.14 |
| 52 | Cuba | 2023 | 78.08 |
| 53 | China | 2023 | 77.95 |
| 54 | Bosnia and Herzegovina | 2023 | 77.85 |
| 55 | Lebanon | 2023 | 77.82 |
| 56 | Jordan | 2023 | 77.81 |
| 57 | Peru | 2023 | 77.74 |
| 58 | Colombia | 2023 | 77.72 |
| 59 | Iran (Islamic Republic of) | 2023 | 77.65 |
| 60 | Antigua and Barbuda | 2023 | 77.60 |
| 61 | Sri Lanka | 2023 | 77.48 |
| 62 | Argentina | 2023 | 77.39 |
| 63 | North Macedonia | 2023 | 77.39 |
| 64 | Ecuador | 2023 | 77.39 |
| 65 | Türkiye | 2023 | 77.16 |
| 66 | Montenegro | 2023 | 77.09 |
| 67 | Hungary | 2023 | 77.02 |
| 68 | Serbia | 2023 | 76.77 |
| 69 | Malaysia | 2023 | 76.66 |
| 70 | Tunisia | 2023 | 76.51 |
| 71 | Thailand | 2023 | 76.41 |
| 72 | Algeria | 2023 | 76.26 |
| 73 | Latvia | 2023 | 76.19 |
| 74 | Barbados | 2023 | 76.18 |
| 75 | Cabo Verde | 2023 | 76.06 |
| 76 | Lithuania | 2023 | 76.03 |
| 77 | Romania | 2023 | 75.94 |
| 78 | Brazil | 2023 | 75.85 |
| 79 | Armenia | 2023 | 75.68 |
| 80 | Bulgaria | 2023 | 75.64 |
| 81 | Brunei Darussalam | 2023 | 75.33 |
| 82 | Morocco | 2023 | 75.31 |
| 83 | Grenada | 2023 | 75.20 |
| 84 | Mexico | 2023 | 75.07 |
| 85 | Nicaragua | 2023 | 74.95 |
| 86 | Mauritius | 2023 | 74.93 |
| 87 | Bangladesh | 2023 | 74.67 |
| 88 | Viet Nam | 2023 | 74.59 |
| 89 | Bahamas | 2023 | 74.55 |
| 90 | Georgia | 2023 | 74.50 |
| 91 | Belarus | 2023 | 74.43 |
| 92 | Azerbaijan | 2023 | 74.43 |
| 93 | Kazakhstan | 2023 | 74.40 |
| 94 | Paraguay | 2023 | 73.84 |
| 95 | Dominican Republic | 2023 | 73.72 |
| 96 | Korea (Democratic People's Rep. of) | 2023 | 73.64 |
| 97 | Suriname | 2023 | 73.63 |
| 98 | Belize | 2023 | 73.57 |
| 99 | Trinidad and Tobago | 2023 | 73.49 |
| 100 | Ukraine | 2023 | 73.42 |
| 101 | Russian Federation | 2023 | 73.15 |
| 102 | Bhutan | 2023 | 72.97 |
| 103 | Tonga | 2023 | 72.89 |
| 104 | Honduras | 2023 | 72.88 |
| 105 | Seychelles | 2023 | 72.86 |
| 106 | Saint Lucia | 2023 | 72.70 |
| 107 | Guatemala | 2023 | 72.60 |
| 108 | Venezuela (Bolivarian Republic of) | 2023 | 72.51 |
| 109 | Uzbekistan | 2023 | 72.39 |
| 110 | Iraq | 2023 | 72.32 |
| 111 | Saint Kitts and Nevis | 2023 | 72.14 |
| 112 | Syrian Arab Republic | 2023 | 72.12 |
| 113 | El Salvador | 2023 | 72.10 |
| 114 | India | 2023 | 72.00 |
| 115 | Tajikistan | 2023 | 71.79 |
| 116 | Mongolia | 2023 | 71.73 |
| 117 | Samoa | 2023 | 71.70 |
| 118 | Kyrgyzstan | 2023 | 71.68 |
| 119 | Egypt | 2023 | 71.63 |
| 120 | Jamaica | 2023 | 71.48 |
| 121 | Vanuatu | 2023 | 71.48 |
| 122 | Saint Vincent and the Grenadines | 2023 | 71.23 |
| 123 | Moldova (Republic of) | 2023 | 71.20 |
| 124 | Indonesia | 2023 | 71.15 |
| 125 | Dominica | 2023 | 71.13 |
| 126 | Cambodia | 2023 | 70.67 |
| 127 | Solomon Islands | 2023 | 70.53 |
| 128 | Nepal | 2023 | 70.35 |
| 129 | Guyana | 2023 | 70.18 |
| 130 | Turkmenistan | 2023 | 70.07 |
| 131 | Philippines | 2023 | 69.83 |
| 132 | Sao Tome and Principe | 2023 | 69.72 |
| 133 | Libya | 2023 | 69.34 |
| 134 | Yemen | 2023 | 69.30 |
| 135 | Palau | 2023 | 69.27 |
| 136 | Botswana | 2023 | 69.16 |
| 137 | Lao People's Democratic Republic | 2023 | 68.96 |
| 138 | Senegal | 2023 | 68.68 |
| 139 | Eritrea | 2023 | 68.62 |
| 140 | Bolivia (Plurinational State of) | 2023 | 68.58 |
| 141 | Mauritania | 2023 | 68.48 |
| 142 | Gabon | 2023 | 68.34 |
| 143 | Uganda | 2023 | 68.25 |
| 144 | Rwanda | 2023 | 67.78 |
| 145 | Timor-Leste | 2023 | 67.69 |
| 146 | Pakistan | 2023 | 67.65 |
| 147 | Namibia | 2023 | 67.39 |
| 148 | Malawi | 2023 | 67.35 |
| 149 | Fiji | 2023 | 67.32 |
| 150 | Ethiopia | 2023 | 67.31 |
| 151 | Micronesia (Federated States of) | 2023 | 67.20 |
| 152 | Tuvalu | 2023 | 67.11 |
| 153 | Tanzania (United Republic of) | 2023 | 67.00 |
| 154 | Marshall Islands | 2023 | 66.94 |
| 155 | Myanmar | 2023 | 66.89 |
| 156 | Comoros | 2023 | 66.78 |
| 157 | Kiribati | 2023 | 66.47 |
| 158 | Zambia | 2023 | 66.35 |
| 159 | Sudan | 2023 | 66.33 |
| 160 | South Africa | 2023 | 66.14 |
| 161 | Papua New Guinea | 2023 | 66.13 |
| 162 | Afghanistan | 2023 | 66.03 |
| 163 | Djibouti | 2023 | 65.99 |
| 164 | Gambia | 2023 | 65.86 |
| 165 | Congo | 2023 | 65.77 |
| 166 | Ghana | 2023 | 65.50 |
| 167 | Palestine, State of | 2023 | 65.17 |
| 168 | Haiti | 2023 | 64.94 |
| 169 | Angola | 2023 | 64.62 |
| 170 | Eswatini (Kingdom of) | 2023 | 64.12 |
| 171 | Guinea-Bissau | 2023 | 64.08 |
| 172 | Equatorial Guinea | 2023 | 63.71 |
| 173 | Cameroon | 2023 | 63.70 |
| 174 | Burundi | 2023 | 63.65 |
| 175 | Kenya | 2023 | 63.65 |
| 176 | Madagascar | 2023 | 63.63 |
| 177 | Mozambique | 2023 | 63.61 |
| 178 | Zimbabwe | 2023 | 62.77 |
| 179 | Togo | 2023 | 62.74 |
| 180 | Liberia | 2023 | 62.16 |
| 181 | Nauru | 2023 | 62.11 |
| 182 | Côte d'Ivoire | 2023 | 61.94 |
| 183 | Congo (Democratic Republic of the) | 2023 | 61.90 |
| 184 | Sierra Leone | 2023 | 61.79 |
| 185 | Niger | 2023 | 61.18 |
| 186 | Burkina Faso | 2023 | 61.09 |
| 187 | Benin | 2023 | 60.77 |
| 188 | Guinea | 2023 | 60.74 |
| 189 | Mali | 2023 | 60.44 |
| 190 | Somalia | 2023 | 58.82 |
| 191 | South Sudan | 2023 | 57.62 |
| 192 | Central African Republic | 2023 | 57.41 |
| 193 | Lesotho | 2023 | 57.38 |
| 194 | Chad | 2023 | 55.07 |
| 195 | Nigeria | 2023 | 54.46 |
The main takeaway
Across the 195 observations, life expectancy at birth ranges from 54.46 to 86.37 years, with a median of 73.57 years. The indicator is powerful because it compresses age-specific mortality into one comparable measure, but it is not a prediction of an individual lifespan and not a complete score of health-system quality. The most useful reading combines the 2023 level with mortality trends, cause-of-death information, healthy-life measures and disaggregated data that reveal who benefits from longer survival and who does not.
Frequently Asked Questions
What does life expectancy at birth mean?
It is the average number of years a newborn would be expected to live if the age-specific mortality rates observed at birth remained unchanged throughout life.
Which observation is highest in 2023?
Monaco is highest among the 195 country and territory observations at 86.37 years, followed by San Marino and Hong Kong, China (SAR).
Does life expectancy predict an individual person’s lifespan?
No. It is a period life-table measure based on current mortality rates; actual cohort survival can differ as mortality conditions change.
Can life expectancy alone rank health-care systems?
No. It reflects mortality outcomes influenced by health care, public health, behavior, safety, environment and wider social and economic conditions.
Related Articles
Green Map creates custom-edited map images using open geographic data sources such as geoBoundaries, Natural Earth, OpenStreetMap, and government open data. These maps are edited visual materials, not raw data files, and are provided for education, documents, presentations, and graphic reference.