World Bank indicator NY.ADJ.ICTR.GN.ZS is labeled Adjusted savings: gross savings (% of GNI), but the value shown is gross savings as a percentage of gross national income. Gross savings are described as GNI minus public and private consumption plus net current transfers. The latest non-empty file contains 178 observations, and 134 of them are from 2021, making 2021 the largest same-year group for direct comparison.
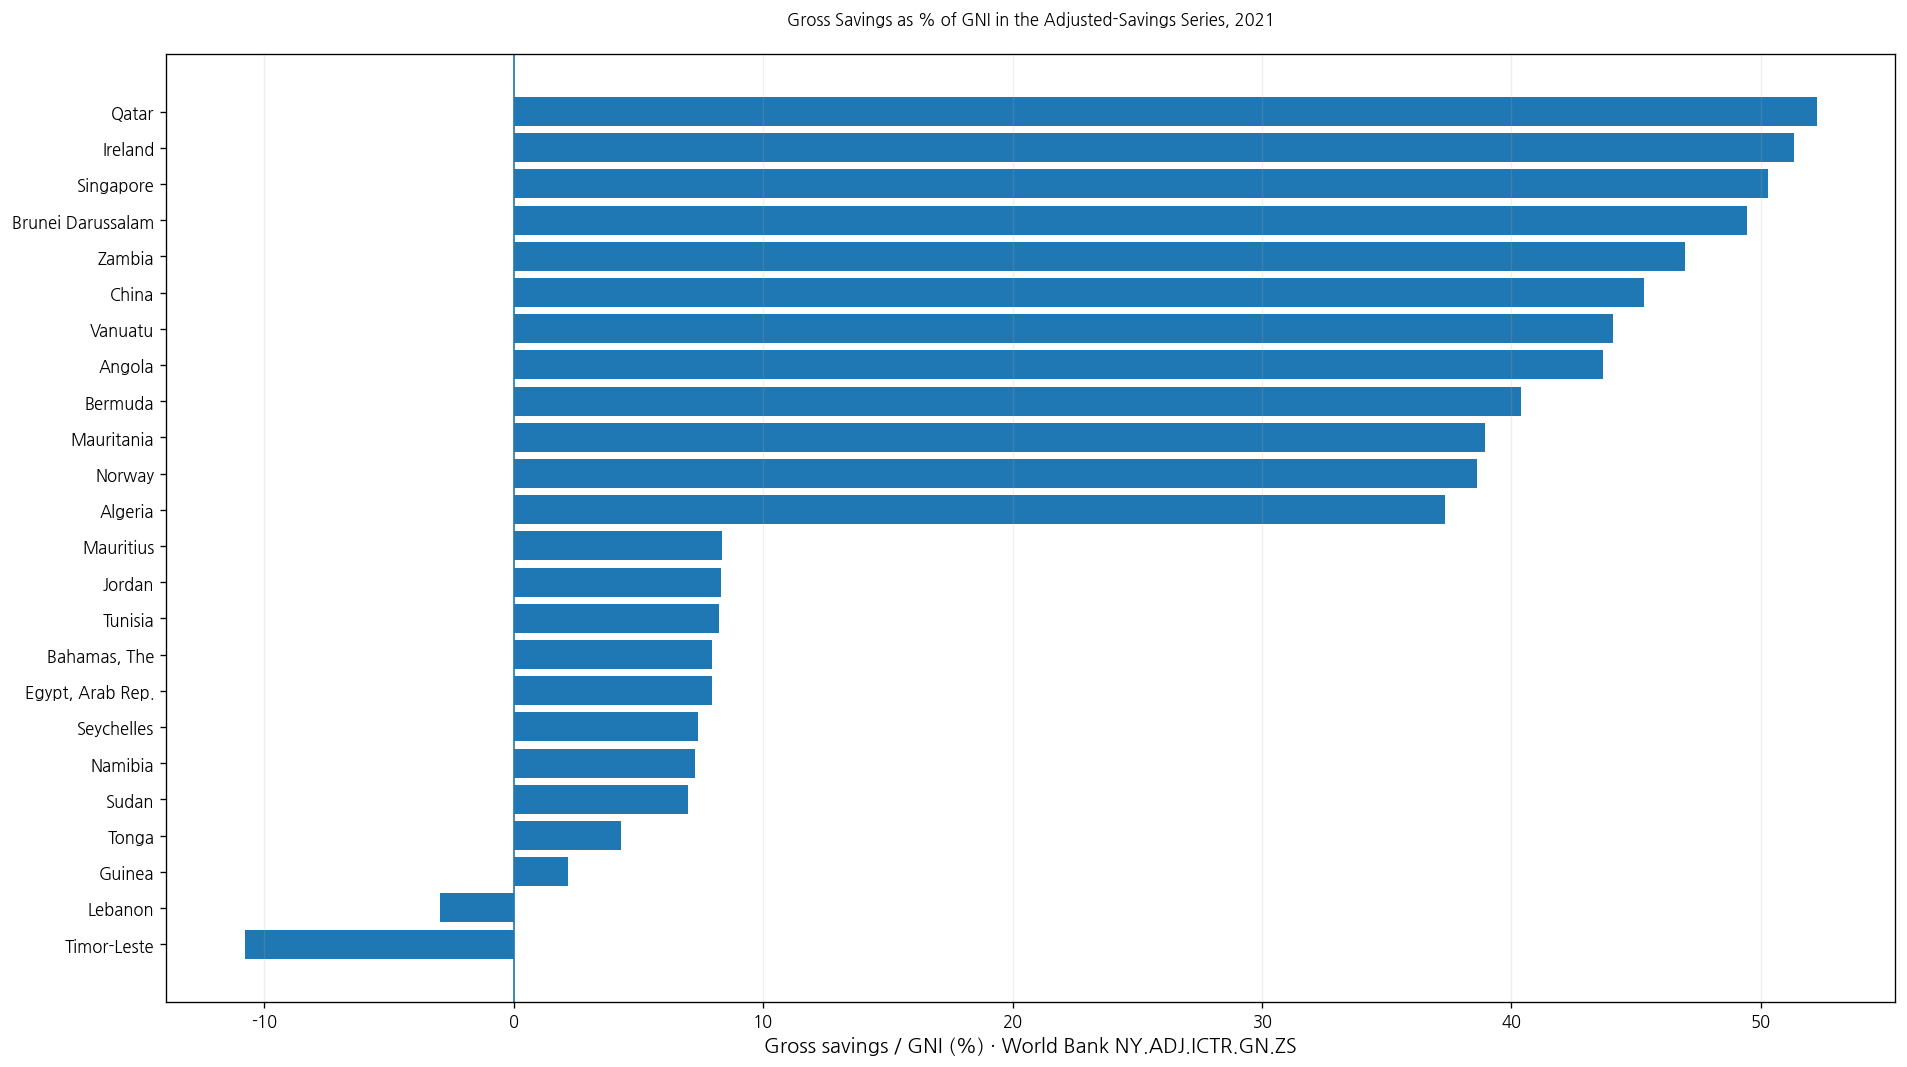
Table of Contents
The indicator is not adjusted net savings itself
The title includes the adjusted-savings family label, but the measured value is the gross-savings component expressed relative to GNI. It should not be relabeled as adjusted net savings, which incorporates additional additions and deductions beyond gross savings.
The safest interpretation is therefore gross savings as a share of GNI within the adjusted-savings indicator family.
Gross savings as % of GNI is different from gross domestic savings as % of GDP
Gross savings uses gross national income as its denominator and reflects national-income accounting. Gross domestic savings is commonly compared with GDP and answers a related but different question.
Because GNI includes net primary income from abroad while GDP is based on domestic production, the two ratios do not have to match.
The 2021 mean is 23.89% and the median is 23.39%
The 2021 subset contains 134 economies. Its mean is 23.89% and median 23.39%. The first quartile is 16.69% and the third quartile 30.65%, putting the middle half roughly between 16.69% and 30.65%.
39 economies are at or above 30%, 9 are at or above 40%, and 3 reach 50% or more. At the lower end, 14 are below 10%, and 2 observations are negative.
Qatar is highest in 2021 at 52.23%
Qatar records 52.23%, followed by Ireland at 51.33%, Singapore at 50.30%, Brunei Darussalam at 49.44%, Zambia at 46.97%, China at 45.30%, Vanuatu at 44.08%, and Angola at 43.66%.
| 2021 rank | Economy/territory | Gross savings / GNI |
|---|---|---|
| 1 | Qatar | 52.23% |
| 2 | Ireland | 51.33% |
| 3 | Singapore | 50.30% |
| 4 | Brunei Darussalam | 49.44% |
| 5 | Zambia | 46.97% |
| 6 | China | 45.30% |
| 7 | Vanuatu | 44.08% |
| 8 | Angola | 43.66% |
| 9 | Bermuda | 40.37% |
| 10 | Mauritania | 38.94% |
| 11 | Norway | 38.62% |
| 12 | Algeria | 37.35% |
| 13 | Gambia, The | 36.62% |
| 14 | Korea, Rep. | 36.19% |
| 15 | Switzerland | 36.01% |
| 16 | Nigeria | 35.23% |
| 17 | Jamaica | 34.93% |
| 18 | Viet Nam | 34.42% |
| 19 | Bangladesh | 34.25% |
| 20 | Indonesia | 33.98% |
A high ratio means a relatively large portion of national income was recorded as gross savings rather than consumption. It does not by itself establish investment efficiency, household thrift, fiscal strength, or overall financial stability.
Timor-Leste is lowest in 2021 at -10.79%
At the lower end, Timor-Leste records -10.79%, Lebanon -2.94%, Guinea 2.16%, Tonga 4.32%, Sudan 6.99%, Namibia 7.28%, and Seychelles 7.41%.
| Low-order position in 2021 | Economy/territory | Gross savings / GNI |
|---|---|---|
| 1 | Timor-Leste | -10.79% |
| 2 | Lebanon | -2.94% |
| 3 | Guinea | 2.16% |
| 4 | Tonga | 4.32% |
| 5 | Sudan | 6.99% |
| 6 | Namibia | 7.28% |
| 7 | Seychelles | 7.41% |
| 8 | Egypt, Arab Rep. | 7.94% |
| 9 | Bahamas, The | 7.94% |
| 10 | Tunisia | 8.22% |
| 11 | Jordan | 8.33% |
| 12 | Mauritius | 8.36% |
| 13 | Madagascar | 8.91% |
| 14 | Georgia | 9.19% |
| 15 | Uganda | 10.15% |
| 16 | Greece | 10.71% |
| 17 | Cyprus | 12.41% |
| 18 | Ukraine | 12.80% |
| 19 | Colombia | 13.77% |
| 20 | Comoros | 13.92% |
A negative ratio is a valid accounting outcome rather than missing data. Under the gross-savings identity, consumption and related transfer components can produce gross savings below zero. The country-specific reason, however, cannot be determined from this single indicator.
A high savings share is not a direct measure of living standards
The ratio shows how much of national income remains as gross savings. Living standards depend on income per person, consumption, distribution, public services, assets, liabilities, and many other factors.
It is therefore inappropriate to treat a higher gross-savings ratio as an automatic ranking of prosperity or economic quality.
Gross savings and domestic investment are not identical
Savings are an important source of investment finance, but a country’s gross-savings ratio does not have to equal its domestic-investment ratio. External borrowing, lending, current-account balances, and cross-border financial flows can create differences.
Investment analysis requires indicators such as gross capital formation in addition to savings.
Consumption patterns matter, but they are not the only driver
Because gross savings are linked to the gap between national income and consumption, lower consumption relative to income can raise the savings ratio. The reverse can occur when consumption is high or income weak.
Cross-country differences can also reflect commodity income, corporate profits, government finances, demographics, external income, and cyclical conditions, so a one-factor explanation is not justified.
The 2021 group is more comparable than the full latest-value file
Of the 178 latest non-empty observations, 134 are from 2021, or about 75.3%. There are 21 from 2020, while a smaller number date back to 1994–2019.
| Observation year | Economies/territories | Share of 178 |
|---|---|---|
| 2021 | 134 | 75.3% |
| 2020 | 21 | 11.8% |
| 2019 | 3 | 1.7% |
| 2018 | 5 | 2.8% |
| 2017 | 2 | 1.1% |
| 2016 | 1 | 0.6% |
| 2015 | 2 | 1.1% |
| 2014 | 1 | 0.6% |
| 2011 | 1 | 0.6% |
| 2010 | 2 | 1.1% |
| 2005 | 1 | 0.6% |
| 2004 | 1 | 0.6% |
| 2000 | 2 | 1.1% |
| 1994 | 2 | 1.1% |
The full 178-row file should not be presented as a single-year 2021 ranking. The 2021 subset supports same-year statistics; the complete file is an inventory of each economy’s latest available observation.
Old latest observations may not represent current savings structures
A few economies retain final observations from the 1990s or 2000s. Those values can still be historically informative, but they should not be treated as current without qualification.
Latest available does not mean same latest year for every economy.
A percentage does not show absolute savings size
A small economy with a 40% savings ratio can have a much smaller monetary amount of gross savings than a large economy with a 20% ratio.
Absolute comparisons require a monetary gross-savings series, while this indicator answers a composition question relative to GNI.
Adjusted net savings requires additional components
Adjusted-savings analysis can start with gross savings and then account for factors such as consumption of fixed capital, education expenditure, resource depletion, and environmental damage.
NY.ADJ.ICTR.GN.ZS is the gross-savings component and should not be interpreted as though those later sustainability adjustments have already been applied.
Complete list of the 178 latest observations
The table below lists each economy and territory’s latest non-empty observation alphabetically. The observation year should be read together with the percentage.
| Economy/territory | Observation year | Gross savings / GNI |
|---|---|---|
| Albania | 2021 | 19.56% |
| Algeria | 2021 | 37.35% |
| Angola | 2021 | 43.66% |
| Antigua and Barbuda | 2020 | 14.55% |
| Argentina | 2021 | 22.00% |
| Armenia | 2021 | 16.97% |
| Aruba | 2021 | 15.42% |
| Australia | 2021 | 26.06% |
| Austria | 2021 | 28.14% |
| Azerbaijan | 2021 | 33.52% |
| Bahamas, The | 2021 | 7.94% |
| Bahrain | 2018 | 30.50% |
| Bangladesh | 2021 | 34.25% |
| Barbados | 2017 | 5.61% |
| Belarus | 2021 | 30.37% |
| Belgium | 2021 | 26.19% |
| Belize | 2021 | 27.12% |
| Benin | 2020 | 21.54% |
| Bermuda | 2021 | 40.37% |
| Bhutan | 2021 | 14.31% |
| Bolivia | 2021 | 14.23% |
| Bosnia and Herzegovina | 2021 | 20.93% |
| Botswana | 2021 | 23.11% |
| Brazil | 2021 | 17.93% |
| Brunei Darussalam | 2021 | 49.44% |
| Bulgaria | 2021 | 21.88% |
| Burkina Faso | 2019 | 17.80% |
| Burundi | 2018 | 5.53% |
| Cabo Verde | 2021 | 33.01% |
| Cambodia | 2021 | 30.17% |
| Cameroon | 2021 | 14.41% |
| Canada | 2021 | 23.09% |
| Central African Republic | 1994 | 15.47% |
| Chad | 1994 | 13.50% |
| Chile | 2021 | 19.88% |
| China | 2021 | 45.30% |
| Colombia | 2021 | 13.77% |
| Comoros | 2021 | 13.92% |
| Congo, Dem. Rep. | 2021 | 25.53% |
| Congo, Rep. | 2020 | 19.15% |
| Costa Rica | 2021 | 16.78% |
| Cote d’Ivoire | 2020 | 21.81% |
| Croatia | 2021 | 24.62% |
| Curacao | 2017 | 13.34% |
| Cyprus | 2021 | 12.41% |
| Czechia | 2021 | 29.49% |
| Denmark | 2021 | 30.95% |
| Djibouti | 2020 | 12.76% |
| Dominica | 2018 | -11.25% |
| Dominican Republic | 2021 | 29.25% |
| Ecuador | 2021 | 25.81% |
| Egypt, Arab Rep. | 2021 | 7.94% |
| El Salvador | 2021 | 18.15% |
| Eritrea | 2000 | 15.81% |
| Estonia | 2021 | 31.13% |
| Eswatini | 2021 | 19.97% |
| Ethiopia | 2021 | 25.23% |
| Faroe Islands | 2011 | 27.30% |
| Fiji | 2020 | 16.41% |
| Finland | 2021 | 24.82% |
| France | 2021 | 23.67% |
| Gabon | 2015 | 41.85% |
| Gambia, The | 2021 | 36.62% |
| Georgia | 2021 | 9.19% |
| Germany | 2021 | 29.60% |
| Ghana | 2021 | 22.30% |
| Greece | 2021 | 10.71% |
| Guatemala | 2021 | 19.61% |
| Guinea | 2021 | 2.16% |
| Guinea-Bissau | 2020 | 13.34% |
| Guyana | 2005 | 17.92% |
| Haiti | 2021 | 14.89% |
| Honduras | 2021 | 20.85% |
| Hong Kong SAR, China | 2021 | 26.99% |
| Hungary | 2021 | 27.37% |
| Iceland | 2021 | 15.97% |
| India | 2021 | 30.69% |
| Indonesia | 2021 | 33.98% |
| Iran, Islamic Rep. | 2000 | 37.87% |
| Iraq | 2021 | 30.76% |
| Ireland | 2021 | 51.33% |
| Israel | 2021 | 29.59% |
| Italy | 2021 | 22.70% |
| Jamaica | 2021 | 34.93% |
| Japan | 2021 | 27.08% |
| Jordan | 2021 | 8.33% |
| Kazakhstan | 2021 | 29.12% |
| Kenya | 2021 | 16.66% |
| Kiribati | 2020 | 31.70% |
| Korea, Rep. | 2021 | 36.19% |
| Kosovo | 2021 | 26.71% |
| Kuwait | 2019 | 28.45% |
| Kyrgyz Republic | 2021 | 21.92% |
| Lao PDR | 2016 | 18.43% |
| Latvia | 2021 | 21.98% |
| Lebanon | 2021 | -2.94% |
| Lesotho | 2020 | 19.70% |
| Libya | 2020 | -14.16% |
| Lithuania | 2021 | 21.63% |
| Luxembourg | 2021 | 32.77% |
| Macao SAR, China | 2021 | 31.37% |
| Madagascar | 2021 | 8.91% |
| Malaysia | 2021 | 26.79% |
| Maldives | 2021 | 33.15% |
| Mali | 2020 | 15.83% |
| Malta | 2021 | 31.22% |
| Marshall Islands | 2020 | 14.42% |
| Mauritania | 2021 | 38.94% |
| Mauritius | 2021 | 8.36% |
| Mexico | 2021 | 24.18% |
| Moldova | 2021 | 16.41% |
| Mongolia | 2021 | 23.76% |
| Montenegro | 2021 | 17.10% |
| Morocco | 2021 | 29.22% |
| Mozambique | 2021 | 15.21% |
| Myanmar | 2019 | 30.81% |
| Namibia | 2021 | 7.28% |
| Nepal | 2021 | 32.50% |
| Netherlands | 2021 | 29.29% |
| New Zealand | 2021 | 18.80% |
| Nicaragua | 2021 | 21.65% |
| Niger | 2020 | 13.65% |
| Nigeria | 2021 | 35.23% |
| North Macedonia | 2021 | 30.51% |
| Norway | 2021 | 38.62% |
| Oman | 2021 | 18.83% |
| Pakistan | 2021 | 14.10% |
| Panama | 2021 | 30.72% |
| Papua New Guinea | 2004 | 33.57% |
| Paraguay | 2021 | 23.96% |
| Peru | 2021 | 22.22% |
| Philippines | 2021 | 19.52% |
| Poland | 2021 | 20.44% |
| Portugal | 2021 | 19.39% |
| Qatar | 2021 | 52.23% |
| Romania | 2021 | 19.33% |
| Russian Federation | 2021 | 30.21% |
| Rwanda | 2021 | 15.67% |
| Samoa | 2021 | 28.83% |
| Saudi Arabia | 2020 | 24.09% |
| Senegal | 2018 | 23.68% |
| Serbia | 2021 | 22.08% |
| Seychelles | 2021 | 7.41% |
| Sierra Leone | 2020 | 0.32% |
| Singapore | 2021 | 50.30% |
| Sint Maarten (Dutch part) | 2018 | 46.28% |
| Slovak Republic | 2021 | 19.28% |
| Slovenia | 2021 | 26.25% |
| Solomon Islands | 2020 | 18.21% |
| South Africa | 2021 | 16.50% |
| South Sudan | 2015 | 7.04% |
| Spain | 2021 | 21.68% |
| Sri Lanka | 2020 | 33.09% |
| Sudan | 2021 | 6.99% |
| Suriname | 2010 | 51.57% |
| Sweden | 2021 | 30.34% |
| Switzerland | 2021 | 36.01% |
| Syrian Arab Republic | 2010 | 15.69% |
| Tajikistan | 2020 | 31.01% |
| Tanzania | 2020 | 34.66% |
| Thailand | 2021 | 28.79% |
| Timor-Leste | 2021 | -10.79% |
| Togo | 2020 | 22.31% |
| Tonga | 2021 | 4.32% |
| Tunisia | 2021 | 8.22% |
| Turkiye | 2021 | 30.76% |
| Uganda | 2021 | 10.15% |
| Ukraine | 2021 | 12.80% |
| United Kingdom | 2021 | 16.02% |
| United States | 2021 | 17.87% |
| Uruguay | 2021 | 17.87% |
| Uzbekistan | 2021 | 33.55% |
| Vanuatu | 2021 | 44.08% |
| Venezuela, RB | 2014 | 9.04% |
| Viet Nam | 2021 | 34.42% |
| West Bank and Gaza | 2021 | 15.94% |
| Zambia | 2021 | 46.97% |
| Zimbabwe | 2020 | 16.83% |
How to interpret the comparison
First, this is gross savings as a share of GNI, not adjusted net savings. Second, it differs from gross domestic savings as a share of GDP. Third, negative values are valid published observations rather than missing values. Fourth, a high ratio is not a direct measure of prosperity or investment efficiency.
Fifth, the full 178-row file mixes years, so same-year comparison centers on the 134 observations from 2021. Sixth, percentages do not show absolute monetary amounts. Seventh, sustainability adjustments require other components of the adjusted-savings framework.
Source and calculation
The source is World Bank World Development Indicators NY.ADJ.ICTR.GN.ZS, Adjusted savings: gross savings (% of GNI). The 2021 mean, median, quartiles, threshold counts, and rankings use only the 134 observations dated 2021. The complete table preserves all 178 latest non-empty observations.
Frequently Asked Questions
Is this indicator adjusted net savings?
No. Despite the adjusted-savings family label, the measured value is gross savings as a percentage of GNI.
What is the 2021 median?
The median across the 134 observations dated 2021 is 23.39%, while the mean is 23.89%.
Can gross savings as a share of GNI be negative?
Yes. A negative value is a possible accounting outcome and should not be treated as missing data.
Related Articles
Green Map creates custom-edited map images using open geographic data sources such as geoBoundaries, Natural Earth, OpenStreetMap, and government open data. These maps are edited visual materials, not raw data files, and are provided for education, documents, presentations, and graphic reference.