The consumer price index tracks the price level of a representative basket of goods and services consumed by households. World Bank indicator FP.CPI.TOTL uses 2010=100. The latest non-empty file contains 192 observations, of which 165 are from 2025. The main same-year comparison therefore uses the 165 economies observed in 2025.
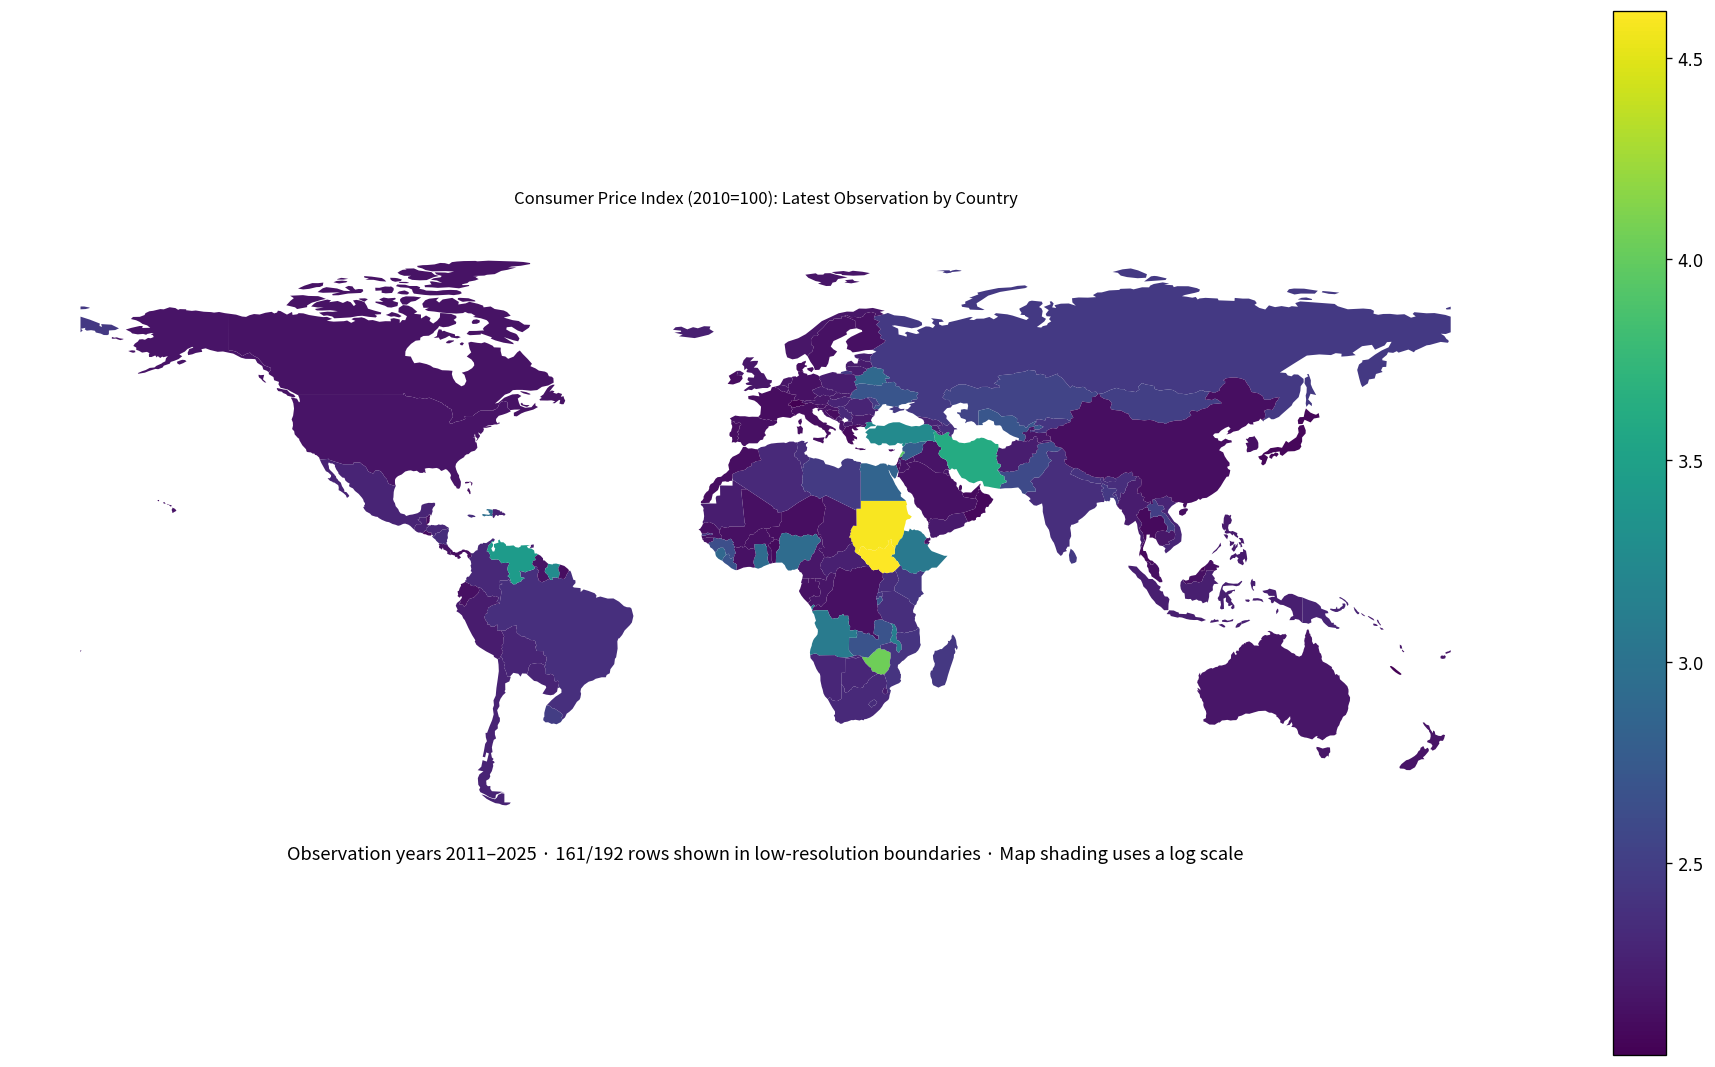
Table of Contents
How to read 2010=100
The price level in 2010 is normalized to 100. A CPI of 150 in 2025 means the consumer price level is about 50% above its 2010 level. A CPI of 200 means it is roughly twice the 2010 level, and 500 means about five times the reference level.
A 2025 CPI of 200 does not mean inflation in 2025 was 200%. The index is a cumulative price-level measure since the base period. Annual inflation must be calculated from the change between adjacent years.
CPI level and inflation rate are different
CPI is a price-level index, while inflation is the rate at which the index changes. If CPI rises from 180 in 2024 to 189 in 2025, the annual inflation rate is about 5%, not 189%.
This distinction matters for cross-country comparisons. A high CPI level can reflect many years of accumulated inflation even if the most recent annual inflation rate has already slowed.
The index is not a direct cross-country cost-of-living ranking
Each country sets its own 2010 price level to 100. A country with CPI 180 is not automatically more expensive in absolute terms than a country with CPI 150. The index is designed to measure change over time within each economy.
For absolute price-level or cost-of-living comparisons, PPP-based price level indices or consumption-price comparisons are more appropriate. CPI levels can compare cumulative change since a common base year, not absolute living costs.
The 2025 median is 161.56
The 2025 subset contains 165 economies. Its mean is 325.60 and median 161.56. The first quartile is 138.08 and the third quartile 229.91, placing the middle half roughly between 138.08 and 229.91.
96 observations are at least 150, 54 are at least 200, 16 are at least 500, and 7 are at least 1,000. At the lower end, 12 are below 125. A few very high-inflation economies pull the mean far above the median.
Lebanon is highest in 2025
Lebanon records 8,882.59 in 2025, followed by Iran, Islamic Rep. at 4,030.34, Suriname at 1,855.23, Turkiye at 1,784.32, and Malawi at 1,313.22. Angola is at 1,240.42 and Ethiopia at 1,176.47.
| 2025 rank | Economy/territory | CPI (2010=100) |
|---|---|---|
| 1 | Lebanon | 8882.59 |
| 2 | Iran, Islamic Rep. | 4030.34 |
| 3 | Suriname | 1855.23 |
| 4 | Turkiye | 1784.32 |
| 5 | Malawi | 1313.22 |
| 6 | Angola | 1240.42 |
| 7 | Ethiopia | 1176.47 |
| 8 | Haiti | 914.12 |
| 9 | Nigeria | 860.32 |
| 10 | Ghana | 855.78 |
| 11 | Belarus | 801.16 |
| 12 | Sierra Leone | 771.75 |
| 13 | Egypt, Arab Rep. | 711.63 |
| 14 | Uzbekistan | 518.89 |
| 15 | Ukraine | 515.28 |
| 16 | Burundi | 515.21 |
| 17 | Liberia | 495.99 |
| 18 | Zambia | 483.32 |
| 19 | Guinea | 436.58 |
| 20 | Sao Tome and Principe | 430.23 |
These values show large cumulative increases in consumer prices since 2010. They do not reveal which single year had the highest inflation or what the latest twelve-month inflation rate is.
Low 2025 values mean smaller cumulative increases since 2010
At the lower end, Switzerland records 105.67, Brunei Darussalam 106.12, Grenada 116.33, Japan 118.04, Cyprus 119.37, and Bahrain 120.52.
| Low-order position in 2025 | Economy/territory | CPI (2010=100) |
|---|---|---|
| 1 | Switzerland | 105.67 |
| 2 | Brunei Darussalam | 106.12 |
| 3 | Grenada | 116.33 |
| 4 | Japan | 118.04 |
| 5 | Cyprus | 119.37 |
| 6 | Bahrain | 120.52 |
| 7 | Oman | 121.27 |
| 8 | Greece | 121.73 |
| 9 | Thailand | 122.40 |
| 10 | Benin | 123.58 |
| 11 | United Arab Emirates | 123.74 |
| 12 | Dominica | 124.25 |
| 13 | Israel | 126.13 |
| 14 | Belize | 127.08 |
| 15 | France | 127.70 |
| 16 | Panama | 128.14 |
| 17 | St. Lucia | 128.51 |
| 18 | St. Vincent and the Grenadines | 128.93 |
| 19 | El Salvador | 129.31 |
| 20 | Denmark | 129.70 |
A lower CPI does not necessarily mean a lower absolute cost of living. It only means prices have risen less relative to that country’s own 2010 base.
Very high inflation can push the index into the thousands
When high inflation persists for years, an index with an old base year can become very large. Values in the thousands or tens of thousands are therefore possible without any mathematical error.
Because those extreme values compress the visual variation among most countries, the featured map uses logarithmic shading while the tables keep the original CPI values.
Most latest observations are from 2025, but not all
Of the 192 latest non-empty observations, 165 are from 2025, or about 85.9%. There are 8 from 2024, 2 from 2023, 3 from 2022, and a small number of older final observations.
| Observation year | Economies/territories | Share of 192 |
|---|---|---|
| 2025 | 165 | 85.9% |
| 2024 | 8 | 4.2% |
| 2023 | 2 | 1.0% |
| 2022 | 3 | 1.6% |
| 2019 | 5 | 2.6% |
| 2017 | 1 | 0.5% |
| 2016 | 5 | 2.6% |
| 2014 | 1 | 0.5% |
| 2012 | 1 | 0.5% |
| 2011 | 1 | 0.5% |
The complete latest-value file should therefore not be labeled a 2025 ranking of all 192 economies. The same-year ranking uses the 165 observations dated 2025, while older rows remain visible with their actual year.
South Sudan’s latest value is 41,280.74 from 2024
The largest value in the complete latest-observation file is South Sudan at 41,280.74, but its observation year is 2024. Mixing it directly into a 2025 ranking would combine different time points.
A latest-value map and a same-year ranking serve different purposes: the map shows each economy’s most recent available status, while the same-year table supports cleaner cross-country comparison.
CPI levels summarize different inflation histories
Two economies can both have a 2025 CPI of 200 and still have very different annual inflation paths. One may have experienced steady moderate inflation, while the other may have had a short inflation surge followed by stabilization.
To understand the path, annual CPI observations or annual inflation rates are needed. A single index level compresses the cumulative history into one number.
Changing the base year changes the index level
Index numbers depend on the chosen reference year. If the same price history were rebased to 2015=100 or 2020=100, the current index value would be different even though the underlying inflation history is unchanged.
All observations in this series use 2010=100, making them internally comparable in cumulative-change terms. When comparing with another CPI source, the base year and methodology should be checked first.
Complete list of the 192 latest observations
The table below lists every economy and territory’s latest non-empty observation in alphabetical order, with the observation year shown beside the CPI value.
| Economy/territory | Observation year | CPI (2010=100) |
|---|---|---|
| Afghanistan | 2024 | 168.54 |
| Albania | 2025 | 144.10 |
| Algeria | 2025 | 209.51 |
| Angola | 2025 | 1240.42 |
| Antigua and Barbuda | 2025 | 144.19 |
| Armenia | 2025 | 160.82 |
| Aruba | 2019 | 109.53 |
| Australia | 2025 | 148.46 |
| Austria | 2025 | 153.40 |
| Azerbaijan | 2025 | 229.91 |
| Bahamas, The | 2024 | 130.74 |
| Bahrain | 2025 | 120.52 |
| Bangladesh | 2025 | 285.00 |
| Barbados | 2025 | 146.53 |
| Belarus | 2025 | 801.16 |
| Belgium | 2025 | 145.66 |
| Belize | 2025 | 127.08 |
| Benin | 2025 | 123.58 |
| Bhutan | 2025 | 225.79 |
| Bolivia | 2025 | 197.72 |
| Bosnia and Herzegovina | 2023 | 128.06 |
| Botswana | 2025 | 202.64 |
| Brazil | 2025 | 234.41 |
| Brunei Darussalam | 2025 | 106.12 |
| Bulgaria | 2025 | 162.50 |
| Burkina Faso | 2025 | 136.48 |
| Burundi | 2025 | 515.21 |
| Cabo Verde | 2025 | 131.10 |
| Cambodia | 2025 | 153.02 |
| Cameroon | 2025 | 153.29 |
| Canada | 2025 | 140.97 |
| Cayman Islands | 2016 | 102.94 |
| Central African Republic | 2025 | 179.37 |
| Chad | 2025 | 149.69 |
| Chile | 2025 | 185.48 |
| China | 2025 | 132.60 |
| Colombia | 2025 | 206.38 |
| Comoros | 2025 | 157.90 |
| Congo, Dem. Rep. | 2016 | 133.85 |
| Congo, Rep. | 2025 | 146.54 |
| Costa Rica | 2025 | 143.00 |
| Cote d’Ivoire | 2025 | 138.10 |
| Croatia | 2025 | 144.01 |
| Curacao | 2019 | 115.53 |
| Cyprus | 2025 | 119.37 |
| Czechia | 2025 | 166.80 |
| Denmark | 2025 | 129.70 |
| Djibouti | 2025 | 134.49 |
| Dominica | 2025 | 124.25 |
| Dominican Republic | 2025 | 181.65 |
| Ecuador | 2025 | 133.99 |
| Egypt, Arab Rep. | 2025 | 711.63 |
| El Salvador | 2025 | 129.31 |
| Equatorial Guinea | 2024 | 144.38 |
| Estonia | 2025 | 179.99 |
| Eswatini | 2019 | 166.82 |
| Ethiopia | 2025 | 1176.47 |
| Fiji | 2025 | 147.81 |
| Finland | 2025 | 133.54 |
| France | 2025 | 127.70 |
| Gabon | 2025 | 139.73 |
| Gambia, The | 2024 | 285.89 |
| Georgia | 2025 | 185.49 |
| Germany | 2025 | 137.80 |
| Ghana | 2025 | 855.78 |
| Greece | 2025 | 121.73 |
| Grenada | 2025 | 116.33 |
| Guatemala | 2025 | 182.28 |
| Guinea | 2025 | 436.58 |
| Guinea-Bissau | 2025 | 142.94 |
| Guyana | 2025 | 142.21 |
| Haiti | 2025 | 914.12 |
| Honduras | 2025 | 206.92 |
| Hong Kong SAR, China | 2025 | 147.16 |
| Hungary | 2025 | 192.02 |
| Iceland | 2025 | 179.83 |
| India | 2025 | 233.06 |
| Indonesia | 2025 | 176.05 |
| Iran, Islamic Rep. | 2025 | 4030.34 |
| Iraq | 2025 | 143.60 |
| Ireland | 2025 | 130.04 |
| Israel | 2025 | 126.13 |
| Italy | 2025 | 131.87 |
| Jamaica | 2025 | 233.16 |
| Japan | 2025 | 118.04 |
| Jordan | 2025 | 140.45 |
| Kazakhstan | 2025 | 348.12 |
| Kenya | 2025 | 267.83 |
| Kiribati | 2024 | 124.11 |
| Korea, Rep. | 2025 | 135.00 |
| Kosovo | 2025 | 151.11 |
| Kuwait | 2025 | 151.75 |
| Kyrgyz Republic | 2025 | 265.55 |
| Lao PDR | 2025 | 317.16 |
| Latvia | 2025 | 162.39 |
| Lebanon | 2025 | 8882.59 |
| Lesotho | 2025 | 221.03 |
| Liberia | 2025 | 495.99 |
| Libya | 2025 | 289.41 |
| Lithuania | 2025 | 171.24 |
| Luxembourg | 2025 | 136.95 |
| Macao SAR, China | 2025 | 148.96 |
| Madagascar | 2025 | 280.82 |
| Malawi | 2025 | 1313.22 |
| Malaysia | 2025 | 134.60 |
| Maldives | 2025 | 150.41 |
| Mali | 2025 | 135.34 |
| Malta | 2025 | 134.53 |
| Mauritania | 2025 | 171.28 |
| Mauritius | 2025 | 176.59 |
| Mexico | 2025 | 191.45 |
| Micronesia, Fed. Sts. | 2022 | 126.91 |
| Moldova | 2025 | 298.54 |
| Mongolia | 2025 | 319.47 |
| Montenegro | 2025 | 157.15 |
| Morocco | 2025 | 130.51 |
| Mozambique | 2025 | 257.68 |
| Myanmar | 2019 | 168.18 |
| Namibia | 2025 | 202.75 |
| Naoero | 2012 | 100.18 |
| Nepal | 2025 | 254.62 |
| Netherlands | 2025 | 146.91 |
| New Caledonia | 2016 | 106.96 |
| New Zealand | 2025 | 144.86 |
| Nicaragua | 2025 | 226.40 |
| Niger | 2025 | 131.57 |
| Nigeria | 2025 | 860.32 |
| North Macedonia | 2025 | 159.36 |
| Norway | 2025 | 149.54 |
| Oman | 2025 | 121.27 |
| Pakistan | 2025 | 400.52 |
| Palau | 2025 | 160.77 |
| Panama | 2025 | 128.14 |
| Papua New Guinea | 2025 | 193.24 |
| Paraguay | 2025 | 190.29 |
| Peru | 2025 | 165.52 |
| Philippines | 2025 | 162.31 |
| Poland | 2025 | 170.41 |
| Portugal | 2025 | 132.05 |
| Qatar | 2024 | 126.02 |
| Romania | 2025 | 189.99 |
| Russian Federation | 2025 | 283.02 |
| Rwanda | 2025 | 251.18 |
| Samoa | 2025 | 149.24 |
| San Marino | 2025 | 131.91 |
| Sao Tome and Principe | 2025 | 430.23 |
| Saudi Arabia | 2025 | 138.57 |
| Senegal | 2025 | 136.06 |
| Serbia | 2025 | 208.32 |
| Seychelles | 2025 | 147.52 |
| Sierra Leone | 2025 | 771.75 |
| Singapore | 2025 | 134.36 |
| Sint Maarten (Dutch part) | 2017 | 116.64 |
| Slovak Republic | 2025 | 161.56 |
| Slovenia | 2025 | 138.08 |
| Solomon Islands | 2025 | 164.87 |
| South Africa | 2025 | 209.92 |
| South Sudan | 2024 | 41280.74 |
| Spain | 2025 | 135.02 |
| Sri Lanka | 2025 | 292.34 |
| St. Kitts and Nevis | 2023 | 110.82 |
| St. Lucia | 2025 | 128.51 |
| St. Vincent and the Grenadines | 2025 | 128.93 |
| Sudan | 2022 | 38796.56 |
| Suriname | 2025 | 1855.23 |
| Sweden | 2025 | 138.19 |
| Switzerland | 2025 | 105.67 |
| Syrian Arab Republic | 2019 | 614.95 |
| Tajikistan | 2016 | 148.57 |
| Tanzania | 2025 | 231.54 |
| Thailand | 2025 | 122.40 |
| Timor-Leste | 2025 | 181.88 |
| Togo | 2025 | 141.25 |
| Tonga | 2025 | 174.32 |
| Trinidad and Tobago | 2025 | 165.25 |
| Tunisia | 2025 | 231.51 |
| Turkiye | 2025 | 1784.32 |
| Tuvalu | 2011 | 100.50 |
| Uganda | 2025 | 224.68 |
| Ukraine | 2025 | 515.28 |
| United Arab Emirates | 2025 | 123.74 |
| United Kingdom | 2025 | 153.13 |
| United States | 2024 | 143.86 |
| Uruguay | 2025 | 304.15 |
| Uzbekistan | 2025 | 518.89 |
| Vanuatu | 2025 | 152.47 |
| Venezuela, RB | 2016 | 2740.27 |
| Viet Nam | 2025 | 195.98 |
| West Bank and Gaza | 2025 | 209.56 |
| Yemen, Rep. | 2014 | 157.58 |
| Zambia | 2025 | 483.32 |
| Zimbabwe | 2022 | 11076.60 |
How to interpret the comparison
First, this is an index level with 2010=100. Second, an index of 200 is not a 200% annual inflation rate. Third, CPI levels are not a direct ranking of absolute living costs across countries. Fourth, inflation histories require time-series data.
Fifth, the full 192-row latest file mixes years, so the direct ranking is based on the 165 observations from 2025. Sixth, very large index values can be valid after prolonged high inflation.
Source and calculation
The source is World Bank World Development Indicators FP.CPI.TOTL, Consumer price index (2010 = 100). The 2025 mean, median, quartiles, and rankings use only the 165 observations dated 2025. The map and complete table use each economy’s latest non-empty observation.
Frequently Asked Questions
Does CPI 200 mean annual inflation is 200%?
No. With 2010=100, it means the price level is roughly twice its 2010 level. Annual inflation is calculated from the year-to-year change in CPI.
Does a higher CPI mean a country has a higher cost of living?
Not necessarily. Each country is indexed to its own 2010 price level, so CPI is not a direct absolute cost-of-living comparison across countries.
What is the 2025 median?
The median across the 165 observations dated 2025 is 161.56, while the mean is 325.60.
Related Articles
Green Map creates custom-edited map images using open geographic data sources such as geoBoundaries, Natural Earth, OpenStreetMap, and government open data. These maps are edited visual materials, not raw data files, and are provided for education, documents, presentations, and graphic reference.