Persistence to grade 5 measures the share of children who enter grade 1 of primary school and eventually reach grade 5. The World Bank series contains 180 latest non-empty observations, but the reference years range from 1980 to 2023. Only 48 observations are dated 2023 and 25 are from 2022, so the complete latest-value list should not be treated as a single 2023 world ranking.
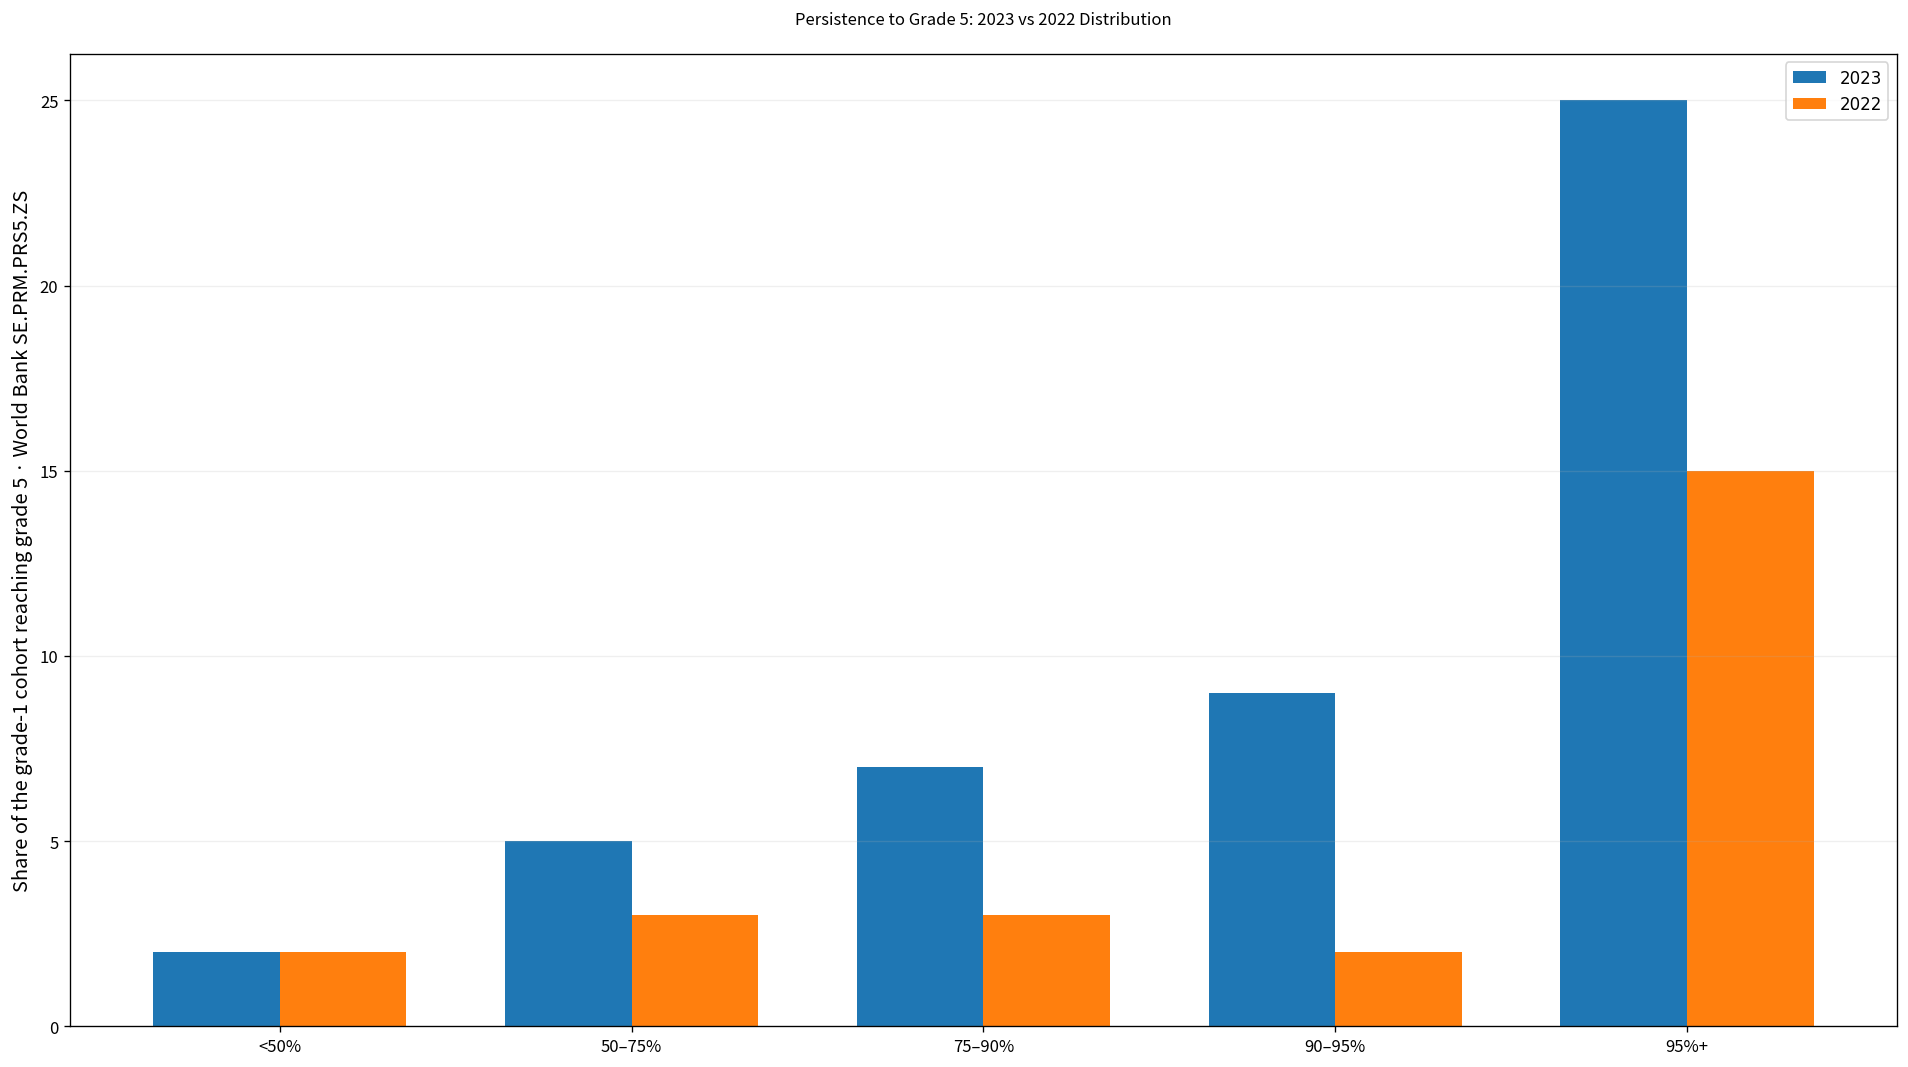
Table of Contents
What persistence to grade 5 measures
The indicator estimates the percentage of a cohort enrolled in the first grade of primary school that eventually reaches grade 5. World Bank background information describes the estimate as using the reconstructed cohort method. It is therefore a measure of persistence through the early primary grades rather than a simple ratio of current grade-5 enrollment to current grade-1 enrollment.
A value of 95% indicates that nearly all of the entry cohort is estimated to remain in school through grade 5. A lower value suggests greater loss from the cohort before that point. The indicator itself does not identify why students leave school; access, household circumstances, conflict, school costs, repetition, and other factors require separate evidence.
The 180 latest observations span 1980 to 2023
Among the 180 latest observations, 48 are from 2023, 25 from 2022, 19 from 2021, and 13 from 2020. Smaller groups come from earlier years, including a number of observations from the 1980s and 1990s.
| Observation year | Economies/territories | Share of 180 |
|---|---|---|
| 2023 | 48 | 26.7% |
| 2022 | 25 | 13.9% |
| 2021 | 19 | 10.6% |
| 2020 | 13 | 7.2% |
| 2019 | 10 | 5.6% |
| 2018 | 11 | 6.1% |
| 2017 | 8 | 4.4% |
| 2016 | 7 | 3.9% |
| 2015 | 1 | 0.6% |
| 2014 | 6 | 3.3% |
| 2013 | 3 | 1.7% |
| 2012 | 5 | 2.8% |
| 2011 | 3 | 1.7% |
| 2009 | 4 | 2.2% |
| 2007 | 2 | 1.1% |
| 2002 | 1 | 0.6% |
| 1999 | 3 | 1.7% |
| 1998 | 1 | 0.6% |
| 1997 | 1 | 0.6% |
| 1994 | 1 | 0.6% |
| 1989 | 2 | 1.1% |
| 1987 | 1 | 0.6% |
| 1985 | 1 | 0.6% |
| 1984 | 2 | 1.1% |
| 1982 | 1 | 0.6% |
| 1980 | 1 | 0.6% |
The mixed-year set has a mean of 83.41% and a median of 91.33%. 97 observations are at least 90% and 71 are at least 95%, while 12 are below 50%. These statistics summarize a collection of latest observations from different periods and should not be read as a current global average.
The 2023 median is 95.30%
The 2023 same-year subset contains 48 economies and territories. The mean is 88.13% and the median 95.30%. The first quartile is 88.24% and the third quartile 97.66%, showing that the middle half of the observations are concentrated at high persistence levels.
34 observations are at least 90% and 25 are at least 95%. Only 7 are below 75% and 2 are below 50%. The broad pattern is high persistence with a small but substantial lower tail.
The upper end of the 2023 distribution is tightly clustered
Denmark records 99.73%, Norway 99.68%, Chile 99.66%, Switzerland 99.66%, Mexico 99.64%, and Finland 99.62%. Estonia, Macao SAR, China, Israel, and Sweden are also above 98%. Differences among the highest observations are therefore very small.
| 2023 rank | Economy/territory | Persistence to grade 5 |
|---|---|---|
| 1 | Denmark | 99.73% |
| 2 | Norway | 99.68% |
| 3 | Chile | 99.66% |
| 4 | Switzerland | 99.66% |
| 5 | Mexico | 99.64% |
| 6 | Finland | 99.62% |
| 7 | Macao SAR, China | 99.55% |
| 8 | Estonia | 99.47% |
| 9 | Korea, Rep. | 98.90% |
| 10 | Israel | 98.73% |
| 11 | Sweden | 98.65% |
| 12 | Georgia | 97.77% |
| 13 | Paraguay | 97.62% |
| 14 | Hong Kong SAR, China | 97.59% |
| 15 | Bolivia | 97.53% |
Values near 100% indicate that almost all of the grade-1 cohort is estimated to reach grade 5. They do not prove that learning outcomes, education quality, or equality are equally strong. Persistence captures staying in school through a stage of primary education, not what students learn.
The lower end of 2023 shows a much wider gap
Azerbaijan is reported at 0% and British Virgin Islands at 19.42%. Niger follows at 53.54%, then Naoero at 71.10%, Togo at 73.95%, India at 74.19%, and Cameroon at 74.47%. The contrast with the tightly clustered upper end is substantial.
| Low-order position in 2023 | Economy/territory | Persistence to grade 5 |
|---|---|---|
| 1 | Azerbaijan | 0.00% |
| 2 | British Virgin Islands | 19.42% |
| 3 | Niger | 53.54% |
| 4 | Naoero | 71.10% |
| 5 | Togo | 73.95% |
| 6 | India | 74.19% |
| 7 | Cameroon | 74.47% |
| 8 | Rwanda | 76.81% |
| 9 | Senegal | 78.20% |
| 10 | Honduras | 84.49% |
| 11 | Albania | 86.65% |
| 12 | Cayman Islands | 87.52% |
| 13 | Malaysia | 88.48% |
| 14 | Kiribati | 89.75% |
| 15 | Mauritius | 90.24% |
Azerbaijan’s 0% is a published numeric observation rather than a missing cell, so it is retained in the analysis. However, an extreme zero should be checked against country-specific statistical documentation before being interpreted literally as evidence that no child in the cohort reached grade 5. The number is preserved without adding a causal or institutional explanation that the indicator alone cannot establish.
The 2022 median is also above 95%
The 2022 subset contains 25 observations, with a mean of 86.49% and a median of 95.72%. 17 are at least 90% and 15 are at least 95%. Italy reaches 99.90%, Greece 99.80%, Singapore 99.52%, Malta 99.46%, and Slovenia 99.43%.
| 2022 high-order position | Economy/territory | Persistence to grade 5 |
|---|---|---|
| 1 | Italy | 99.90% |
| 2 | Greece | 99.80% |
| 3 | Singapore | 99.52% |
| 4 | Malta | 99.46% |
| 5 | Slovenia | 99.43% |
| 6 | Belgium | 99.23% |
| 7 | Trinidad and Tobago | 98.06% |
| 8 | Argentina | 98.03% |
| 9 | Sri Lanka | 97.92% |
| 10 | South Africa | 97.08% |
| 11 | Iran, Islamic Rep. | 96.18% |
| 12 | Romania | 96.07% |
The lower end of the 2022 subset includes Croatia at 0%, Burkina Faso at 43.40%, St. Lucia at 70.42%, Panama at 72.31%, and Djibouti at 72.68%. As in 2023, a small number of low observations create most of the spread below the high median.
| 2022 low-order position | Economy/territory | Persistence to grade 5 |
|---|---|---|
| 1 | Croatia | 0.00% |
| 2 | Burkina Faso | 43.40% |
| 3 | St. Lucia | 70.42% |
| 4 | Panama | 72.31% |
| 5 | Djibouti | 72.68% |
| 6 | Jamaica | 78.41% |
| 7 | Lesotho | 84.32% |
| 8 | Uruguay | 88.97% |
| 9 | Gibraltar | 91.48% |
| 10 | North Macedonia | 93.04% |
| 11 | Lebanon | 95.40% |
| 12 | Barbados | 95.50% |
The 2022 and 2023 means are not a time trend
The 2023 mean is 88.13% and the 2022 mean is 86.49%, but the two groups contain different economies. The difference should not be interpreted as a one-year change in global persistence. A valid time trend would match the same economies across consecutive years.
This series is assembled as the latest non-empty observation for each economy. Annual subgroups therefore differ in composition, and subgroup averages reflect both education outcomes and which economies report in each year.
Persistence to grade 5 is not the same as primary completion
Persistence to grade 5 tracks whether a grade-1 cohort reaches grade 5. Primary completion measures reaching or completing the final grade of primary education, which may extend beyond grade 5 in many education systems. The two indicators can therefore answer different questions.
Persistence is also different from entry or enrollment rates. A system can enroll many children in grade 1 but still lose a substantial share of the cohort before grade 5. Access, persistence, completion, and learning outcomes should be analyzed as separate dimensions.
Complete list of the 180 latest observations
The table below lists the latest non-empty observation for every economy and territory in alphabetical order. The original observation year is shown for each row, and published zeros remain zero. For a strict same-year comparison, use only the observations dated 2023.
| Economy/territory | Observation year | Persistence to grade 5 |
|---|---|---|
| Afghanistan | 1984 | 81.95% |
| Albania | 2023 | 86.65% |
| Algeria | 2021 | 92.68% |
| Andorra | 2020 | 98.49% |
| Angola | 2009 | 44.80% |
| Antigua and Barbuda | 2014 | 89.82% |
| Argentina | 2022 | 98.03% |
| Aruba | 2021 | 87.25% |
| Azerbaijan | 2023 | 0.00% |
| Bahamas, The | 2015 | 70.24% |
| Bahrain | 2023 | 97.45% |
| Bangladesh | 2009 | 66.20% |
| Barbados | 2022 | 95.50% |
| Belarus | 1989 | 45.74% |
| Belgium | 2022 | 99.23% |
| Belize | 2023 | 97.16% |
| Benin | 2021 | 62.67% |
| Bermuda | 2012 | 81.37% |
| Bhutan | 2017 | 89.54% |
| Bolivia | 2023 | 97.53% |
| Bosnia and Herzegovina | 2022 | 95.72% |
| Botswana | 2012 | 96.30% |
| British Virgin Islands | 2023 | 19.42% |
| Brunei Darussalam | 2019 | 99.17% |
| Burkina Faso | 2022 | 43.40% |
| Burundi | 2019 | 59.90% |
| Cabo Verde | 2021 | 95.73% |
| Cambodia | 2019 | 84.07% |
| Cameroon | 2023 | 74.47% |
| Canada | 1999 | 98.90% |
| Cayman Islands | 2023 | 87.52% |
| Central African Republic | 2011 | 56.70% |
| Chad | 2017 | 78.60% |
| Chile | 2023 | 99.66% |
| China | 2020 | 99.79% |
| Colombia | 2021 | 91.33% |
| Comoros | 2013 | 74.62% |
| Congo, Dem. Rep. | 2020 | 76.94% |
| Congo, Rep. | 2007 | 76.93% |
| Costa Rica | 2023 | 95.43% |
| Cote d’Ivoire | 2021 | 68.04% |
| Croatia | 2022 | 0.00% |
| Cuba | 2023 | 90.40% |
| Cyprus | 2021 | 98.07% |
| Czechia | 2021 | 99.50% |
| Denmark | 2023 | 99.73% |
| Djibouti | 2022 | 72.68% |
| Dominica | 2021 | 93.02% |
| Dominican Republic | 2023 | 95.76% |
| Ecuador | 2023 | 95.46% |
| Egypt, Arab Rep. | 2020 | 99.84% |
| El Salvador | 2023 | 90.95% |
| Equatorial Guinea | 2011 | 76.02% |
| Eritrea | 2017 | 79.98% |
| Estonia | 2023 | 99.47% |
| Eswatini | 2018 | 97.35% |
| Ethiopia | 2021 | 55.53% |
| Fiji | 2023 | 94.83% |
| Finland | 2023 | 99.62% |
| France | 1999 | 97.96% |
| French Polynesia | 1982 | 78.03% |
| Gabon | 2002 | 72.30% |
| Gambia, The | 2020 | 81.30% |
| Georgia | 2023 | 97.77% |
| Ghana | 2021 | 92.43% |
| Gibraltar | 2022 | 91.48% |
| Greece | 2022 | 99.80% |
| Grenada | 2017 | 87.24% |
| Guatemala | 2023 | 90.68% |
| Guinea | 2013 | 66.60% |
| Guinea-Bissau | 1987 | 21.87% |
| Guyana | 2011 | 94.62% |
| Haiti | 1985 | 36.21% |
| Honduras | 2023 | 84.49% |
| Hong Kong SAR, China | 2023 | 97.59% |
| Hungary | 2013 | 0.00% |
| Iceland | 2021 | 99.25% |
| India | 2023 | 74.19% |
| Indonesia | 2017 | 99.51% |
| Iran, Islamic Rep. | 2022 | 96.18% |
| Iraq | 1999 | 65.56% |
| Ireland | 1994 | 99.29% |
| Israel | 2023 | 98.73% |
| Italy | 2022 | 99.90% |
| Jamaica | 2022 | 78.41% |
| Japan | 1998 | 99.98% |
| Jordan | 2023 | 96.04% |
| Kenya | 2014 | 93.57% |
| Kiribati | 2023 | 89.75% |
| Korea, Rep. | 2023 | 98.90% |
| Kuwait | 2020 | 85.74% |
| Lao PDR | 2019 | 82.05% |
| Latvia | 2023 | 95.97% |
| Lebanon | 2022 | 95.40% |
| Lesotho | 2022 | 84.32% |
| Liberia | 2016 | 54.98% |
| Libya | 1980 | 86.43% |
| Liechtenstein | 2020 | 96.27% |
| Luxembourg | 2020 | 96.22% |
| Macao SAR, China | 2023 | 99.55% |
| Madagascar | 2018 | 31.57% |
| Malawi | 2018 | 71.67% |
| Malaysia | 2023 | 88.48% |
| Maldives | 2023 | 93.09% |
| Mali | 2012 | 56.53% |
| Malta | 2022 | 99.46% |
| Marshall Islands | 2021 | 86.39% |
| Mauritania | 2016 | 70.66% |
| Mauritius | 2023 | 90.24% |
| Mexico | 2023 | 99.64% |
| Monaco | 2020 | 93.81% |
| Mongolia | 2018 | 98.59% |
| Montenegro | 2021 | 99.47% |
| Morocco | 2023 | 94.48% |
| Mozambique | 2019 | 56.43% |
| Myanmar | 2009 | 74.79% |
| Namibia | 2017 | 91.57% |
| Naoero | 2023 | 71.10% |
| Nepal | 2016 | 73.55% |
| Netherlands | 1984 | 94.45% |
| New Caledonia | 1989 | 94.32% |
| Nicaragua | 2007 | 51.38% |
| Niger | 2023 | 53.54% |
| Nigeria | 2009 | 72.40% |
| North Macedonia | 2022 | 93.04% |
| Norway | 2023 | 99.68% |
| Oman | 2016 | 98.46% |
| Pakistan | 2018 | 65.29% |
| Panama | 2022 | 72.31% |
| Papua New Guinea | 1997 | 65.19% |
| Paraguay | 2023 | 97.62% |
| Peru | 2016 | 94.52% |
| Philippines | 2023 | 95.17% |
| Poland | 2018 | 99.57% |
| Portugal | 2020 | 99.47% |
| Puerto Rico (US) | 2014 | 83.47% |
| Qatar | 2021 | 96.15% |
| Romania | 2022 | 96.07% |
| Rwanda | 2023 | 76.81% |
| Samoa | 2019 | 90.26% |
| San Marino | 2023 | 96.55% |
| Sao Tome and Principe | 2016 | 95.52% |
| Saudi Arabia | 2018 | 85.49% |
| Senegal | 2023 | 78.20% |
| Seychelles | 2023 | 95.88% |
| Sierra Leone | 2019 | 49.07% |
| Singapore | 2022 | 99.52% |
| Slovenia | 2022 | 99.43% |
| Solomon Islands | 2018 | 82.37% |
| South Africa | 2022 | 97.08% |
| Spain | 2021 | 99.97% |
| Sri Lanka | 2022 | 97.92% |
| St. Kitts and Nevis | 2014 | 97.99% |
| St. Lucia | 2022 | 70.42% |
| St. Vincent and the Grenadines | 2017 | 96.66% |
| Sudan | 2018 | 81.02% |
| Suriname | 2020 | 78.02% |
| Sweden | 2023 | 98.65% |
| Switzerland | 2023 | 99.66% |
| Syrian Arab Republic | 2023 | 91.79% |
| Tanzania | 2019 | 84.48% |
| Thailand | 2017 | 98.73% |
| Timor-Leste | 2018 | 93.27% |
| Togo | 2023 | 73.95% |
| Tonga | 2019 | 91.32% |
| Trinidad and Tobago | 2022 | 98.06% |
| Tunisia | 2020 | 98.57% |
| Turkiye | 2014 | 0.00% |
| Tuvalu | 2021 | 78.06% |
| Uganda | 2016 | 61.12% |
| United Arab Emirates | 2018 | 80.87% |
| United Kingdom | 2021 | 99.79% |
| United States | 2021 | 84.43% |
| Uruguay | 2022 | 88.97% |
| Vanuatu | 2020 | 81.61% |
| Venezuela, RB | 2023 | 90.53% |
| Viet Nam | 2014 | 95.96% |
| Yemen, Rep. | 2012 | 75.40% |
| Zambia | 2012 | 74.46% |
| Zimbabwe | 2019 | 92.93% |
How to interpret the data
First, the 180 latest observations do not share one year. Second, persistence to grade 5 does not directly measure learning quality or achievement. Third, extreme published values such as 0% should be retained but checked against country-specific statistical context. Fourth, annual subgroup averages are not a time series unless the same economies are matched.
Education statistics can also be revised as administrative records and estimation methods change. A current country-level assessment should combine the latest World Bank series with official national education statistics.
Source and calculation
The source is World Bank World Development Indicators SE.PRM.PRS5.ZS, Persistence to grade 5, total (% of cohort). The 2023 and 2022 means, medians, quartiles, band counts, and rankings are calculated from the published observations for those years.
Frequently Asked Questions
What does persistence to grade 5 measure?
It estimates the share of children entering grade 1 who eventually reach grade 5, using a reconstructed cohort approach.
What is the 2023 median persistence rate?
The median across the 48 observations dated 2023 is 95.30%.
Does high persistence mean education quality is high?
No. Persistence measures staying in school through grade 5, not learning outcomes or overall education quality.
Related Articles
Green Map creates custom-edited map images using open geographic data sources such as geoBoundaries, Natural Earth, OpenStreetMap, and government open data. These maps are edited visual materials, not raw data files, and are provided for education, documents, presentations, and graphic reference.