Gross fixed capital formation tracks investment in fixed assets used in production over more than one period. The World Bank series has 167 latest non-empty observations, including 124 from 2025 and 32 from 2024. Because the reference years differ, the latest-observation view is separated from the same-year 2025 comparison.
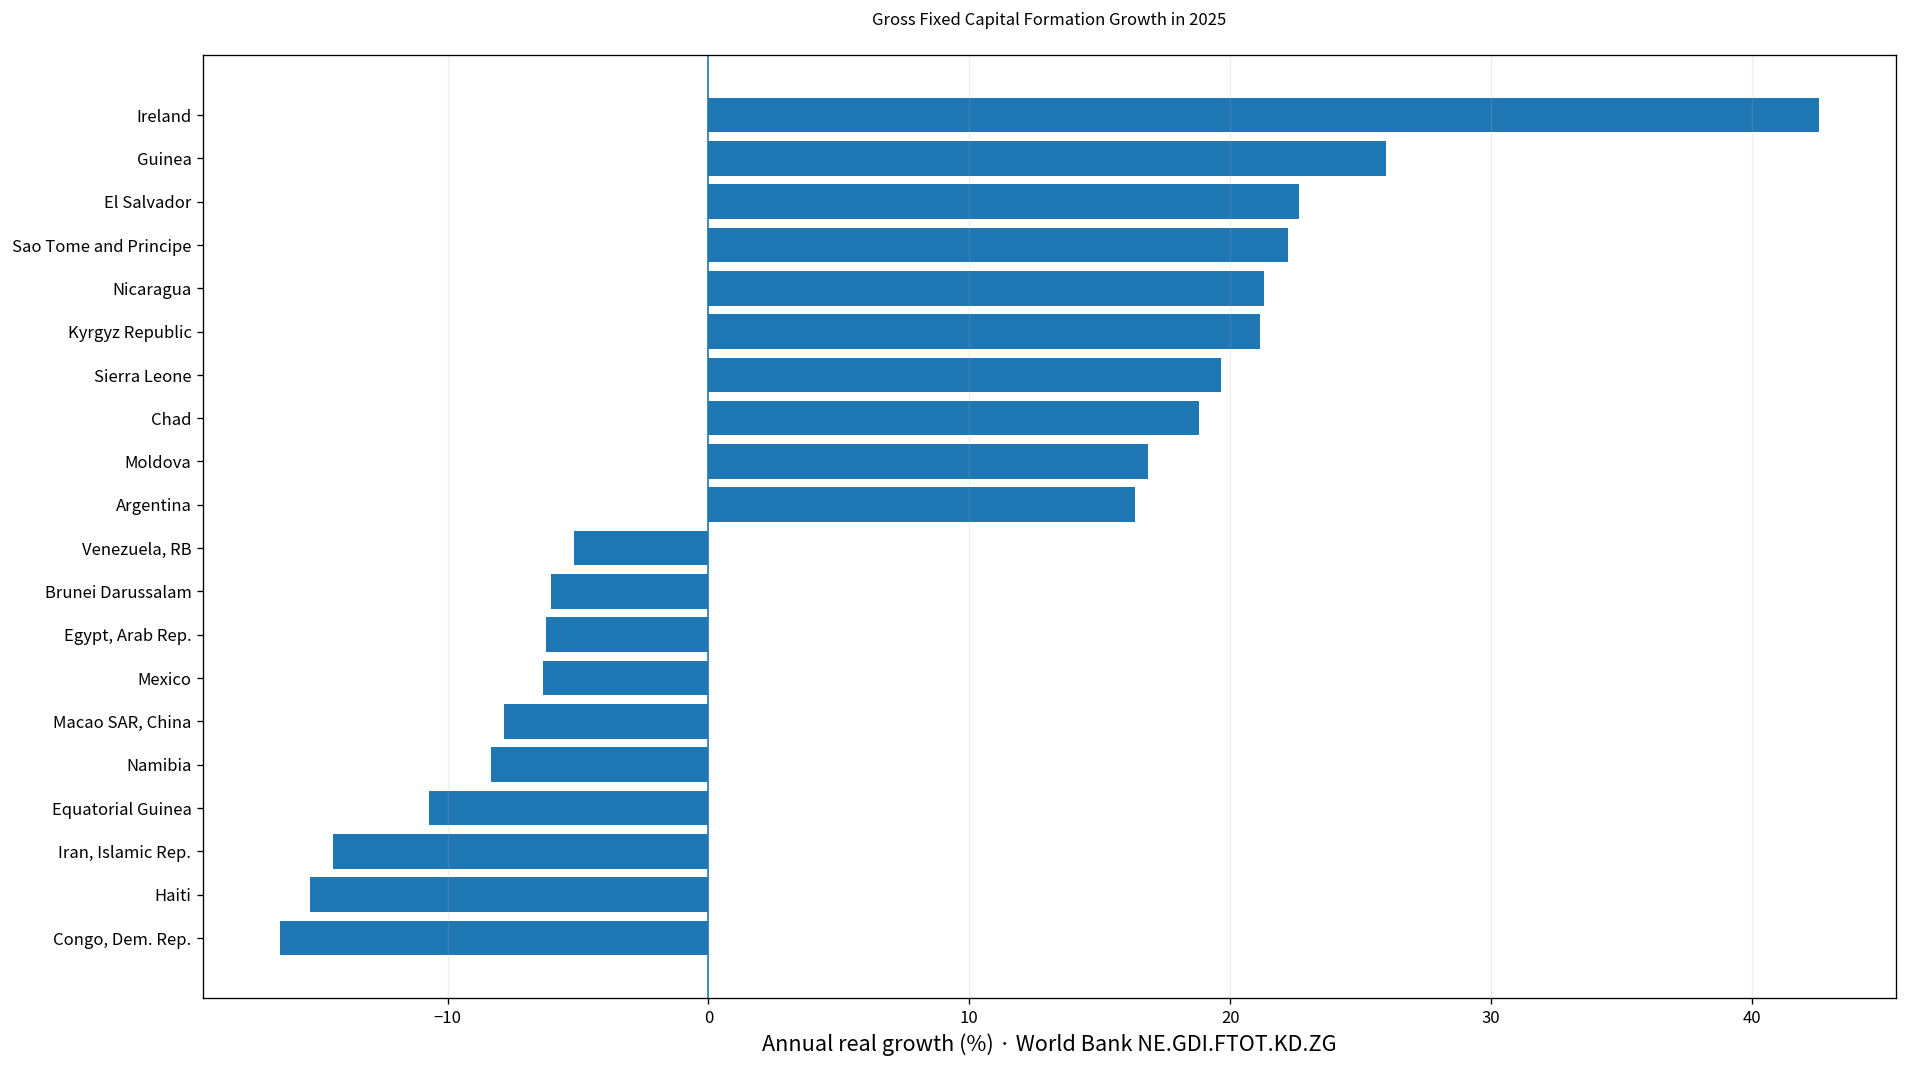
Table of Contents
What gross fixed capital formation growth measures
The indicator covers real year-over-year change in investment in fixed assets such as buildings, machinery, transport equipment, infrastructure, and certain intellectual-property assets. A value of 10% means fixed investment increased by about 10% from the previous year; it does not mean investment equals 10% of GDP.
Growth and level are different concepts. An economy can record rapid investment growth from a low starting point, while another can have a much larger investment level but a modest annual increase.
The 167 latest observations cover several years
124 observations are dated 2025, 32 are dated 2024, and 3 are dated 2023. A small number of latest values are older, extending back to 2004. Those older readings are useful for availability but should not be inserted into a 2025 ranking.
| Observation year | Economies/territories | Share of 167 |
|---|---|---|
| 2025 | 124 | 74.3% |
| 2024 | 32 | 19.2% |
| 2023 | 3 | 1.8% |
| 2022 | 1 | 0.6% |
| 2018 | 1 | 0.6% |
| 2016 | 1 | 0.6% |
| 2014 | 1 | 0.6% |
| 2013 | 1 | 0.6% |
| 2011 | 1 | 0.6% |
| 2009 | 1 | 0.6% |
| 2004 | 1 | 0.6% |
Across the mixed-year set, the mean is 8.66% and the median 4.50%. The maximum is Eritrea’s 2011 value of 466.89% and the minimum is Iraq’s 2024 value of -39.83%. These mixed-year statistics are not a current global investment-growth rate.
The 2025 median is 4.32%
The 2025 subset contains 124 economies. Its mean is 5.00% and median 4.32%. The first quartile is 0.08% and the third quartile 9.17%. 94 observations are positive, 29 are negative, and 1 is exactly zero.
27 economies record growth of at least 10%, while 4 are at or below -10%. The center is moderately positive, but both tails are wide.
Ireland records the highest 2025 value at 42.56%
Ireland is highest at 42.56%, followed by Guinea at 25.97%, El Salvador at 22.62%, Sao Tome and Principe at 22.21%, Nicaragua at 21.30%, and Kyrgyz Republic at 21.14%. Sierra Leone, Chad, Moldova, Argentina, and Armenia are also among the higher values.
| 2025 rank | Economy | Growth rate |
|---|---|---|
| 1 | Ireland | 42.56% |
| 2 | Guinea | 25.97% |
| 3 | El Salvador | 22.62% |
| 4 | Sao Tome and Principe | 22.21% |
| 5 | Nicaragua | 21.30% |
| 6 | Kyrgyz Republic | 21.14% |
| 7 | Sierra Leone | 19.65% |
| 8 | Chad | 18.80% |
| 9 | Moldova | 16.86% |
| 10 | Argentina | 16.36% |
| 11 | Armenia | 15.60% |
| 12 | Samoa | 14.11% |
| 13 | Sri Lanka | 13.70% |
| 14 | Pakistan | 13.17% |
| 15 | Djibouti | 12.92% |
A high growth rate means fixed investment rose quickly from the prior year, not that the economy has the world’s largest investment level. Base effects, major projects, construction cycles, and equipment spending can all influence the annual rate.
Congo, Dem. Rep. records the lowest 2025 value at -16.42%
Congo, Dem. Rep. is lowest at -16.42%, followed by Haiti at -15.27%, Iran, Islamic Rep. at -14.39%, and Equatorial Guinea at -10.73%. Namibia, Macao SAR, China, Mexico, Egypt, Arab Rep., and Brunei Darussalam also show sizable declines.
| Low-order position in 2025 | Economy | Growth rate |
|---|---|---|
| 1 | Congo, Dem. Rep. | -16.42% |
| 2 | Haiti | -15.27% |
| 3 | Iran, Islamic Rep. | -14.39% |
| 4 | Equatorial Guinea | -10.73% |
| 5 | Namibia | -8.34% |
| 6 | Macao SAR, China | -7.82% |
| 7 | Mexico | -6.35% |
| 8 | Egypt, Arab Rep. | -6.21% |
| 9 | Brunei Darussalam | -6.03% |
| 10 | Venezuela, RB | -5.15% |
| 11 | Nepal | -4.06% |
| 12 | Niger | -3.73% |
| 13 | Denmark | -3.51% |
| 14 | Korea, Rep. | -3.23% |
| 15 | Mauritius | -3.08% |
A negative rate means real fixed capital formation fell from the previous year. It does not by itself establish recession or poor policy outcomes. Project timing, construction cycles, financing conditions, and equipment investment can all affect the result.
Why 2024 and 2025 should not be merged into one ranking
The 2024 subset contains 32 observations, with a mean of 5.14% and a median of 5.57%. Its range is -39.83% to 41.71%. Mixing 2024 and 2025 would compare investment changes that occurred under different conditions.
Older latest observations require even more caution. Eritrea’s 2011 figure is historically valid, but it is not a current investment-growth rate. Keeping the year beside every value preserves the time dimension.
Gross fixed capital formation is not gross capital formation
Gross fixed capital formation focuses on fixed assets. Gross capital formation is broader and can also include inventory changes and acquisitions less disposals of valuables. The two measures should not be treated as interchangeable.
The growth rate also does not measure investment efficiency or future productivity directly. Similar growth rates can reflect very different asset mixes, project quality, financing costs, and existing capital stocks.
Complete list of the 167 latest observations
The table below lists the latest non-empty observation for every economy in alphabetical order. The observation year is shown explicitly so older values are not mistaken for 2025 data. For a strict same-year comparison, use only rows dated 2025.
| Economy | Observation year | Gross fixed capital formation growth |
|---|---|---|
| Afghanistan | 2024 | 2.76% |
| Albania | 2025 | 5.02% |
| Algeria | 2025 | 12.17% |
| Angola | 2024 | 2.64% |
| Argentina | 2025 | 16.36% |
| Armenia | 2025 | 15.60% |
| Australia | 2025 | 1.58% |
| Austria | 2025 | 1.37% |
| Azerbaijan | 2014 | 1.38% |
| Bahamas, The | 2024 | 20.66% |
| Bahrain | 2024 | 6.48% |
| Bangladesh | 2025 | -2.45% |
| Belarus | 2025 | 10.00% |
| Belgium | 2025 | 0.10% |
| Belize | 2024 | 5.88% |
| Benin | 2025 | 10.69% |
| Bermuda | 2024 | 3.32% |
| Bhutan | 2024 | 5.75% |
| Bolivia | 2024 | -10.85% |
| Bosnia and Herzegovina | 2024 | 10.24% |
| Botswana | 2025 | -1.21% |
| Brazil | 2025 | 2.93% |
| Brunei Darussalam | 2025 | -6.03% |
| Bulgaria | 2025 | 0.00% |
| Burkina Faso | 2025 | 7.93% |
| Cambodia | 2025 | 3.68% |
| Cameroon | 2025 | 8.22% |
| Canada | 2025 | 1.41% |
| Central African Republic | 2025 | 2.08% |
| Chad | 2025 | 18.80% |
| Chile | 2025 | 6.97% |
| Colombia | 2025 | 1.34% |
| Comoros | 2025 | 3.79% |
| Congo, Dem. Rep. | 2025 | -16.42% |
| Congo, Rep. | 2025 | 5.00% |
| Costa Rica | 2025 | 3.92% |
| Cote d’Ivoire | 2025 | 10.54% |
| Croatia | 2025 | 6.14% |
| Cuba | 2024 | 3.66% |
| Cyprus | 2025 | 0.00% |
| Czechia | 2025 | 2.43% |
| Denmark | 2025 | -3.51% |
| Djibouti | 2025 | 12.92% |
| Dominican Republic | 2025 | -3.03% |
| Ecuador | 2025 | 5.58% |
| Egypt, Arab Rep. | 2025 | -6.21% |
| El Salvador | 2025 | 22.62% |
| Equatorial Guinea | 2025 | -10.73% |
| Eritrea | 2011 | 466.89% |
| Estonia | 2025 | 3.20% |
| Eswatini | 2024 | 0.27% |
| Ethiopia | 2025 | 3.43% |
| Finland | 2025 | 0.76% |
| France | 2025 | 0.55% |
| Gabon | 2025 | 11.26% |
| Gambia, The | 2025 | 8.31% |
| Georgia | 2025 | -2.83% |
| Germany | 2025 | -0.18% |
| Ghana | 2024 | 13.83% |
| Greece | 2025 | 8.88% |
| Greenland | 2023 | -3.77% |
| Guatemala | 2025 | 11.28% |
| Guinea | 2025 | 25.97% |
| Guinea-Bissau | 2025 | 3.73% |
| Haiti | 2025 | -15.27% |
| Honduras | 2025 | -0.12% |
| Hong Kong SAR, China | 2025 | 4.34% |
| Hungary | 2025 | -2.79% |
| Iceland | 2025 | 4.04% |
| India | 2025 | 7.08% |
| Indonesia | 2025 | 5.09% |
| Iran, Islamic Rep. | 2025 | -14.39% |
| Iraq | 2024 | -39.83% |
| Ireland | 2025 | 42.56% |
| Israel | 2025 | 8.35% |
| Italy | 2025 | 3.47% |
| Japan | 2024 | -0.57% |
| Kazakhstan | 2024 | 6.50% |
| Kenya | 2025 | 5.61% |
| Kiribati | 2024 | 27.09% |
| Korea, Rep. | 2025 | -3.23% |
| Kosovo | 2024 | 6.96% |
| Kyrgyz Republic | 2025 | 21.14% |
| Lao PDR | 2016 | 7.00% |
| Latvia | 2025 | 9.78% |
| Lebanon | 2024 | -31.63% |
| Lesotho | 2025 | 6.61% |
| Libya | 2025 | 8.57% |
| Lithuania | 2025 | 8.03% |
| Luxembourg | 2025 | -0.46% |
| Macao SAR, China | 2025 | -7.82% |
| Madagascar | 2025 | 12.33% |
| Malaysia | 2025 | 9.61% |
| Maldives | 2024 | 5.40% |
| Mali | 2025 | 9.60% |
| Malta | 2025 | -0.06% |
| Marshall Islands | 2024 | 19.01% |
| Mauritania | 2025 | 7.65% |
| Mauritius | 2025 | -3.08% |
| Mexico | 2025 | -6.35% |
| Moldova | 2025 | 16.86% |
| Mongolia | 2025 | 9.01% |
| Montenegro | 2025 | 11.04% |
| Morocco | 2024 | 12.83% |
| Namibia | 2025 | -8.34% |
| Nepal | 2025 | -4.06% |
| Netherlands | 2025 | 1.09% |
| New Zealand | 2024 | -4.95% |
| Nicaragua | 2025 | 21.30% |
| Niger | 2025 | -3.73% |
| North Macedonia | 2024 | 4.97% |
| Norway | 2025 | 1.29% |
| Oman | 2024 | 7.13% |
| Pakistan | 2025 | 13.17% |
| Palau | 2024 | 12.65% |
| Panama | 2024 | 2.38% |
| Papua New Guinea | 2004 | -0.48% |
| Paraguay | 2025 | 12.24% |
| Peru | 2025 | 9.85% |
| Philippines | 2025 | 0.78% |
| Poland | 2025 | 4.34% |
| Portugal | 2025 | 3.58% |
| Puerto Rico (US) | 2025 | 1.97% |
| Romania | 2025 | 3.44% |
| Russian Federation | 2025 | -0.37% |
| Rwanda | 2025 | 10.88% |
| Samoa | 2025 | 14.11% |
| San Marino | 2023 | -4.74% |
| Sao Tome and Principe | 2025 | 22.21% |
| Saudi Arabia | 2025 | -1.73% |
| Senegal | 2025 | 5.84% |
| Serbia | 2025 | 0.84% |
| Seychelles | 2025 | -0.68% |
| Sierra Leone | 2025 | 19.65% |
| Singapore | 2025 | 6.15% |
| Slovak Republic | 2025 | 2.22% |
| Slovenia | 2025 | 4.08% |
| Solomon Islands | 2024 | 2.11% |
| Somalia, Fed. Rep. | 2025 | 8.70% |
| South Africa | 2025 | -2.21% |
| Spain | 2025 | 5.82% |
| Sri Lanka | 2025 | 13.70% |
| Sudan | 2025 | 4.50% |
| Sweden | 2025 | 1.99% |
| Switzerland | 2025 | -0.54% |
| Syrian Arab Republic | 2022 | 19.48% |
| Tajikistan | 2013 | 5.06% |
| Tanzania | 2025 | 9.03% |
| Thailand | 2025 | 4.91% |
| Timor-Leste | 2024 | 41.71% |
| Togo | 2023 | -19.77% |
| Tonga | 2024 | 9.16% |
| Tunisia | 2025 | 4.31% |
| Turkiye | 2025 | 6.95% |
| Uganda | 2025 | 7.16% |
| Ukraine | 2025 | 10.87% |
| United Arab Emirates | 2009 | 9.06% |
| United Kingdom | 2025 | 4.27% |
| United States | 2024 | 3.47% |
| Uruguay | 2025 | 0.27% |
| Uzbekistan | 2025 | 10.53% |
| Vanuatu | 2024 | 14.23% |
| Venezuela, RB | 2025 | -5.15% |
| Viet Nam | 2025 | 8.60% |
| West Bank and Gaza | 2025 | 4.66% |
| Yemen, Rep. | 2018 | 181.82% |
| Zimbabwe | 2024 | 1.20% |
How to interpret the comparison
First, separate the latest-observation view from the 2025 subset. Second, distinguish growth from the investment level or GDP share. Third, one-year changes can be volatile and should not be treated as a long-run trend without a time series. Fourth, the indicator alone does not identify the cause of a large move.
National-accounts figures can be revised. A detailed country analysis should check the most recent World Bank series and the relevant national statistical source.
Source and calculation
The source is World Bank World Development Indicators NE.GDI.FTOT.KD.ZG, Gross fixed capital formation (annual % growth). The 2025 mean, median, quartiles, sign counts, and rankings are calculated from the 124 observations dated 2025.
Frequently Asked Questions
Are all 167 latest observations from 2025?
No. 124 are dated 2025, 32 are from 2024, and a small number are older.
What is the median gross fixed capital formation growth rate in 2025?
The median across the 124 observations dated 2025 is 4.32%, while the mean is 5.00%.
Does a high growth rate mean the investment level is highest?
No. The growth rate measures year-over-year change; the investment level and its share of GDP are separate measures.
Related Articles
Green Map creates custom-edited map images using open geographic data sources such as geoBoundaries, Natural Earth, OpenStreetMap, and government open data. These maps are edited visual materials, not raw data files, and are provided for education, documents, presentations, and graphic reference.