The residual share of merchandise imports measures the portion of a reporting economy’s total merchandise imports that remains after imports from World Bank high-, low-, and middle-income economy groups are summed. The World Bank data contains 205 economies and territories, all for 2023. The mean is 0.0796% and the median only 0.0004%, while Dominica reaches 3.51%. This is a share of total imports, not an import-value measure.
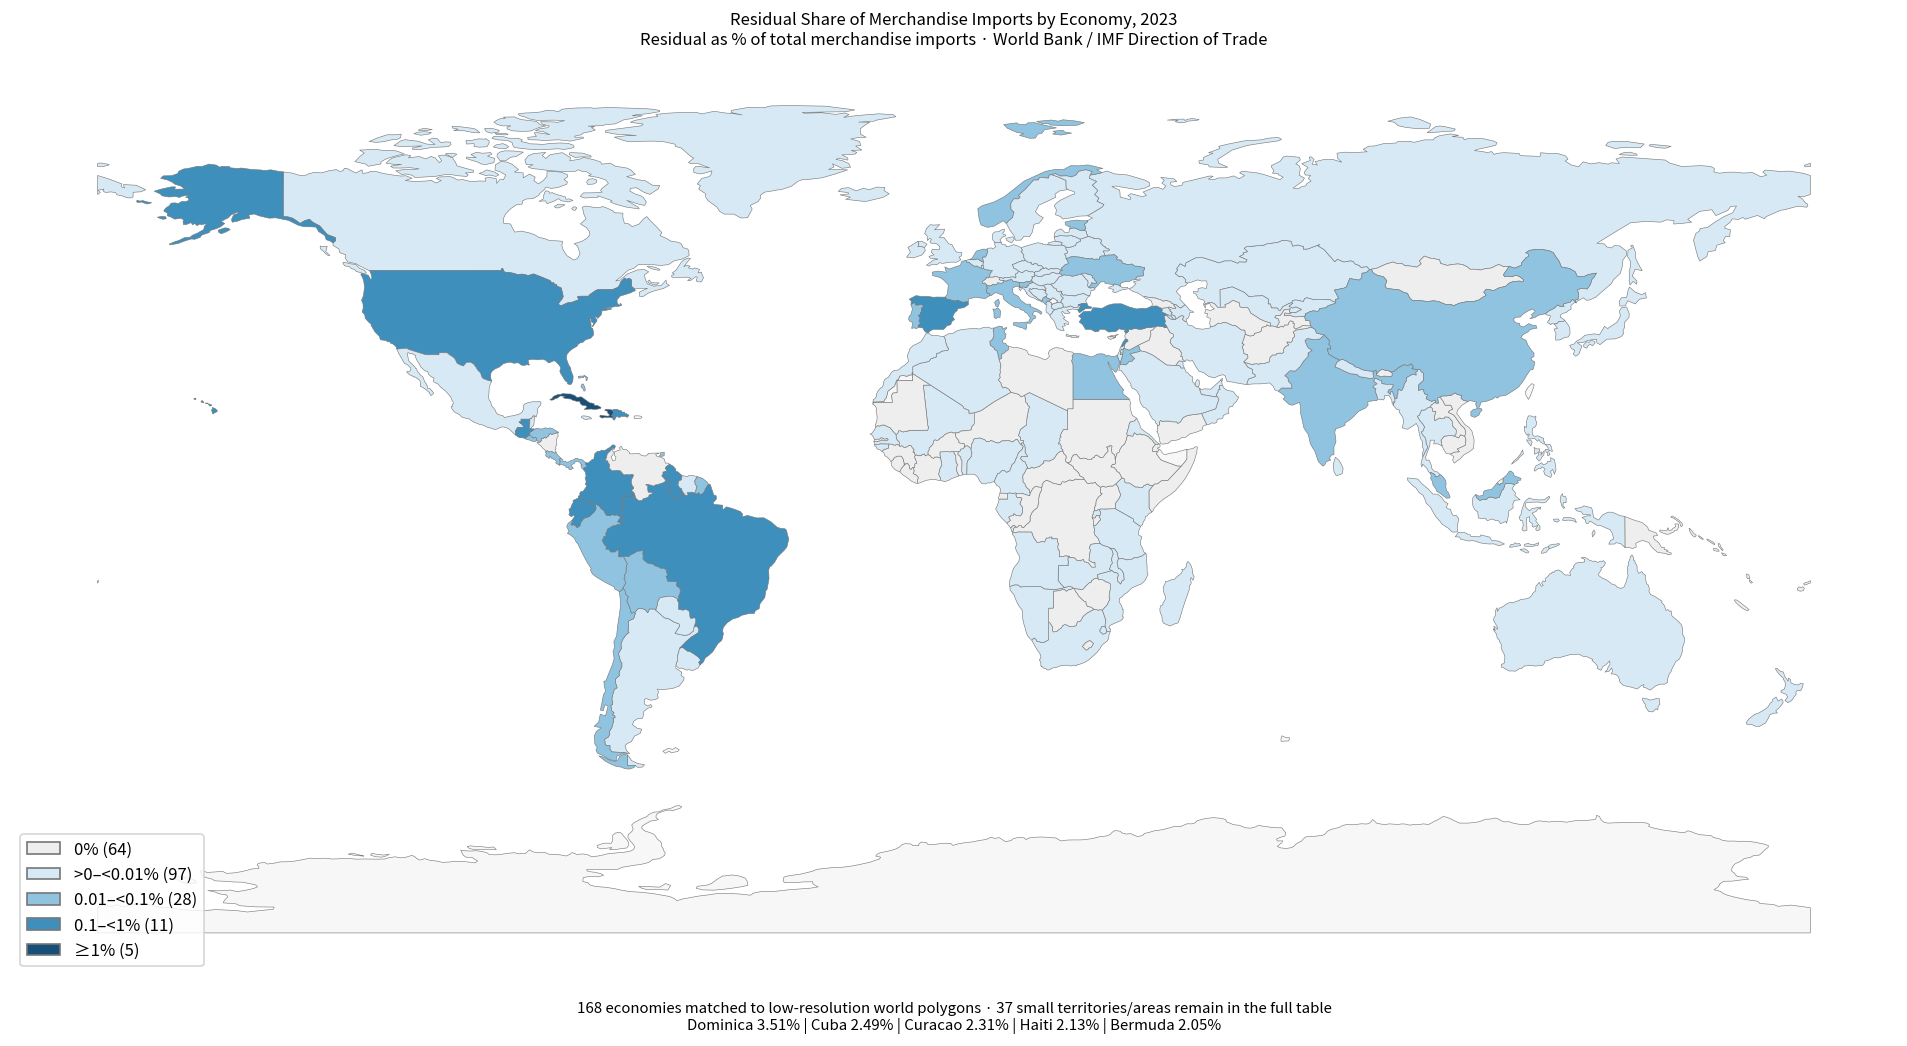
Table of Contents
What the residual merchandise-import share means
World Bank indicator TM.VAL.MRCH.RS.ZS defines the residual as total merchandise imports reported by an economy from the rest of the world minus the sum of imports from high-, low-, and middle-income economies under the World Bank classification. The residual can include trade with unspecified partners or economies not covered by that classification. It should therefore not be described simply as missing trade.
The result is expressed as a percentage of the reporting economy’s total merchandise imports. A value of 2% means that about 2% of merchandise imports fall into this residual after the income-group partner categories are subtracted. It does not mean imports grew by 2%, nor does it measure tariffs, the trade balance, or the absolute value of imports.
All 205 observations refer to 2023
All 205 observations are dated 2023, so country shares can be compared directly without mixing periods. The simple mean is 0.0796%, the median 0.0004%, the first quartile 0.0000%, and the third quartile 0.0047%.
60 economies are recorded at exactly zero. Two additional values are tiny negative floating-point residuals on the order of 10^-14 and are effectively zero rather than meaningful negative import shares. Only 16 economies are at or above 0.1%, and just 5 are at or above 1%. Most of the distribution is therefore concentrated extremely close to zero.
The strongest geographic cluster is in the Caribbean and nearby economies
The upper tail is visibly concentrated in the Caribbean and neighboring parts of the Americas. Dominica is highest at 3.51%, followed by Cuba at 2.49%, Curacao at 2.31%, Haiti at 2.13%, and Bermuda at 2.05%. The Dominican Republic is also elevated at 0.56%, while Guyana, Colombia, Guatemala, Brazil, and Ecuador stand above the global median by a wide margin.
The map makes this cluster easy to see, but geography is not a causal explanation. Partner reporting, unspecified counterparties, the coverage of World Bank income classifications, and the structure of IMF Direction of Trade data can all affect the residual. Country-specific causes require inspection of bilateral trade records rather than inference from the map alone.
Highest residual shares in 2023
| Rank | Economy/territory | Residual share |
|---|---|---|
| 1 | Dominica | 3.51% |
| 2 | Cuba | 2.49% |
| 3 | Curacao | 2.31% |
| 4 | Haiti | 2.13% |
| 5 | Bermuda | 2.05% |
| 6 | Lebanon | 0.5861% |
| 7 | Dominican Republic | 0.5634% |
| 8 | Guyana | 0.3621% |
| 9 | Colombia | 0.2126% |
| 10 | Guatemala | 0.1866% |
| 11 | Brazil | 0.1717% |
| 12 | Spain | 0.1463% |
| 13 | Aruba | 0.1402% |
| 14 | Ecuador | 0.1343% |
| 15 | United States | 0.1165% |
The top five all exceed 2%, but the sixth-highest observation, Lebanon, falls to about 0.59%. This sharp break shows that a handful of outliers dominate the upper tail. By the time the ranking reaches Guatemala, the share is below 0.2%. The median of 0.0004% is therefore much more representative of a typical observation than the mean of 0.0796%.
Most economies are extremely close to zero
For visualization, values with an absolute magnitude below 1e-10 are grouped with zero. Under that map rule, 64 economies fall in the 0% band and 97 are above zero but below 0.01%. Together, 161 of 205 observations are below 0.01%. Another 28 lie between 0.01% and 0.1%, 11 between 0.1% and 1%, and 5 are at least 1%.
A continuous linear color scale would make most countries look nearly identical because the top five observations are so much larger than the rest. The map therefore uses discrete bands. This changes only the visual classification, not the underlying data.
Small islands require a map caveat
The featured map uses a low-resolution Natural Earth boundary layer and directly matches 168 economies. 37 data rows, mostly small islands and territories, do not have a directly matching standalone polygon in that layer. Their observations are not dropped: they remain in the ranking and complete 205-row table.
This limitation matters because Dominica, Curacao, and Bermuda are among the highest observations. A world map alone can therefore understate the importance of very small territories. The correct reading combines the map for broad spatial patterns with the table for complete coverage.
A high residual share is not the same as high import dependence
The residual is a composition share of total merchandise imports. A high percentage does not tell us whether the economy imports a large absolute amount, whether imports are large relative to GDP, or whether it runs a trade deficit. A small economy can have a high residual share with modest total imports, while a major importer can have a residual close to zero.
The indicator should also not be treated as a direct data-quality score. Unspecified partners can contribute to the residual, but so can trade with economies outside the relevant World Bank income classifications. A zero value likewise does not prove perfect bilateral reporting. The measure answers a narrower accounting question about the income-group decomposition of merchandise imports.
Complete list of 205 economies and territories
The table below lists every 2023 observation alphabetically. Small percentages are shown to four decimal places for readability. Tiny floating-point negatives that round to zero are displayed as 0.0000%, while the original precision remains in the underlying World Bank values.
| Economy/territory | Year | Residual share of merchandise imports |
|---|---|---|
| Afghanistan | 2023 | 0.0000% |
| Albania | 2023 | 0.0004% |
| Algeria | 2023 | 0.0000% |
| American Samoa | 2023 | 0.0000% |
| Angola | 2023 | 0.0000% |
| Antigua and Barbuda | 2023 | 0.0031% |
| Argentina | 2023 | 0.0016% |
| Armenia | 2023 | 0.0000% |
| Aruba | 2023 | 0.1402% |
| Australia | 2023 | 0.0004% |
| Austria | 2023 | 0.0005% |
| Azerbaijan | 2023 | 0.0000% |
| Bahamas, The | 2023 | 0.0187% |
| Bahrain | 2023 | 0.0004% |
| Bangladesh | 2023 | 0.0003% |
| Barbados | 2023 | 0.0000% |
| Belarus | 2023 | 0.0000% |
| Belgium | 2023 | 0.0043% |
| Belize | 2023 | 0.0001% |
| Benin | 2023 | 0.0000% |
| Bermuda | 2023 | 2.05% |
| Bhutan | 2023 | 0.0000% |
| Bolivia | 2023 | 0.0357% |
| Bosnia and Herzegovina | 2023 | 0.0010% |
| Botswana | 2023 | 0.0000% |
| Brazil | 2023 | 0.1717% |
| Brunei Darussalam | 2023 | 0.0000% |
| Bulgaria | 2023 | 0.0008% |
| Burkina Faso | 2023 | 0.0000% |
| Burundi | 2023 | 0.0000% |
| Cabo Verde | 2023 | 0.0000% |
| Cambodia | 2023 | 0.0000% |
| Cameroon | 2023 | 0.0000% |
| Canada | 2023 | 0.0030% |
| Central African Republic | 2023 | 0.0000% |
| Chad | 2023 | 0.0001% |
| Chile | 2023 | 0.0174% |
| China | 2023 | 0.0294% |
| Colombia | 2023 | 0.2126% |
| Comoros | 2023 | 0.0726% |
| Congo, Dem. Rep. | 2023 | 0.0000% |
| Congo, Rep. | 2023 | 0.0000% |
| Costa Rica | 2023 | 0.0316% |
| Cote d’Ivoire | 2023 | 0.0000% |
| Croatia | 2023 | 0.0006% |
| Cuba | 2023 | 2.49% |
| Curacao | 2023 | 2.31% |
| Cyprus | 2023 | 0.0017% |
| Czechia | 2023 | 0.0027% |
| Denmark | 2023 | 0.0001% |
| Djibouti | 2023 | 0.0000% |
| Dominica | 2023 | 3.51% |
| Dominican Republic | 2023 | 0.5634% |
| Ecuador | 2023 | 0.1343% |
| Egypt, Arab Rep. | 2023 | 0.0257% |
| El Salvador | 2023 | 0.0121% |
| Equatorial Guinea | 2023 | 0.0000% |
| Eritrea | 2023 | 0.0003% |
| Estonia | 2023 | 0.0236% |
| Eswatini | 2023 | 0.0001% |
| Ethiopia | 2023 | 0.0000% |
| Faroe Islands | 2023 | 0.0004% |
| Fiji | 2023 | 0.0000% |
| Finland | 2023 | 0.0000% |
| France | 2023 | 0.0134% |
| French Polynesia | 2023 | 0.0000% |
| Gabon | 2023 | 0.0016% |
| Gambia, The | 2023 | 0.0000% |
| Georgia | 2023 | 0.0000% |
| Germany | 2023 | 0.0009% |
| Ghana | 2023 | 0.0006% |
| Gibraltar | 2023 | 0.0000% |
| Greece | 2023 | 0.0023% |
| Greenland | 2023 | 0.0005% |
| Grenada | 2023 | 0.0396% |
| Guam | 2023 | 0.0000% |
| Guatemala | 2023 | 0.1866% |
| Guinea | 2023 | 0.0000% |
| Guinea-Bissau | 2023 | 0.0034% |
| Guyana | 2023 | 0.3621% |
| Haiti | 2023 | 2.13% |
| Honduras | 2023 | 0.0128% |
| Hong Kong SAR, China | 2023 | 0.0012% |
| Hungary | 2023 | 0.0007% |
| Iceland | 2023 | 0.0004% |
| India | 2023 | 0.0269% |
| Indonesia | 2023 | 0.0092% |
| Iran, Islamic Rep. | 2023 | 0.0011% |
| Iraq | 2023 | 0.0000% |
| Ireland | 2023 | 0.0002% |
| Israel | 2023 | 0.0002% |
| Italy | 2023 | 0.0279% |
| Jamaica | 2023 | 0.0093% |
| Japan | 2023 | 0.0017% |
| Jordan | 2023 | 0.0340% |
| Kazakhstan | 2023 | 0.0000% |
| Kenya | 2023 | 0.0001% |
| Kiribati | 2023 | 0.0000% |
| Korea, Dem. People’s Rep. | 2023 | 0.0036% |
| Korea, Rep. | 2023 | 0.0012% |
| Kosovo | 2023 | 0.0009% |
| Kuwait | 2023 | 0.0007% |
| Kyrgyz Republic | 2023 | 0.0000% |
| Lao PDR | 2023 | 0.0000% |
| Latvia | 2023 | 0.0050% |
| Lebanon | 2023 | 0.5861% |
| Lesotho | 2023 | 0.0000% |
| Liberia | 2023 | 0.0000% |
| Libya | 2023 | 0.0000% |
| Lithuania | 2023 | 0.0091% |
| Luxembourg | 2023 | 0.0000% |
| Macao SAR, China | 2023 | 0.0301% |
| Madagascar | 2023 | 0.0000% |
| Malawi | 2023 | 0.0008% |
| Malaysia | 2023 | 0.0149% |
| Maldives | 2023 | 0.0005% |
| Mali | 2023 | 0.0000% |
| Malta | 2023 | 0.0000% |
| Marshall Islands | 2023 | 0.0000% |
| Mauritania | 2023 | 0.0000% |
| Mauritius | 2023 | 0.0000% |
| Mexico | 2023 | 0.0028% |
| Micronesia, Fed. Sts. | 2023 | 0.0000% |
| Moldova | 2023 | 0.0035% |
| Mongolia | 2023 | 0.0000% |
| Montenegro | 2023 | 0.0541% |
| Morocco | 2023 | 0.0016% |
| Mozambique | 2023 | 0.0005% |
| Myanmar | 2023 | 0.0000% |
| Namibia | 2023 | 0.0000% |
| Naoero | 2023 | 0.0000% |
| Nepal | 2023 | 0.0015% |
| Netherlands | 2023 | 0.0223% |
| New Caledonia | 2023 | 0.0000% |
| New Zealand | 2023 | 0.0006% |
| Nicaragua | 2023 | 0.0000% |
| Niger | 2023 | 0.0000% |
| Nigeria | 2023 | 0.0014% |
| North Macedonia | 2023 | 0.0005% |
| Norway | 2023 | 0.0259% |
| Oman | 2023 | 0.0000% |
| Pakistan | 2023 | 0.0000% |
| Palau | 2023 | 0.0000% |
| Panama | 2023 | 0.0743% |
| Papua New Guinea | 2023 | 0.0000% |
| Paraguay | 2023 | 0.0004% |
| Peru | 2023 | 0.0421% |
| Philippines | 2023 | 0.0021% |
| Poland | 2023 | 0.0090% |
| Portugal | 2023 | 0.0341% |
| Qatar | 2023 | 0.0010% |
| Romania | 2023 | 0.0098% |
| Russian Federation | 2023 | 0.0020% |
| Rwanda | 2023 | 0.0031% |
| Samoa | 2023 | 0.0000% |
| San Marino | 2023 | 0.0000% |
| Sao Tome and Principe | 2023 | 0.0000% |
| Saudi Arabia | 2023 | 0.0016% |
| Senegal | 2023 | 0.0014% |
| Serbia | 2023 | 0.0034% |
| Seychelles | 2023 | 0.0000% |
| Sierra Leone | 2023 | 0.0000% |
| Singapore | 2023 | 0.0006% |
| Sint Maarten (Dutch part) | 2023 | 0.0000% |
| Slovak Republic | 2023 | 0.0000% |
| Slovenia | 2023 | 0.0256% |
| Solomon Islands | 2023 | 0.0000% |
| Somalia, Fed. Rep. | 2023 | 0.0000% |
| South Africa | 2023 | 0.0000% |
| South Sudan | 2023 | 0.0000% |
| Spain | 2023 | 0.1463% |
| Sri Lanka | 2023 | 0.0003% |
| St. Kitts and Nevis | 2023 | 0.0907% |
| St. Lucia | 2023 | 0.0024% |
| St. Vincent and the Grenadines | 2023 | 0.0006% |
| Sudan | 2023 | 0.0000% |
| Suriname | 2023 | 0.0046% |
| Sweden | 2023 | 0.0001% |
| Switzerland | 2023 | 0.0000% |
| Syrian Arab Republic | 2023 | 0.0000% |
| Tajikistan | 2023 | 0.0000% |
| Tanzania | 2023 | 0.0022% |
| Thailand | 2023 | 0.0046% |
| Timor-Leste | 2023 | 0.0001% |
| Togo | 2023 | 0.0000% |
| Tonga | 2023 | 0.0000% |
| Trinidad and Tobago | 2023 | 0.0566% |
| Tunisia | 2023 | 0.0427% |
| Turkiye | 2023 | 0.1088% |
| Turkmenistan | 2023 | 0.0000% |
| Tuvalu | 2023 | 0.0000% |
| Uganda | 2023 | 0.0000% |
| Ukraine | 2023 | 0.0145% |
| United Arab Emirates | 2023 | 0.0047% |
| United Kingdom | 2023 | 0.0060% |
| United States | 2023 | 0.1165% |
| Uruguay | 2023 | 0.0000% |
| Uzbekistan | 2023 | 0.0001% |
| Vanuatu | 2023 | 0.0000% |
| Venezuela, RB | 2023 | 0.0000% |
| Viet Nam | 2023 | 0.0000% |
| West Bank and Gaza | 2023 | 0.0001% |
| Yemen, Rep. | 2023 | 0.0000% |
| Zambia | 2023 | 0.0013% |
| Zimbabwe | 2023 | 0.0000% |
How to interpret the map and table
First, residual means the remainder after imports from World Bank high-, low-, and middle-income partner groups are summed. Second, the percentage is a share of imports, not the level or growth of imports. Third, small territories may not appear as filled polygons on a low-resolution world map and should be checked in the table. Fourth, spatial clustering is descriptive rather than causal.
Fifth, numerical values extremely close to zero can arise from the residual calculation and should not be interpreted as economically meaningful negative shares. Sixth, explaining a particular outlier requires bilateral partner data from IMF Direction of Trade together with the relevant World Bank economy classifications.
Source and calculation
The source indicator is World Bank World Development Indicators TM.VAL.MRCH.RS.ZS, based on World Bank staff estimates and the IMF Direction of Trade database. The reference year is 2023 and the unit is percent of total merchandise imports. Means, quartiles, rankings, and map bands are calculated directly from the published 2023 World Bank observations.
Frequently Asked Questions
Is the residual share the same as unreported imports?
No. It is the remainder after imports from World Bank high-, low-, and middle-income partner groups are subtracted, and it can include unspecified partners or economies outside the classification.
Which economy has the highest 2023 residual share?
Dominica is highest at 3.51%, followed by Cuba, Curacao, Haiti, and Bermuda.
Why can the map differ from the complete ranking?
The low-resolution boundary layer does not contain a directly matching standalone polygon for 37 small territories or areas, but all 205 observations remain in the complete table.
Related Articles
Green Map creates custom-edited map images using open geographic data sources such as geoBoundaries, Natural Earth, OpenStreetMap, and government open data. These maps are edited visual materials, not raw data files, and are provided for education, documents, presentations, and graphic reference.