Binding coverage measures the share of product tariff lines for which an agreed bound tariff rate exists. The verified World Bank dataset contains 161 latest non-empty observations, of which 136 are dated 2022. The 2022 distribution is highly polarized: 99 observations are exactly 0%, while 28 are at or above 90%. The median is therefore 0%, making the distribution much more informative than the average alone.
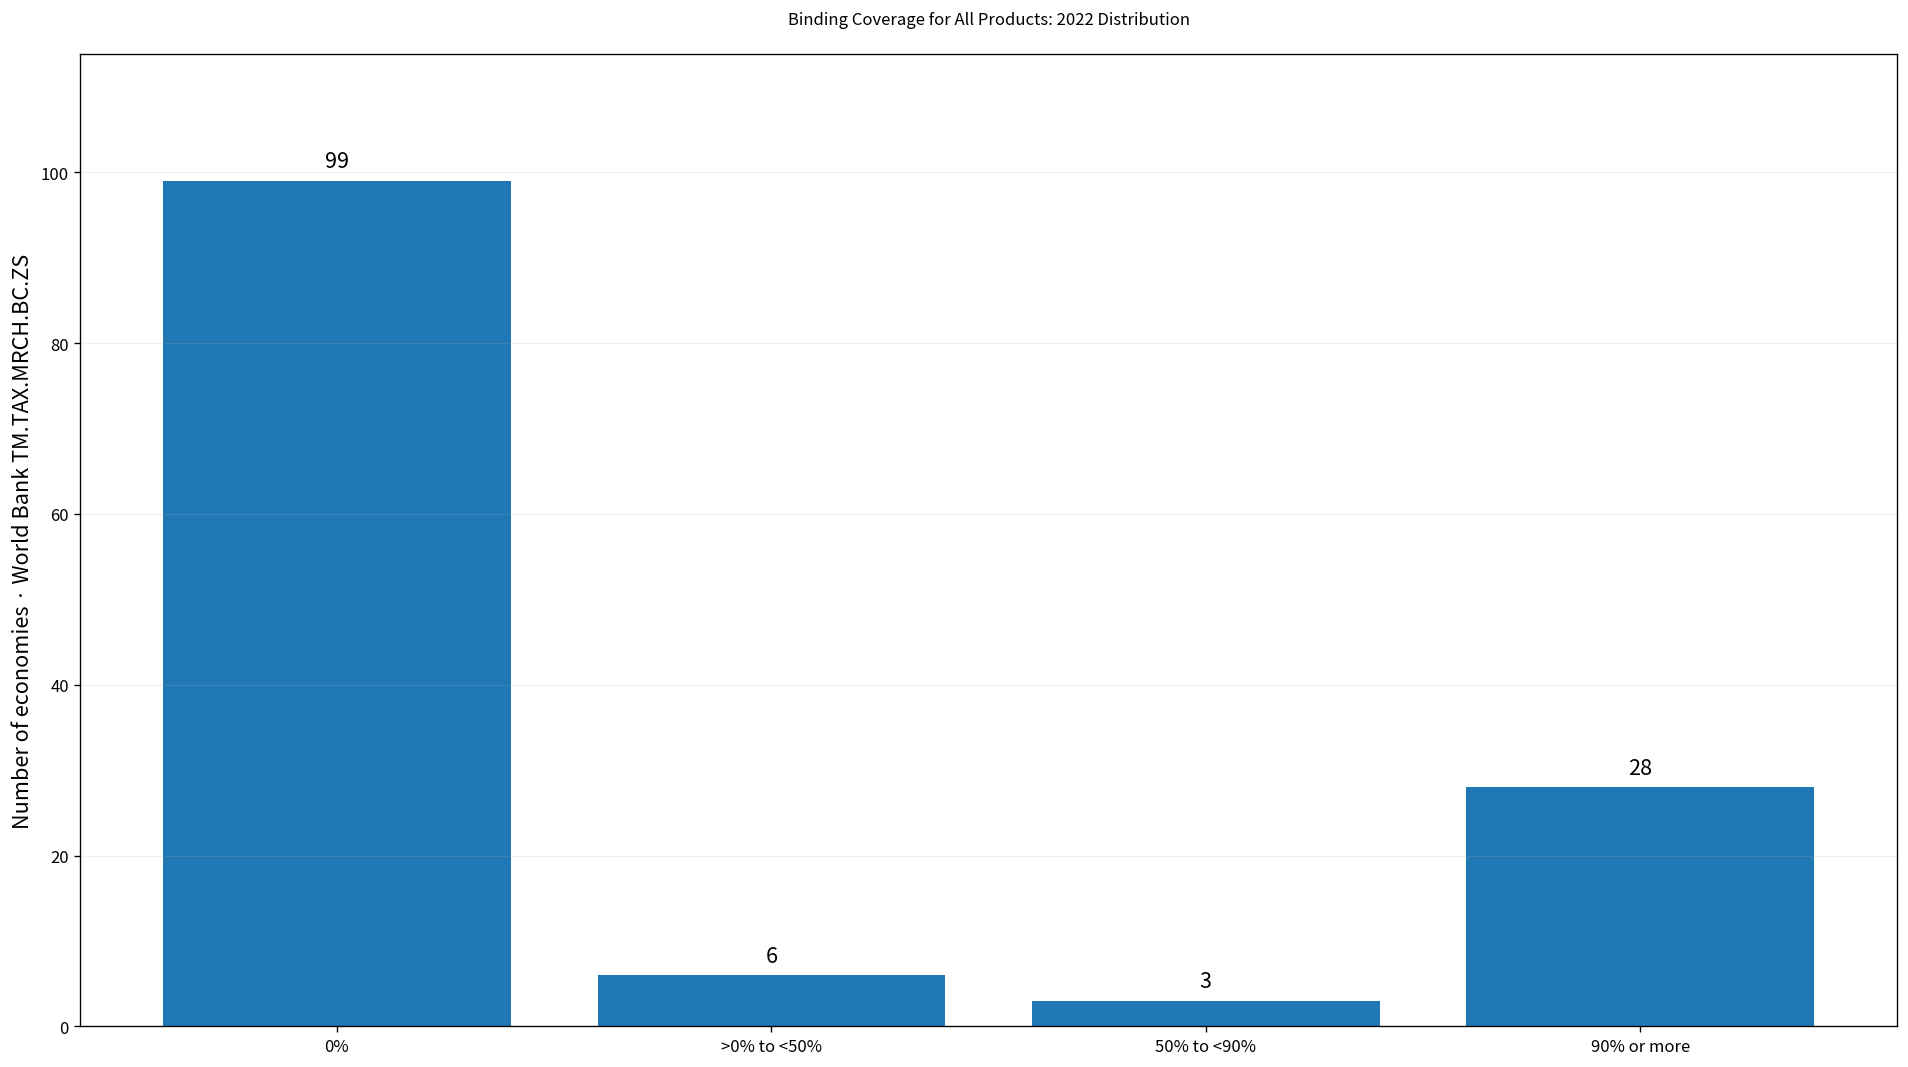
Table of Contents
What binding coverage measures
World Bank metadata defines binding coverage as the percentage of product lines with an agreed bound rate. Bound rates come from trade negotiations and are incorporated into schedules of concessions. They represent tariff commitments rather than the tariff necessarily charged on each import transaction. A product can have a bound rate that is higher than the applied rate.
This means binding coverage is not an average tariff-rate indicator. A value near 100% says that nearly all product tariff lines have a bound-rate commitment, while a value of 20% says that only a portion of tariff lines is covered. To study actual tariff burdens, readers would need separate indicators such as applied tariff rates, MFN tariff rates, or bound-rate averages.
Most of the 161 latest observations are from 2022
Of the 161 latest non-empty observations in the verified file, 136 are from 2022. There are 14 observations from 2021 and 6 from 2020, with a small number from 2019 through 2014. The year spread is narrower than in many other cross-country datasets, but it is still important to distinguish the complete latest-observation file from the 2022 same-year subset.
| Observation year | Economies/territories | Share of 161 |
|---|---|---|
| 2022 | 136 | 84.5% |
| 2021 | 14 | 8.7% |
| 2020 | 6 | 3.7% |
| 2019 | 1 | 0.6% |
| 2018 | 1 | 0.6% |
| 2017 | 1 | 0.6% |
| 2016 | 1 | 0.6% |
| 2014 | 1 | 0.6% |
Across all 161 mixed-year latest observations, the simple mean is 32.01% and the median is 0.00%. 100 observations are exactly zero, 61 are above zero, and 45 are at least 90%. The concentration at both zero and very high values makes the average an incomplete description of the dataset.
In 2022, 99 observations are zero and 28 are at least 90%
Among the 136 observations dated 2022, 99 are 0%, 6 fall above 0% but below 50%, 3 are between 50% and 90%, and 28 are at least 90%. The simple mean is 23.23%, yet both the median and first quartile are zero. If the zero observations are excluded, the remaining 37 positive values have a mean of 85.40% and a median of 99.98%.
That contrast shows why the 2022 distribution should not be described as if most economies had binding coverage around 23%. Instead, the data contain a large cluster at zero and another large cluster close to complete coverage. The featured chart therefore shows counts by coverage band rather than a single average.
Most 2022 observations above 90% are close to full coverage
Trinidad and Tobago records 100% in 2022. Angola, Argentina, Bolivia, Brazil, Chile, Colombia, Georgia, Grenada, Guyana, Lao PDR, Moldova, Mexico, Peru, Paraguay, Seychelles, Tonga, Ukraine, and Uruguay are at 99.98%. Cabo Verde, Jordan, and Venezuela, RB are also above 99.9%. These observations indicate very broad coverage of tariff lines by bound-rate commitments in this indicator.
| 2022 rank | Economy | Binding coverage, all products |
|---|---|---|
| 1 | Trinidad and Tobago | 100.00% |
| 2 | Angola | 99.98% |
| 3 | Argentina | 99.98% |
| 4 | Bolivia | 99.98% |
| 5 | Brazil | 99.98% |
| 6 | Chile | 99.98% |
| 7 | Colombia | 99.98% |
| 8 | Georgia | 99.98% |
| 9 | Grenada | 99.98% |
| 10 | Guyana | 99.98% |
| 11 | Lao PDR | 99.98% |
| 12 | Moldova | 99.98% |
| 13 | Mexico | 99.98% |
| 14 | Peru | 99.98% |
| 15 | Paraguay | 99.98% |
| 16 | Seychelles | 99.98% |
| 17 | Tonga | 99.98% |
| 18 | Ukraine | 99.98% |
| 19 | Uruguay | 99.98% |
| 20 | Cabo Verde | 99.96% |
Near-complete binding coverage should not be equated with low tariffs. Binding coverage tells us how many tariff lines are covered by a commitment, not how high the bound rate is. An economy can bind nearly all tariff lines while maintaining relatively high bound ceilings, and its applied tariffs can still be lower than those ceilings. Coverage and tariff-rate level answer different questions.
Zero values require careful interpretation
The 2022 file reports 99 economies at exactly 0%. These values are numeric observations in the verified CSV, not missing cells, so they are preserved rather than converted to NA. At the same time, a zero should not automatically be translated into a broad claim that an economy has no trade commitments. Tariff bindings are tied to WTO schedules and can interact with customs-union or regional scheduling arrangements and with the way country-level data are represented.
For a country-specific legal or policy interpretation, the underlying WTO or WITS schedule should be checked. This article therefore treats zero as the published indicator value while avoiding a stronger claim that the single number can establish the entire legal structure of that economy’s tariff commitments. That distinction is especially important because zeros make up most of the 2022 observations.
Several economies sit between zero and near-complete coverage
The 2022 middle range includes Israel at 75.81%, Singapore at 71.95%, Philippines at 62.15%, Mauritania at 40.60%, Cote d’Ivoire at 34.18%, Cuba at 32.59%, Suriname at 27.45%, Myanmar at 18.94%, and Bangladesh at 17.32%. These observations show partial coverage rather than either zero or almost complete binding.
| Economy | 2022 binding coverage |
|---|---|
| Israel | 75.81% |
| Singapore | 71.95% |
| Philippines | 62.15% |
| Mauritania | 40.60% |
| Cote d’Ivoire | 34.18% |
| Cuba | 32.59% |
| Suriname | 27.45% |
| Myanmar | 18.94% |
| Bangladesh | 17.32% |
A partial value can reflect differences across product categories. The all-products indicator does not show which tariff lines are bound or unbound. Manufactured-product and primary-product binding coverage can provide more detail, while tariff-rate indicators are needed to understand the level of the commitments and actual applied protection.
Complete list of the 161 latest observations
The table below lists every latest non-empty observation in the verified file, ordered alphabetically. Rows not dated 2022 retain their original year. Reported zeros remain zeros, and no missing value is imputed or projected forward.
| Economy | Observation year | Binding coverage, all products |
|---|---|---|
| Afghanistan | 2018 | 96.64% |
| Albania | 2022 | 0.00% |
| Angola | 2022 | 99.98% |
| Antigua and Barbuda | 2021 | 97.50% |
| Argentina | 2022 | 99.98% |
| Armenia | 2021 | 99.98% |
| Australia | 2022 | 0.00% |
| Austria | 2022 | 0.00% |
| Bahrain | 2022 | 0.00% |
| Bangladesh | 2022 | 17.32% |
| Barbados | 2022 | 95.84% |
| Belgium | 2022 | 0.00% |
| Belize | 2022 | 0.00% |
| Benin | 2022 | 0.00% |
| Bolivia | 2022 | 99.98% |
| Botswana | 2022 | 0.00% |
| Brazil | 2022 | 99.98% |
| Brunei Darussalam | 2022 | 95.45% |
| Bulgaria | 2022 | 0.00% |
| Burkina Faso | 2022 | 0.00% |
| Burundi | 2022 | 0.00% |
| Cabo Verde | 2022 | 99.96% |
| Cambodia | 2022 | 0.00% |
| Cameroon | 2022 | 0.00% |
| Canada | 2022 | 0.00% |
| Central African Republic | 2022 | 0.00% |
| Chad | 2022 | 0.00% |
| Chile | 2022 | 99.98% |
| China | 2022 | 0.00% |
| Colombia | 2022 | 99.98% |
| Congo, Dem. Rep. | 2020 | 100.00% |
| Congo, Rep. | 2022 | 0.00% |
| Costa Rica | 2022 | 0.00% |
| Cote d’Ivoire | 2022 | 34.18% |
| Croatia | 2022 | 0.00% |
| Cuba | 2022 | 32.59% |
| Cyprus | 2022 | 0.00% |
| Czechia | 2022 | 0.00% |
| Denmark | 2022 | 0.00% |
| Djibouti | 2014 | 99.98% |
| Dominica | 2020 | 92.72% |
| Dominican Republic | 2022 | 0.00% |
| Ecuador | 2022 | 94.56% |
| Egypt, Arab Rep. | 2019 | 99.34% |
| El Salvador | 2022 | 0.00% |
| Estonia | 2022 | 0.00% |
| Eswatini | 2022 | 0.00% |
| Fiji | 2021 | 51.52% |
| Finland | 2022 | 0.00% |
| France | 2022 | 0.00% |
| Gabon | 2022 | 0.00% |
| Gambia, The | 2022 | 0.00% |
| Georgia | 2022 | 99.98% |
| Germany | 2022 | 0.00% |
| Ghana | 2022 | 0.00% |
| Greece | 2022 | 0.00% |
| Grenada | 2022 | 99.98% |
| Guatemala | 2022 | 0.00% |
| Guinea | 2022 | 0.00% |
| Guinea-Bissau | 2022 | 0.00% |
| Guyana | 2022 | 99.98% |
| Haiti | 2020 | 88.24% |
| Honduras | 2022 | 0.00% |
| Hong Kong SAR, China | 2022 | 0.00% |
| Hungary | 2022 | 0.00% |
| Iceland | 2022 | 0.00% |
| India | 2022 | 0.00% |
| Indonesia | 2022 | 0.00% |
| Ireland | 2022 | 0.00% |
| Israel | 2022 | 75.81% |
| Italy | 2022 | 0.00% |
| Jamaica | 2022 | 0.00% |
| Japan | 2022 | 0.00% |
| Jordan | 2022 | 99.96% |
| Kazakhstan | 2022 | 0.00% |
| Kenya | 2022 | 0.00% |
| Korea, Rep. | 2022 | 0.00% |
| Kuwait | 2022 | 99.88% |
| Kyrgyz Republic | 2021 | 99.92% |
| Lao PDR | 2022 | 99.98% |
| Latvia | 2022 | 0.00% |
| Lesotho | 2022 | 0.00% |
| Liberia | 2022 | 0.00% |
| Liechtenstein | 2021 | 0.00% |
| Lithuania | 2022 | 0.00% |
| Macao SAR, China | 2022 | 0.00% |
| Madagascar | 2022 | 0.00% |
| Malawi | 2021 | 33.93% |
| Malaysia | 2022 | 0.00% |
| Maldives | 2022 | 0.00% |
| Mali | 2022 | 0.00% |
| Malta | 2022 | 0.00% |
| Mauritania | 2022 | 40.60% |
| Mauritius | 2022 | 0.00% |
| Mexico | 2022 | 99.98% |
| Moldova | 2022 | 99.98% |
| Mongolia | 2022 | 0.00% |
| Montenegro | 2022 | 0.00% |
| Morocco | 2021 | 99.98% |
| Mozambique | 2021 | 14.92% |
| Myanmar | 2022 | 18.94% |
| Namibia | 2022 | 0.00% |
| Nepal | 2022 | 0.00% |
| Netherlands | 2022 | 0.00% |
| New Zealand | 2022 | 0.00% |
| Nicaragua | 2022 | 0.00% |
| Niger | 2022 | 0.00% |
| Nigeria | 2022 | 0.00% |
| North Macedonia | 2022 | 0.00% |
| Norway | 2022 | 0.00% |
| Oman | 2022 | 0.00% |
| Pakistan | 2022 | 0.00% |
| Panama | 2022 | 0.00% |
| Papua New Guinea | 2021 | 99.98% |
| Paraguay | 2022 | 99.98% |
| Peru | 2022 | 99.98% |
| Philippines | 2022 | 62.15% |
| Poland | 2022 | 0.00% |
| Portugal | 2022 | 0.00% |
| Qatar | 2022 | 0.00% |
| Romania | 2022 | 0.00% |
| Russian Federation | 2021 | 99.98% |
| Rwanda | 2022 | 0.00% |
| Samoa | 2020 | 99.96% |
| Saudi Arabia | 2022 | 0.00% |
| Senegal | 2022 | 0.00% |
| Seychelles | 2022 | 99.98% |
| Sierra Leone | 2022 | 0.00% |
| Singapore | 2022 | 71.95% |
| Slovak Republic | 2022 | 0.00% |
| Slovenia | 2022 | 0.00% |
| Solomon Islands | 2022 | 0.00% |
| South Africa | 2022 | 0.00% |
| Spain | 2022 | 0.00% |
| Sri Lanka | 2021 | 40.56% |
| St. Kitts and Nevis | 2020 | 95.84% |
| St. Lucia | 2020 | 99.81% |
| St. Vincent and the Grenadines | 2022 | 99.70% |
| Suriname | 2022 | 27.45% |
| Sweden | 2022 | 0.00% |
| Switzerland | 2022 | 0.00% |
| Tajikistan | 2021 | 100.00% |
| Tanzania | 2022 | 0.00% |
| Thailand | 2022 | 0.00% |
| Togo | 2022 | 0.00% |
| Tonga | 2022 | 99.98% |
| Trinidad and Tobago | 2022 | 100.00% |
| Tunisia | 2016 | 58.25% |
| Turkiye | 2022 | 0.00% |
| Uganda | 2022 | 0.00% |
| Ukraine | 2022 | 99.98% |
| United Arab Emirates | 2021 | 99.98% |
| United Kingdom | 2022 | 0.00% |
| United States | 2022 | 0.00% |
| Uruguay | 2022 | 99.98% |
| Vanuatu | 2022 | 0.00% |
| Venezuela, RB | 2022 | 99.96% |
| Viet Nam | 2022 | 93.82% |
| Yemen, Rep. | 2017 | 100.00% |
| Zambia | 2022 | 0.00% |
| Zimbabwe | 2021 | 24.39% |
Binding coverage is different from a tariff rate
Binding coverage is the percentage of tariff lines with a bound-rate commitment. A bound rate is the committed ceiling for a tariff line. An applied tariff is the rate actually charged under the relevant regime, while an MFN rate is the standard rate applied to most-favored-nation partners. These concepts are related but they are not interchangeable.
As a result, binding coverage is useful for studying how broadly tariff commitments extend across the product schedule, but it is not sufficient for measuring the cost of importing goods or the overall openness of a trade regime. A complete tariff analysis should combine coverage with bound-rate levels, applied rates, and trade weights where appropriate.
How to interpret the data
First, distinguish the 161 latest observations from the 136 observations dated 2022. Second, preserve reported zeros but avoid over-interpreting their legal meaning without checking the underlying schedules. Third, remember that a high coverage percentage says nothing by itself about whether tariff rates are high or low.
Fourth, averages are not very representative when the distribution is concentrated at zero and near 100%. Medians, band counts, and individual observations are more informative. Fifth, country-specific conclusions about WTO obligations should be verified against current WTO/WITS tariff schedules rather than inferred from a single summary indicator.
Source and calculation
The source is World Bank World Development Indicators, TM.TAX.MRCH.BC.ZS: Binding coverage, all products (%). World Bank metadata describes the measure as the percentage of product lines with an agreed bound rate and identifies World Bank/WITS/WTO sources. All 2022 distribution statistics, band counts, and comparison tables in this article are calculated directly from the verified CSV in the package.
Frequently Asked Questions
Does 100% binding coverage mean tariffs are zero?
No. Binding coverage measures the share of tariff lines with a bound-rate commitment, not the level of the tariff itself.
How many 2022 observations are exactly zero?
99 of the 136 verified 2022 observations are reported as 0%. These are numeric values in the source file, not missing cells.
How many 2022 economies have binding coverage of at least 90%?
28 observations dated 2022 are at or above 90%.
Related Articles
Green Map creates custom-edited map images using open geographic data sources such as geoBoundaries, Natural Earth, OpenStreetMap, and government open data. These maps are edited visual materials, not raw data files, and are provided for education, documents, presentations, and graphic reference.