Renewable electricity generated at utility-scale facilities was distributed very unevenly across U.S. jurisdictions in 2025. The annual U.S. Energy Information Administration (EIA) series used here fixes the fuel category at all renewables (AOR) and the sector category at all sectors (sectorid 99). It contains one observation for each of the 50 states plus the District of Columbia, all reported in thousand megawatthours. Because all 51 observations refer to 2025, the state-level differences are directly comparable within this specific series.
Texas has the largest value at 189,021.472 thousand MWh. California follows at 87,014.808, and Iowa is third at 45,233.320 thousand MWh. At the other end, the District of Columbia records 101.065, Alaska 183.750, and Delaware 222.998 thousand MWh. These are absolute generation quantities, not renewable shares or policy scores. A large value means more net electricity was produced in this EIA category; it does not by itself show that renewables make up a larger percentage of the state’s total electricity supply.
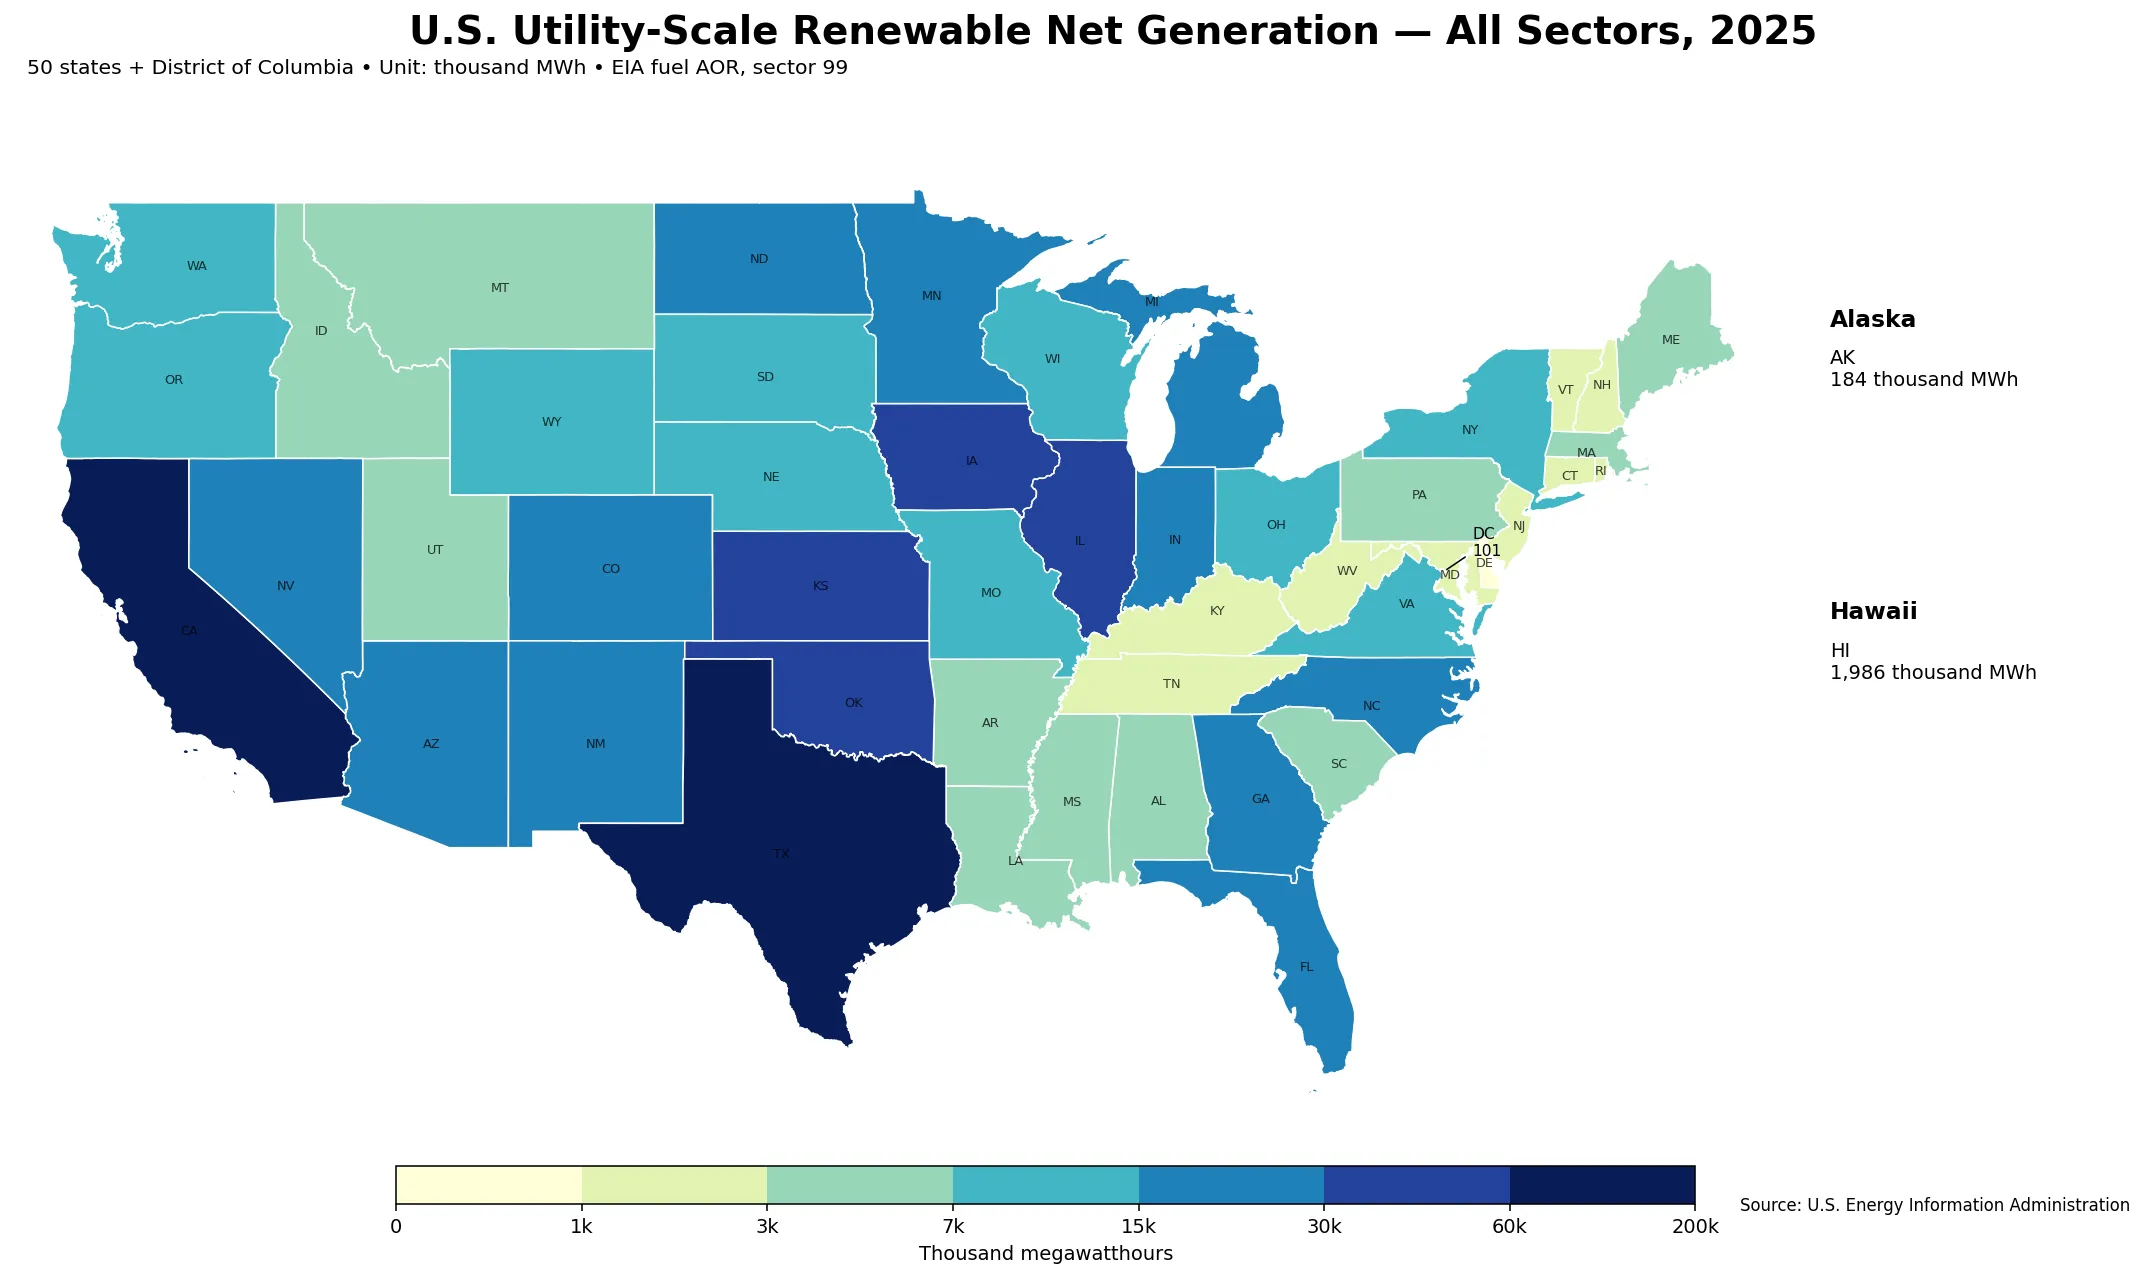
Table of Contents
All 51 observations use the same 2025 reference year
The dataset does not mix “latest available” years. Every row is dated 2025, which removes a common comparability problem in cross-jurisdiction datasets. Texas is compared with California, Iowa, Florida, Alaska, and the District of Columbia under the same year, frequency, unit, fuel grouping, and sector grouping. The District of Columbia is reported separately, so the correct coverage is 51 jurisdictions rather than 50 rows.
Adding the 51 observations gives 821,917.651 thousand MWh, or about 821.918 TWh. That combined figure is useful for describing concentration inside this state-level EIA slice. It should not be treated as a general denominator for the entire U.S. electricity system, because the series has a defined utility-scale renewable scope. The total also does not automatically include generation that belongs to differently defined small-scale categories.
The defining feature of this dataset is the all-sectors filter
The source is EIA’s electricity/electric-power-operational-data route. The metric is the generation field, the fuel facet is AOR for all renewables, and the sector facet is 99 for all sectors. That last dimension matters. EIA also publishes neighboring series for narrower sectors, including Electric Power Sector Non-CHP and other ownership or operating categories. Two articles can both mention “utility-scale renewable net generation” while still reporting different values because their sector filters are not the same.
For reproducible comparisons, the identity should therefore be read as a bundle rather than as a loose title: annual frequency, 2025, net generation, AOR fuel category, sectorid 99, state geography, and thousand-MWh units. Changing any of those elements can create a different series. This is particularly important here because the site already contains related renewable-generation articles with narrower sector definitions. The current dataset is specifically the broader all-sectors slice.
Texas alone represents about 23% of the 51-jurisdiction sum
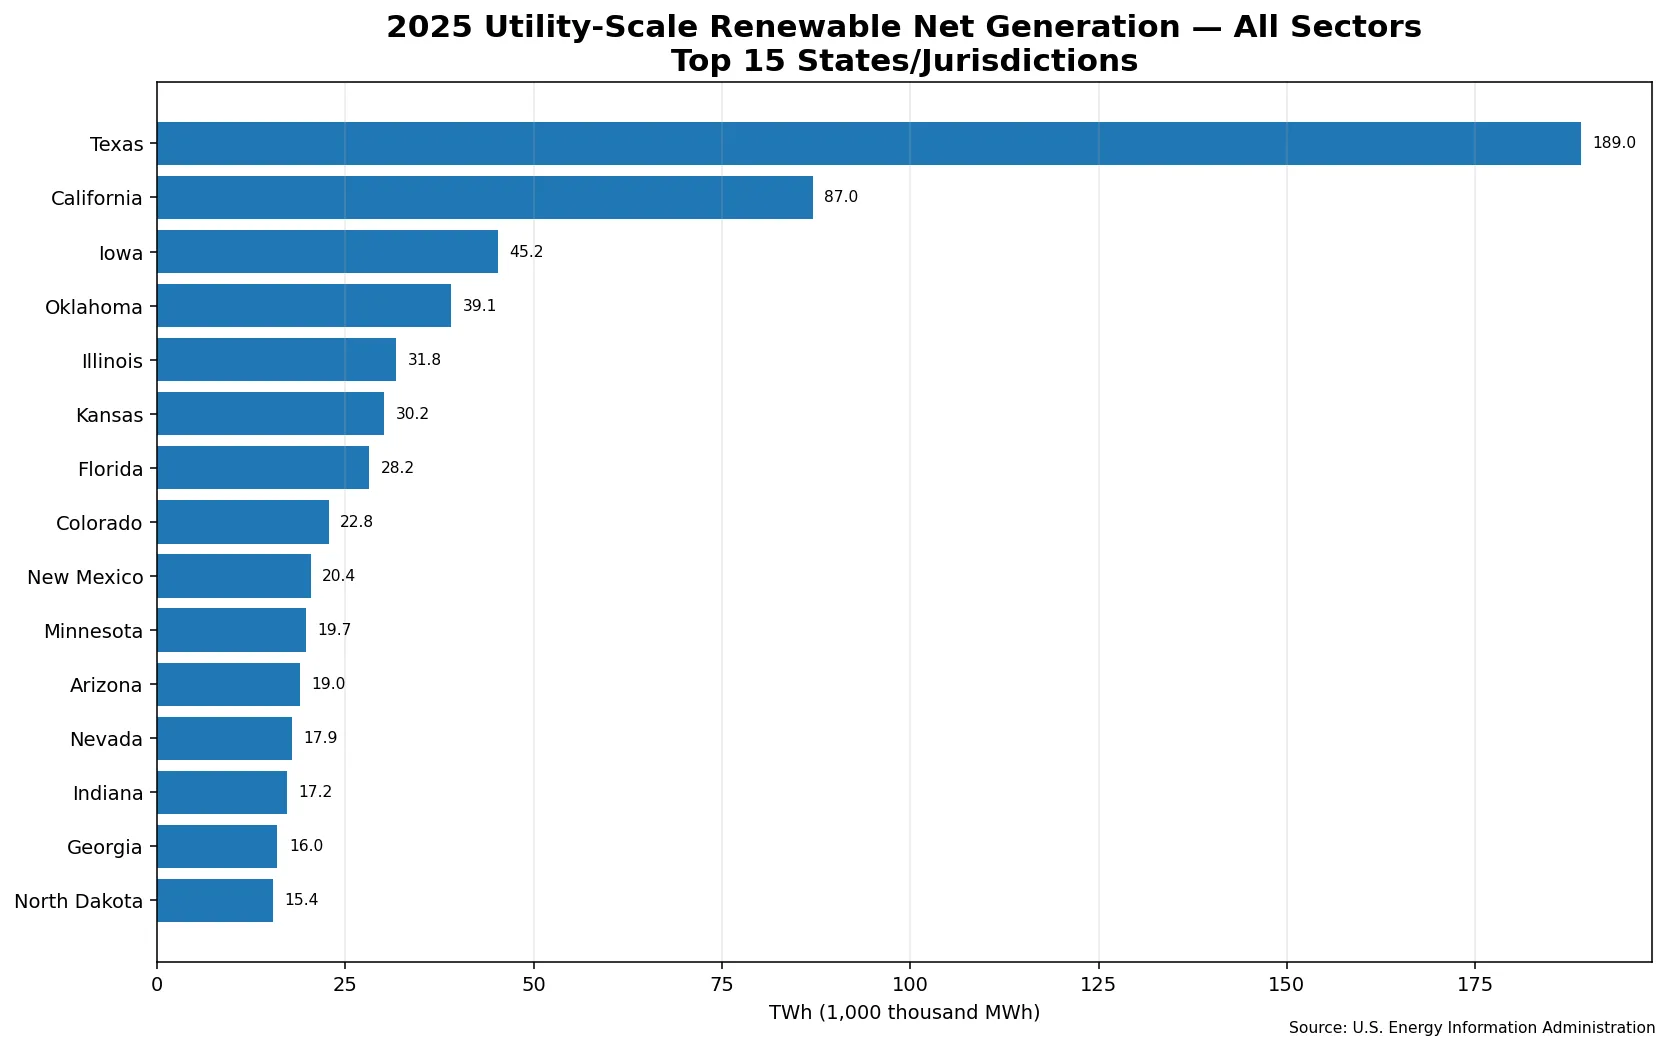
Texas contributes approximately 23.0% of the combined 821.918 TWh. California contributes about 10.6%, so the top two jurisdictions together account for roughly 33.6%. Adding Iowa raises the top-three share to about 39.1%. Texas, California, Iowa, Oklahoma, and Illinois together reach about 47.7%, while the ten largest jurisdictions account for about 62.5% of the sum. The distribution is therefore concentrated, even though meaningful renewable generation appears across many parts of the country.
The top ten are Texas, California, Iowa, Oklahoma, Illinois, Kansas, Florida, Colorado, New Mexico, and Minnesota. They span the South, West, Great Plains, Midwest, and Southwest rather than forming one compact block. The aggregate AOR category does not identify which technology explains each state’s total. Wind, solar, conventional hydropower, geothermal, biomass and other renewable sources can contribute differently across states, but those component values are not present in this 51-row table.
| State or jurisdiction | 2025 net generation (thousand MWh) |
|---|---|
| Texas | 189,021.472 |
| California | 87,014.808 |
| Iowa | 45,233.320 |
| Oklahoma | 39,070.392 |
| Illinois | 31,756.870 |
| Kansas | 30,169.200 |
| Florida | 28,185.100 |
| Colorado | 22,779.126 |
| New Mexico | 20,392.651 |
| Minnesota | 19,736.333 |
The median is about half the mean because the upper tail is long
The arithmetic mean is 16,116.032 thousand MWh, while the median is only 8,181.085 thousand MWh. The large gap tells us that a few very high observations pull the mean upward. The first quartile is 3,119.299 thousand MWh and the third quartile is 16,594.706 thousand MWh, so the middle half of the 51 jurisdictions lies roughly between 3.1 and 16.6 TWh. Texas and California sit far above that central range.
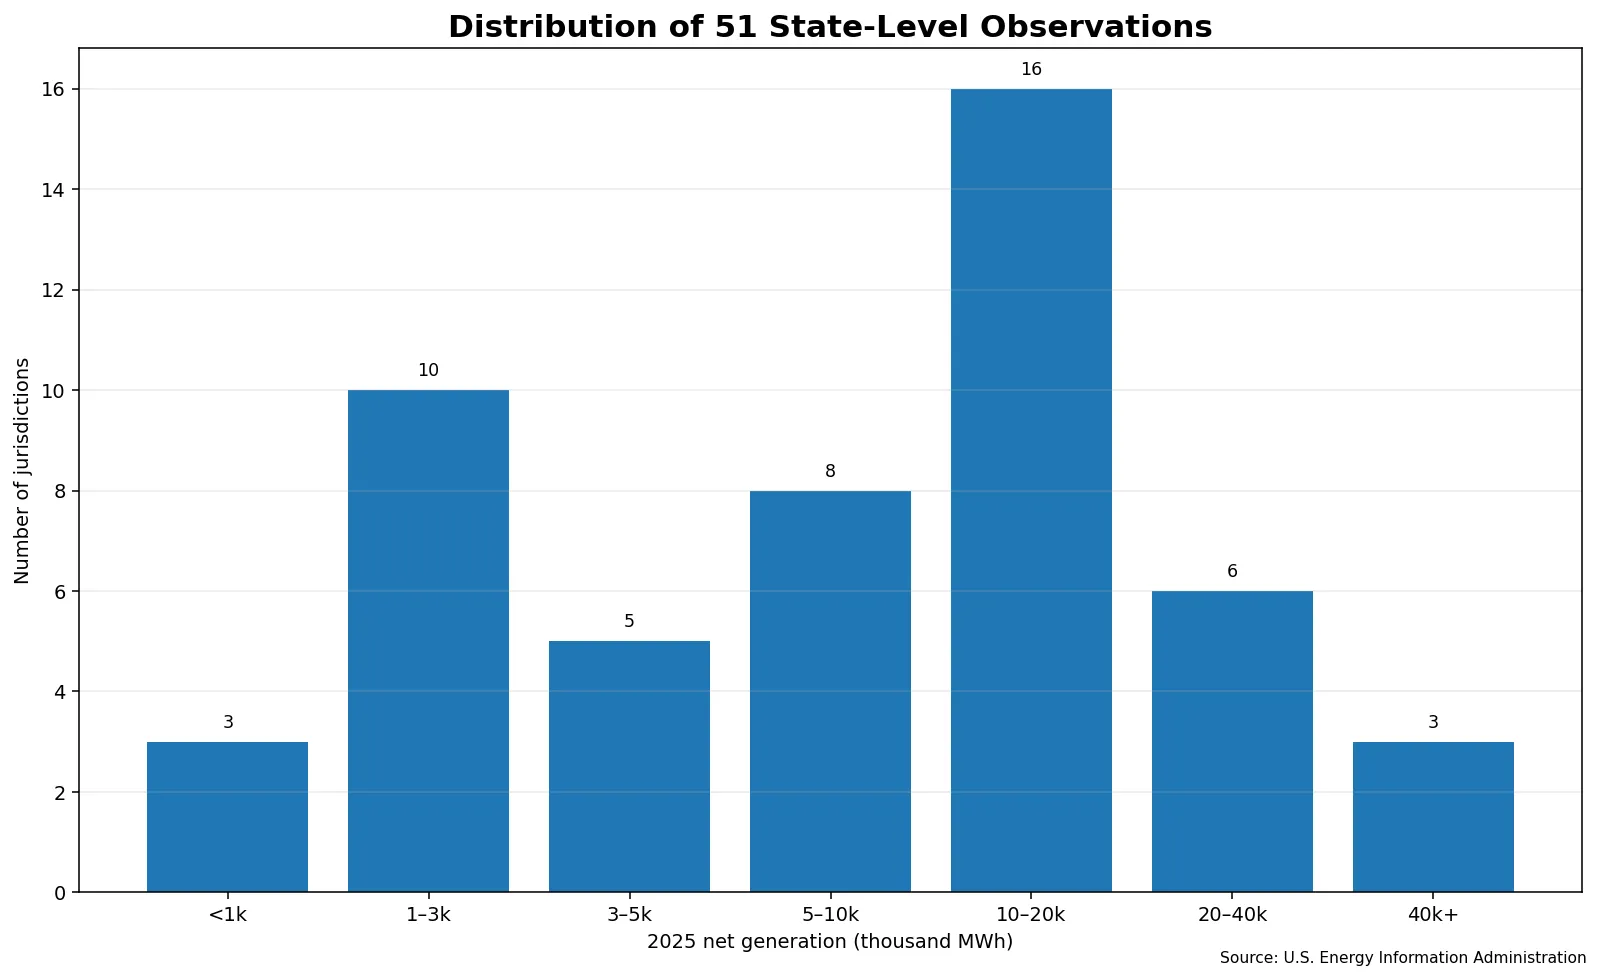
A grouped view reinforces the same point. Three jurisdictions are below 1,000 thousand MWh, ten are between 1,000 and 3,000, and five are between 3,000 and 5,000. Another eight fall between 5,000 and 10,000, while sixteen sit between 10,000 and 20,000. Six jurisdictions are in the 20,000–40,000 range, and only three exceed 40,000 thousand MWh. A typical jurisdiction is therefore much closer to the median than to the Texas value.
Small values are measured observations, not missing data
The bottom of the table contains positive values rather than blanks. The District of Columbia has 101.065 thousand MWh, Alaska 183.750, Delaware 222.998, Vermont 1,045.672, and Rhode Island 1,128.825. None of the 51 rows is missing and none is exactly zero. A very light map class should therefore be interpreted as low measured generation within this series, not as an absence of reporting.
| Low-value jurisdiction | 2025 net generation (thousand MWh) |
|---|---|
| District of Columbia | 101.065 |
| Alaska | 183.750 |
| Delaware | 222.998 |
| Vermont | 1,045.672 |
| Rhode Island | 1,128.825 |
Absolute size also matters when interpreting these low values. The District of Columbia has a very different land area and power-system footprint from Texas or California. Alaska has a geographically dispersed grid structure that cannot be summarized by land area alone. A low absolute number is not evidence that renewable electricity is unimportant in the local mix. To answer that question, the renewable numerator would need to be divided by a compatible total-generation denominator for the same jurisdiction and year.
Net generation is an energy quantity, not installed capacity
EIA net generation represents electricity produced after subtracting electricity used for station service. The unit in this dataset is thousand megawatthours, which measures electrical energy over time. It is different from megawatts of installed capacity. A state can have substantial capacity but a different annual generation result depending on operating hours, resource conditions, outages, curtailment, additions, retirements, and other factors.
That distinction prevents a common interpretation error. A state’s annual generation value cannot be converted into a capacity factor or efficiency score without additional compatible data. Nor does this aggregate all-renewables value reveal the contribution of each technology. The 51 observations support statements about the scale, rank, distribution, and geographic location of 2025 net generation under one fixed EIA definition; they do not independently explain why a state produced more or less.
Absolute generation and renewable share answer different questions
Texas accounting for 23.0% of the 51-jurisdiction sum does not mean that 23.0% of Texas electricity was renewable. The first percentage uses the sum of this specific all-sectors renewable series as its denominator. A renewable share inside Texas would require total Texas generation, aligned to the same year and a compatible scope, as the denominator. Per-capita generation, generation per square mile, or output per unit of capacity would require still different denominators.
These distinctions matter because search results often place “largest renewable generator” and “highest renewable share” beside one another. They describe different features of the electricity system. Absolute generation is useful for locating large production centers and understanding where national-scale renewable output is concentrated. A percentage-of-generation measure is better for describing the role of renewables within each state’s own electricity mix. Neither should be substituted for the other.
Source, scope, and limits of the comparison
The observations come from the U.S. Energy Information Administration Electricity API, using the annual electric-power-operational-data series. The fixed dimensions for this comparison are generation, year 2025, fueltypeid AOR, sectorid 99, state geography, and thousand megawatthours. Those dimensions are the reproducibility key for the numbers shown here.
EIA’s Electric Power Monthly renewable generation table also provides an all-sectors view of renewable generation, but national tables distinguish utility-scale generation from estimated small-scale solar. This article stays with the state-level utility-scale annual slice supplied by the API. It does not merge in small-scale estimates or substitute neighboring sector definitions.
The dataset is a single-year snapshot. It can describe 2025 levels, rankings, concentration, quartiles, and the shape of the state distribution. It cannot establish growth, decline, acceleration, or long-term trend because no earlier year is included in the analysis. A time-series study should retrieve multiple years using the same AOR and sectorid 99 dimensions. Keeping the identity fixed is essential; otherwise an apparent year-to-year change may partly reflect a change in definition rather than a change in generation.
Within that boundary, the main result is clear. Utility-scale renewable net generation across all sectors is highly concentrated at the top of the 2025 state distribution. Texas is by far the largest observation, California is second, and the top five jurisdictions account for nearly half of the combined state-level total. At the same time, the median is only 8.181 TWh, showing that most jurisdictions operate on a much smaller absolute scale than the leaders.
Frequently Asked Questions
Are all 51 observations from 2025?
Yes. All 50 states and the District of Columbia are reported for 2025 under the same AOR fuel category, sectorid 99, annual frequency and thousand-MWh unit.
Does Texas’s 23.0% mean 23.0% of Texas electricity is renewable?
No. It is Texas's share of the 51-jurisdiction sum for this specific EIA all-renewables, all-sectors series.
Is all sectors the same as Electric Power Sector Non-CHP?
No. They use different sector filters, so similarly named renewable-generation series can produce different state values. This article uses sectorid 99, all sectors.
Related Articles
Green Map creates custom-edited map images using open geographic data sources such as geoBoundaries, Natural Earth, OpenStreetMap, and government open data. These maps are edited visual materials, not raw data files, and are provided for education, documents, presentations, and graphic reference.