World Bank indicator GB.XPD.RSDV.GD.ZS provides a latest non-empty research and development expenditure share of GDP for 156 countries and economies. Observation years range from 1999 to 2024: 56 latest observations are from 2023 and 30 from 2024. The unweighted mean is 0.855% and the median 0.401%.
The measure is gross domestic expenditure on research and development, usually called GERD, divided by GDP. It is broader than a government science budget: it includes current and capital R&D spending performed by business enterprises, government, higher education, and private nonprofit organizations inside the national territory.
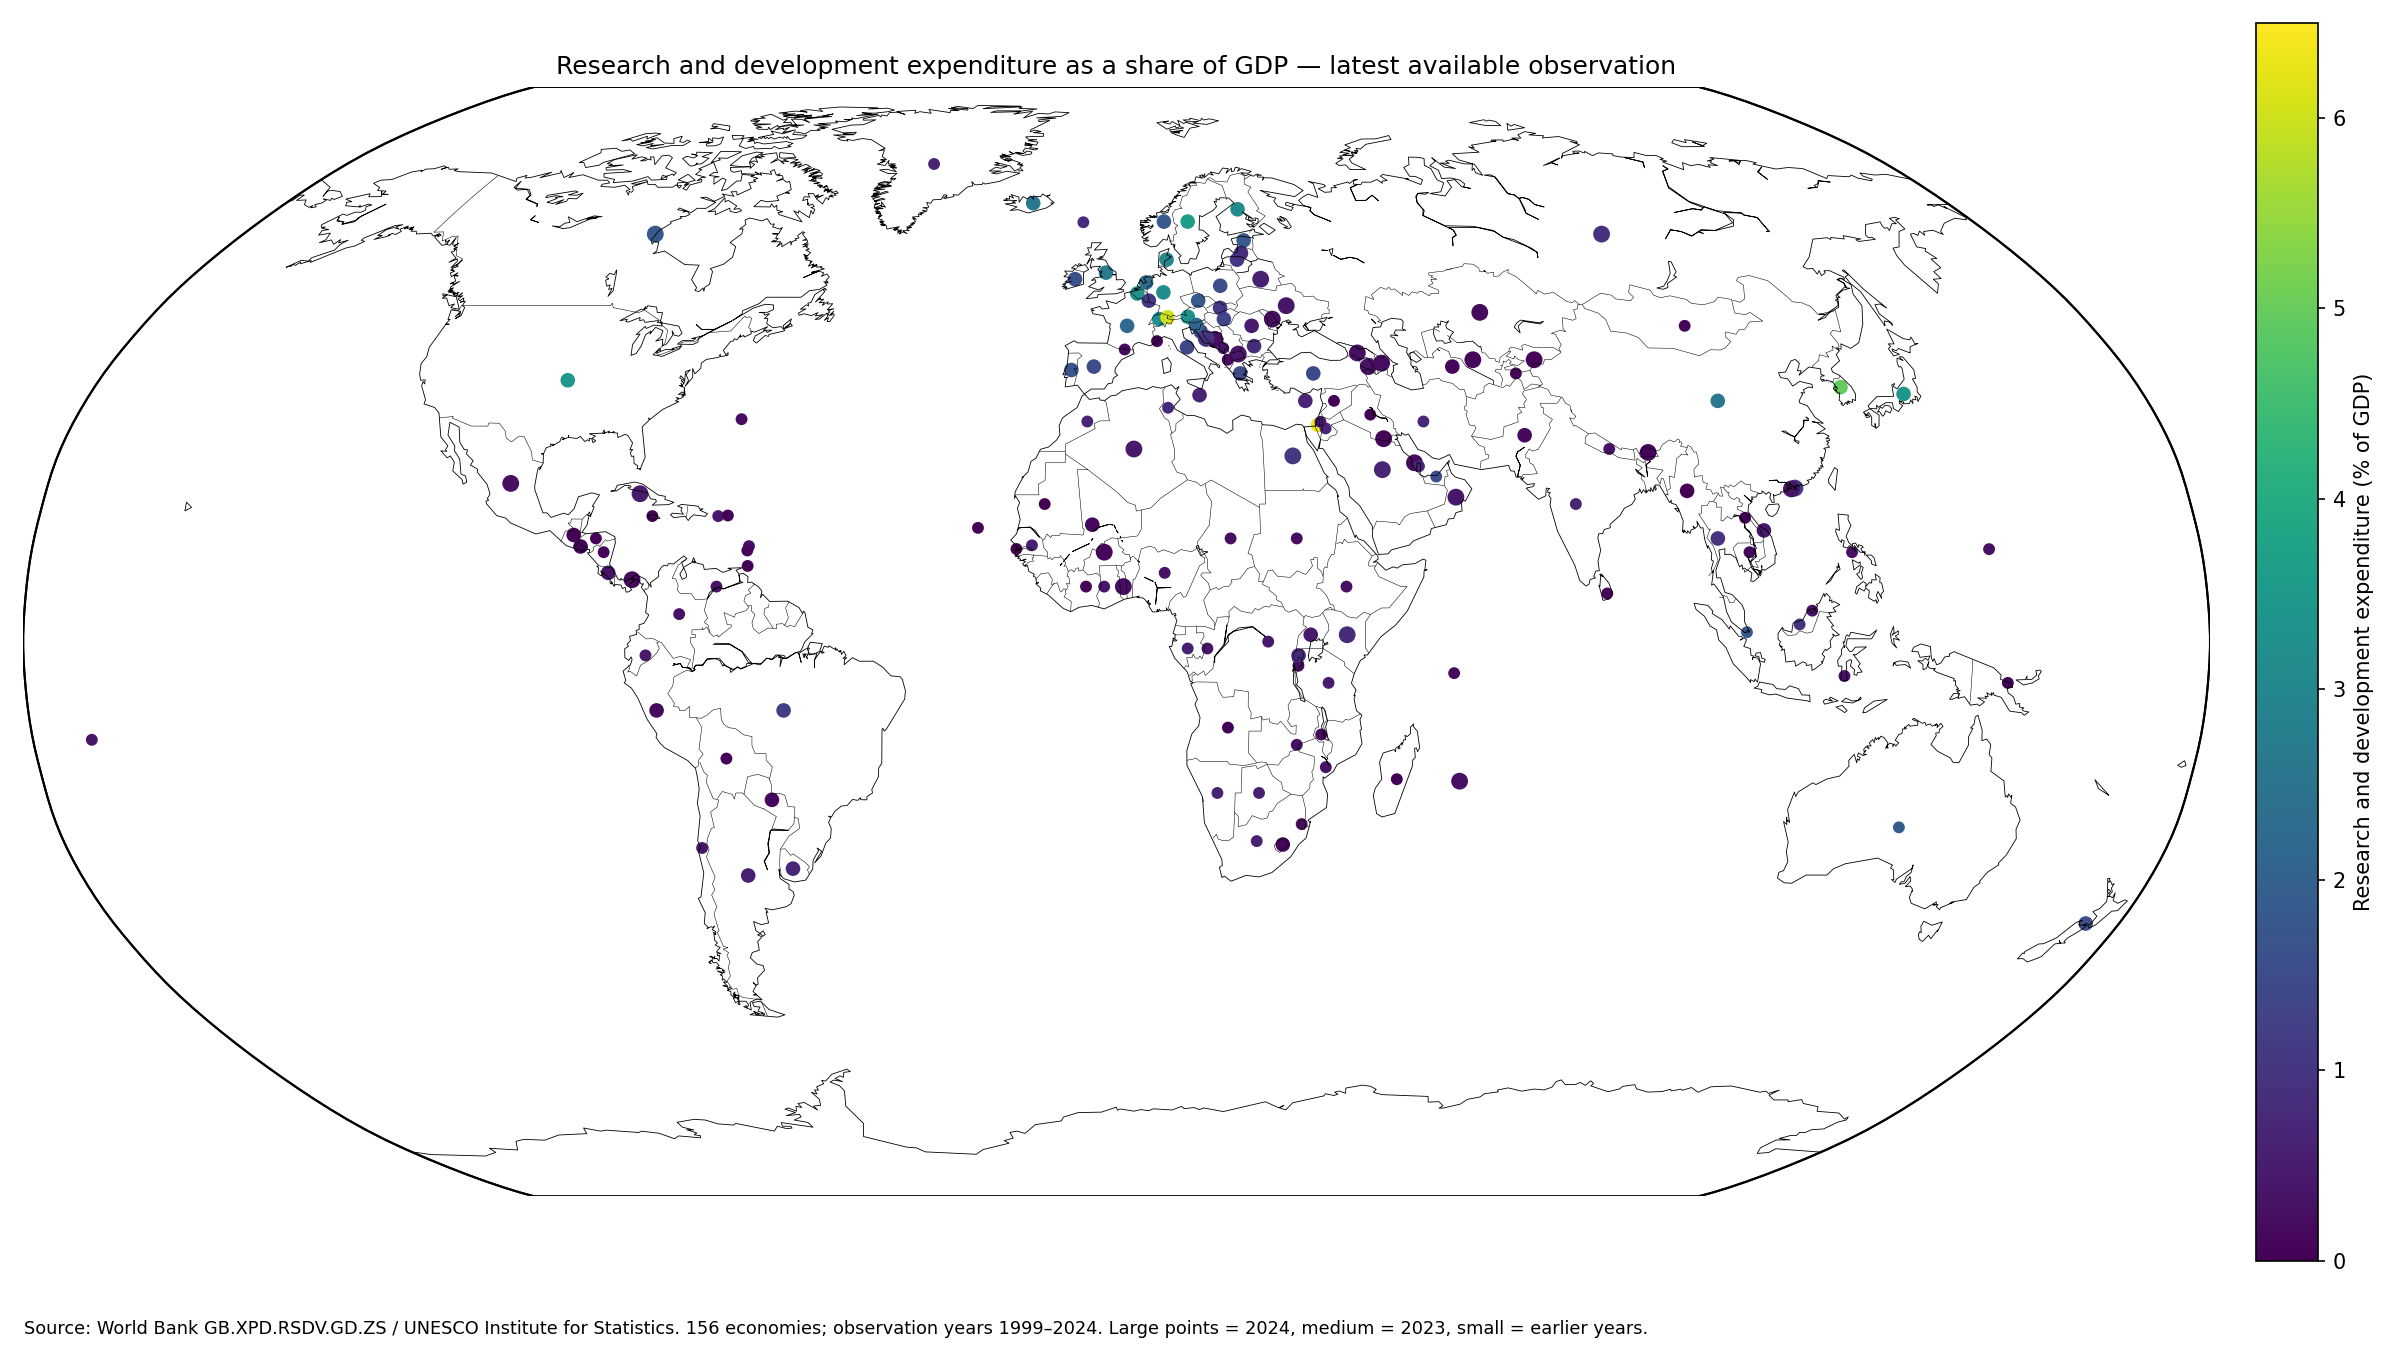
Table of Contents
The indicator measures R&D performed inside the economy
The World Bank metadata glossary defines the indicator as total domestic intramural R&D expenditure divided by GDP and multiplied by 100. The territorial location of the R&D activity matters more than the nationality of the funder.
R&D financed by a domestic company but performed abroad is excluded from domestic GERD. Conversely, R&D performed by a resident institution inside the economy can be part of GERD even when some funding comes from abroad. The measure is about where research is performed.
Business, government, higher education and nonprofit R&D are included
GERD brings together current and capital expenditure on R&D across the main institutional sectors. It can include researcher compensation, operating costs, equipment, facilities, and other resources directly used to perform research and experimental development.
This is why the ratio should not be described as government R&D spending. In economies with large corporate research programs, the business-enterprise sector can account for a substantial share of the national total.
Basic research, applied research and experimental development all count
The statistical concept covers basic research aimed at new knowledge, applied research directed toward a practical objective, and experimental development that uses existing knowledge to create or substantially improve products, processes, systems, or services.
Routine production, ordinary market research, or normal maintenance work do not automatically qualify as R&D. International comparison depends on national surveys applying the conceptual boundary consistently.
The median latest observation is 0.401% of GDP
The median across 156 latest observations is 0.401%. The middle half lies between 0.189% and 1.038%. The simple mean of 0.855% is more than twice the median because a small group of high-intensity economies stretches the upper tail.
For describing a typical country, the median and quartiles are therefore more useful than the mean alone.
More than half of the latest observations are below 0.5%
26 observations are below 0.1% and 60 are from 0.1% to under 0.5%. Together they account for 86 of the 156 economies. Another 28 are from 0.5% to under 1%, 24 from 1% to under 2%, 6 from 2% to under 3%, and 12 are at least 3%.
| R&D expenditure / GDP | Economies | Share of 156 |
|---|---|---|
| Below 0.1% | 26 | 16.7% |
| 0.1% to under 0.5% | 60 | 38.5% |
| 0.5% to under 1% | 28 | 17.9% |
| 1% to under 2% | 24 | 15.4% |
| 2% to under 3% | 6 | 3.8% |
| 3% or more | 12 | 7.7% |
The highest latest observations exceed 3% of GDP
Israel has the highest latest observation at 6.346%, followed by Liechtenstein at 6.010%. Other high observations include Sweden 3.600%, the United States 3.447%, Japan 3.441%, Belgium 3.272%, Austria 3.255%, Switzerland 3.222%, and Germany 3.154%.
These figures measure R&D input intensity, not patents, innovation quality, or productivity. A high spending ratio says that R&D expenditure is large relative to GDP, not that every R&D project produces a successful commercial outcome.
| True rank | Country or economy | Observation year | R&D expenditure / GDP |
|---|---|---|---|
| 1 | Israel | 2023 | 6.346% |
| 2 | Liechtenstein | 2023 | 6.010% |
| 4 | Sweden | 2023 | 3.600% |
| 5 | United States | 2023 | 3.447% |
| 6 | Japan | 2023 | 3.441% |
| 7 | Belgium | 2023 | 3.272% |
| 8 | Austria | 2023 | 3.255% |
| 9 | Switzerland | 2023 | 3.222% |
| 10 | Germany | 2023 | 3.154% |
| 11 | Finland | 2023 | 3.094% |
| 12 | Denmark | 2023 | 3.048% |
| 13 | United Kingdom | 2023 | 2.676% |
| 14 | Iceland | 2023 | 2.640% |
| 15 | China | 2023 | 2.577% |
| 16 | Netherlands | 2023 | 2.267% |
Northern and Western Europe form a visible high-intensity cluster
In 2023, Sweden records 3.600%, Finland 3.094%, Denmark 3.048%, Iceland 2.640%, and Norway 1.851%. Western Europe also contains Belgium 3.272%, Austria 3.255%, Switzerland 3.222%, Germany 3.154%, the United Kingdom 2.676%, the Netherlands 2.267%, and France 2.178%.
The map makes this regional clustering visible, but proximity does not prove one common cause. Industrial structure, corporate R&D, public laboratories, universities, GDP size, and survey coverage all differ across countries.
East Asia also shows large differences
Japan records 3.441% in 2023 and China 2.577%, while Hong Kong SAR, China is at 1.126% in 2024 and Macao SAR, China at 0.311% in 2024.
Countries in the same broad region can have very different research systems and economic structures. Manufacturing intensity, multinational research centers, university systems, and the size of service sectors can all affect the ratio.
The lowest latest observations can be below 0.1%
Guatemala is at 0.006%, Mauritania 0.010%, Madagascar 0.013%, Myanmar 0.023%, the U.S. Virgin Islands 0.027%, Papua New Guinea 0.032%, Angola 0.032%, and Lao PDR 0.037%.
A low recorded ratio should not automatically be read as proof that research activity is absent. Survey coverage, reporting systems, the age of the observation, and the size of GDP can all affect the measured share.
| Low-end rank | Country or economy | Observation year | R&D expenditure / GDP |
|---|---|---|---|
| 1 | Guatemala | 2023 | 0.006% |
| 2 | Mauritania | 2018 | 0.010% |
| 3 | Madagascar | 2017 | 0.013% |
| 4 | Myanmar | 2023 | 0.023% |
| 5 | Virgin Islands (U.S.) | 2007 | 0.027% |
| 6 | Papua New Guinea | 2016 | 0.032% |
| 7 | Angola | 2016 | 0.032% |
| 8 | Lao PDR | 2002 | 0.037% |
| 9 | Monaco | 2005 | 0.038% |
| 10 | Iraq | 2021 | 0.041% |
| 11 | Syrian Arab Republic | 2022 | 0.042% |
| 12 | Trinidad and Tobago | 2022 | 0.050% |
| 13 | Kyrgyz Republic | 2024 | 0.053% |
| 14 | Honduras | 2019 | 0.060% |
| 15 | Jamaica | 2002 | 0.061% |
Only 30 latest observations are dated 2024
The 2024 subset contains 30 economies. Its unweighted mean is 0.437%, median 0.275%, first quartile 0.200%, and third quartile 0.551%.
Within that subset, Canada records 1.791%, Hong Kong SAR, China 1.126%, Egypt 1.018%, Serbia 0.940%, the Russian Federation 0.937%, and Kenya 0.811%.
| 2024 rank | Country or economy | R&D expenditure / GDP |
|---|---|---|
| 1 | Canada | 1.791% |
| 2 | Hong Kong SAR, China | 1.126% |
| 3 | Egypt, Arab Rep. | 1.018% |
| 4 | Serbia | 0.940% |
| 5 | Russian Federation | 0.937% |
| 6 | Kenya | 0.811% |
| 7 | Saudi Arabia | 0.635% |
| 8 | Belarus | 0.587% |
| 9 | Algeria | 0.444% |
| 10 | Cuba | 0.438% |
| 11 | Oman | 0.390% |
| 12 | North Macedonia | 0.374% |
| 13 | Ukraine | 0.370% |
| 14 | Macao SAR, China | 0.311% |
| 15 | Armenia | 0.286% |
A lower 2024 mean does not prove a global decline
The 30-country 2024 mean of 0.437% is much lower than the 0.855% mean across all latest observations. That difference cannot be interpreted as a year-to-year fall in world R&D intensity because the country composition is different.
Many high-R&D economies have 2023 as their latest observation and are absent from the 2024 subset. A valid global trend comparison would require matching the same countries across years or using an official aggregate time series.
Most of the 2024 subset lies between 0.1% and 0.5%
In 2024, 3 observations are below 0.1%, 19 are from 0.1% to under 0.5%, 5 are from 0.5% to under 1%, and 3 are from 1% to under 2%. None of the 30 reaches 2%.
That distribution reflects the economies whose 2024 values are available in this latest-value extract. It should not be treated as the full 2024 world distribution.
R&D intensity and absolute R&D spending answer different questions
One percent of GDP represents a very different amount of money in a large economy than in a small economy. A country spending 1% of a very large GDP can devote more resources to R&D than a small country spending 3%.
Absolute comparisons require R&D expenditure in currency or purchasing-power terms. The GDP ratio is useful for measuring how large the R&D effort is relative to the size of the economy.
The ratio is not an innovation-output score
R&D spending is an important input into knowledge creation, but higher spending does not mechanically produce more patents, better products, faster productivity growth, or successful commercialization. The composition and effectiveness of the research system matter.
Innovation outcomes are better assessed with complementary indicators such as researchers, patents, publications, high-technology production, technology exports, and productivity. This map is deliberately limited to expenditure intensity.
GDP movements can change the ratio even when R&D spending does not
If nominal or real GDP falls while R&D expenditure is stable, the R&D-to-GDP ratio can rise. If GDP grows faster than R&D spending, the ratio can fall even when the amount spent on research is increasing.
Country time-series analysis should therefore examine both the numerator and denominator rather than assuming that every movement in the percentage came from an R&D budget change.
Survey frequency and coverage differ across countries
World Bank metadata notes that national characteristics such as survey periodicity, institutional-sector coverage, sampling, and estimation methods can affect R&D resource estimates. R&D activity is often concentrated in a limited number of large performers, making updated registers important.
Small differences between neighboring country percentages should therefore be interpreted cautiously. Broad gaps and within-country trends are usually more informative than a precise ranking of similar values.
Mixed observation years are the main limitation of the latest-value map
Of the 156 latest observations, 30 are from 2024 and 56 from 2023, giving 86 observations from those two years. 46 latest observations are older than 2020, and the oldest dates to 1999.
The World Bank most-recent-non-empty method improves geographic coverage but does not synchronize time. Point size on the map is therefore used to show recency instead of presenting every value as a 2024 observation.
| Observation year | Economies |
|---|---|
| 2024 | 30 |
| 2023 | 56 |
| 2022 | 12 |
| 2021 | 6 |
| 2020 | 6 |
| 2019 | 5 |
| 2018 | 4 |
| 2017 | 2 |
| 2016 | 6 |
| 2015 | 7 |
| 2014 | 2 |
| 2013 | 3 |
| 2011 | 1 |
| 2010 | 3 |
| 2009 | 1 |
| 2008 | 1 |
| 2007 | 1 |
| 2006 | 1 |
| 2005 | 3 |
| 2004 | 1 |
| 2003 | 1 |
| 2002 | 3 |
| 1999 | 1 |
The simple country mean is not a GDP-weighted world R&D share
The 0.855% mean gives each of the 156 economies equal weight. A very large economy and a small territory each contribute one country percentage.
A world R&D share of GDP requires GDP weighting or an official aggregate. The World Bank metadata identifies weighted average as the aggregation method, whereas the mean used here is only a descriptive cross-country statistic.
Source and calculation notes
The source is World Bank World Development Indicators series GB.XPD.RSDV.GD.ZS, based on UNESCO Institute for Statistics data. The analysis uses 156 latest non-empty observations to calculate the mean, median, quartiles, rankings, and distribution bands, and separately summarizes the 30 observations from 2024.
All 156 country codes are matched to geographic centroids for the map, producing a 100% match. Missing economies are not filled with zero, and point size distinguishes 2024, 2023, and older observations.
Frequently Asked Questions
Does R&D expenditure as a share of GDP include only government research spending?
No. GERD includes current and capital R&D expenditure performed by business enterprises, government, higher education, and private nonprofit organizations.
Is R&D financed by domestic firms but performed abroad included?
No. The indicator is based on intramural R&D performed inside the national territory, so R&D performed abroad is excluded from domestic GERD.
Are all 156 observations from 2024?
No. Latest observation years range from 1999 to 2024; 30 are from 2024, 56 from 2023, and the remainder are older.
Related Articles
Green Map creates custom-edited map images using open geographic data sources such as geoBoundaries, Natural Earth, OpenStreetMap, and government open data. These maps are edited visual materials, not raw data files, and are provided for education, documents, presentations, and graphic reference.