World Bank indicator NY.GDS.TOTL.ZS provides a latest non-empty gross domestic savings share of GDP for 188 countries and economies. Observation years range from 1983 to 2025, but 133 observations are from 2025. The unweighted mean across the latest values is 17.42%, the median 20.63%, the first quartile 9.57%, and the third quartile 29.73%.
Gross domestic savings are calculated as GDP minus final consumption expenditure. The ratio can therefore be negative when final consumption expenditure exceeds GDP. That is not merely a theoretical possibility: 30 of the 188 latest observations are below zero.
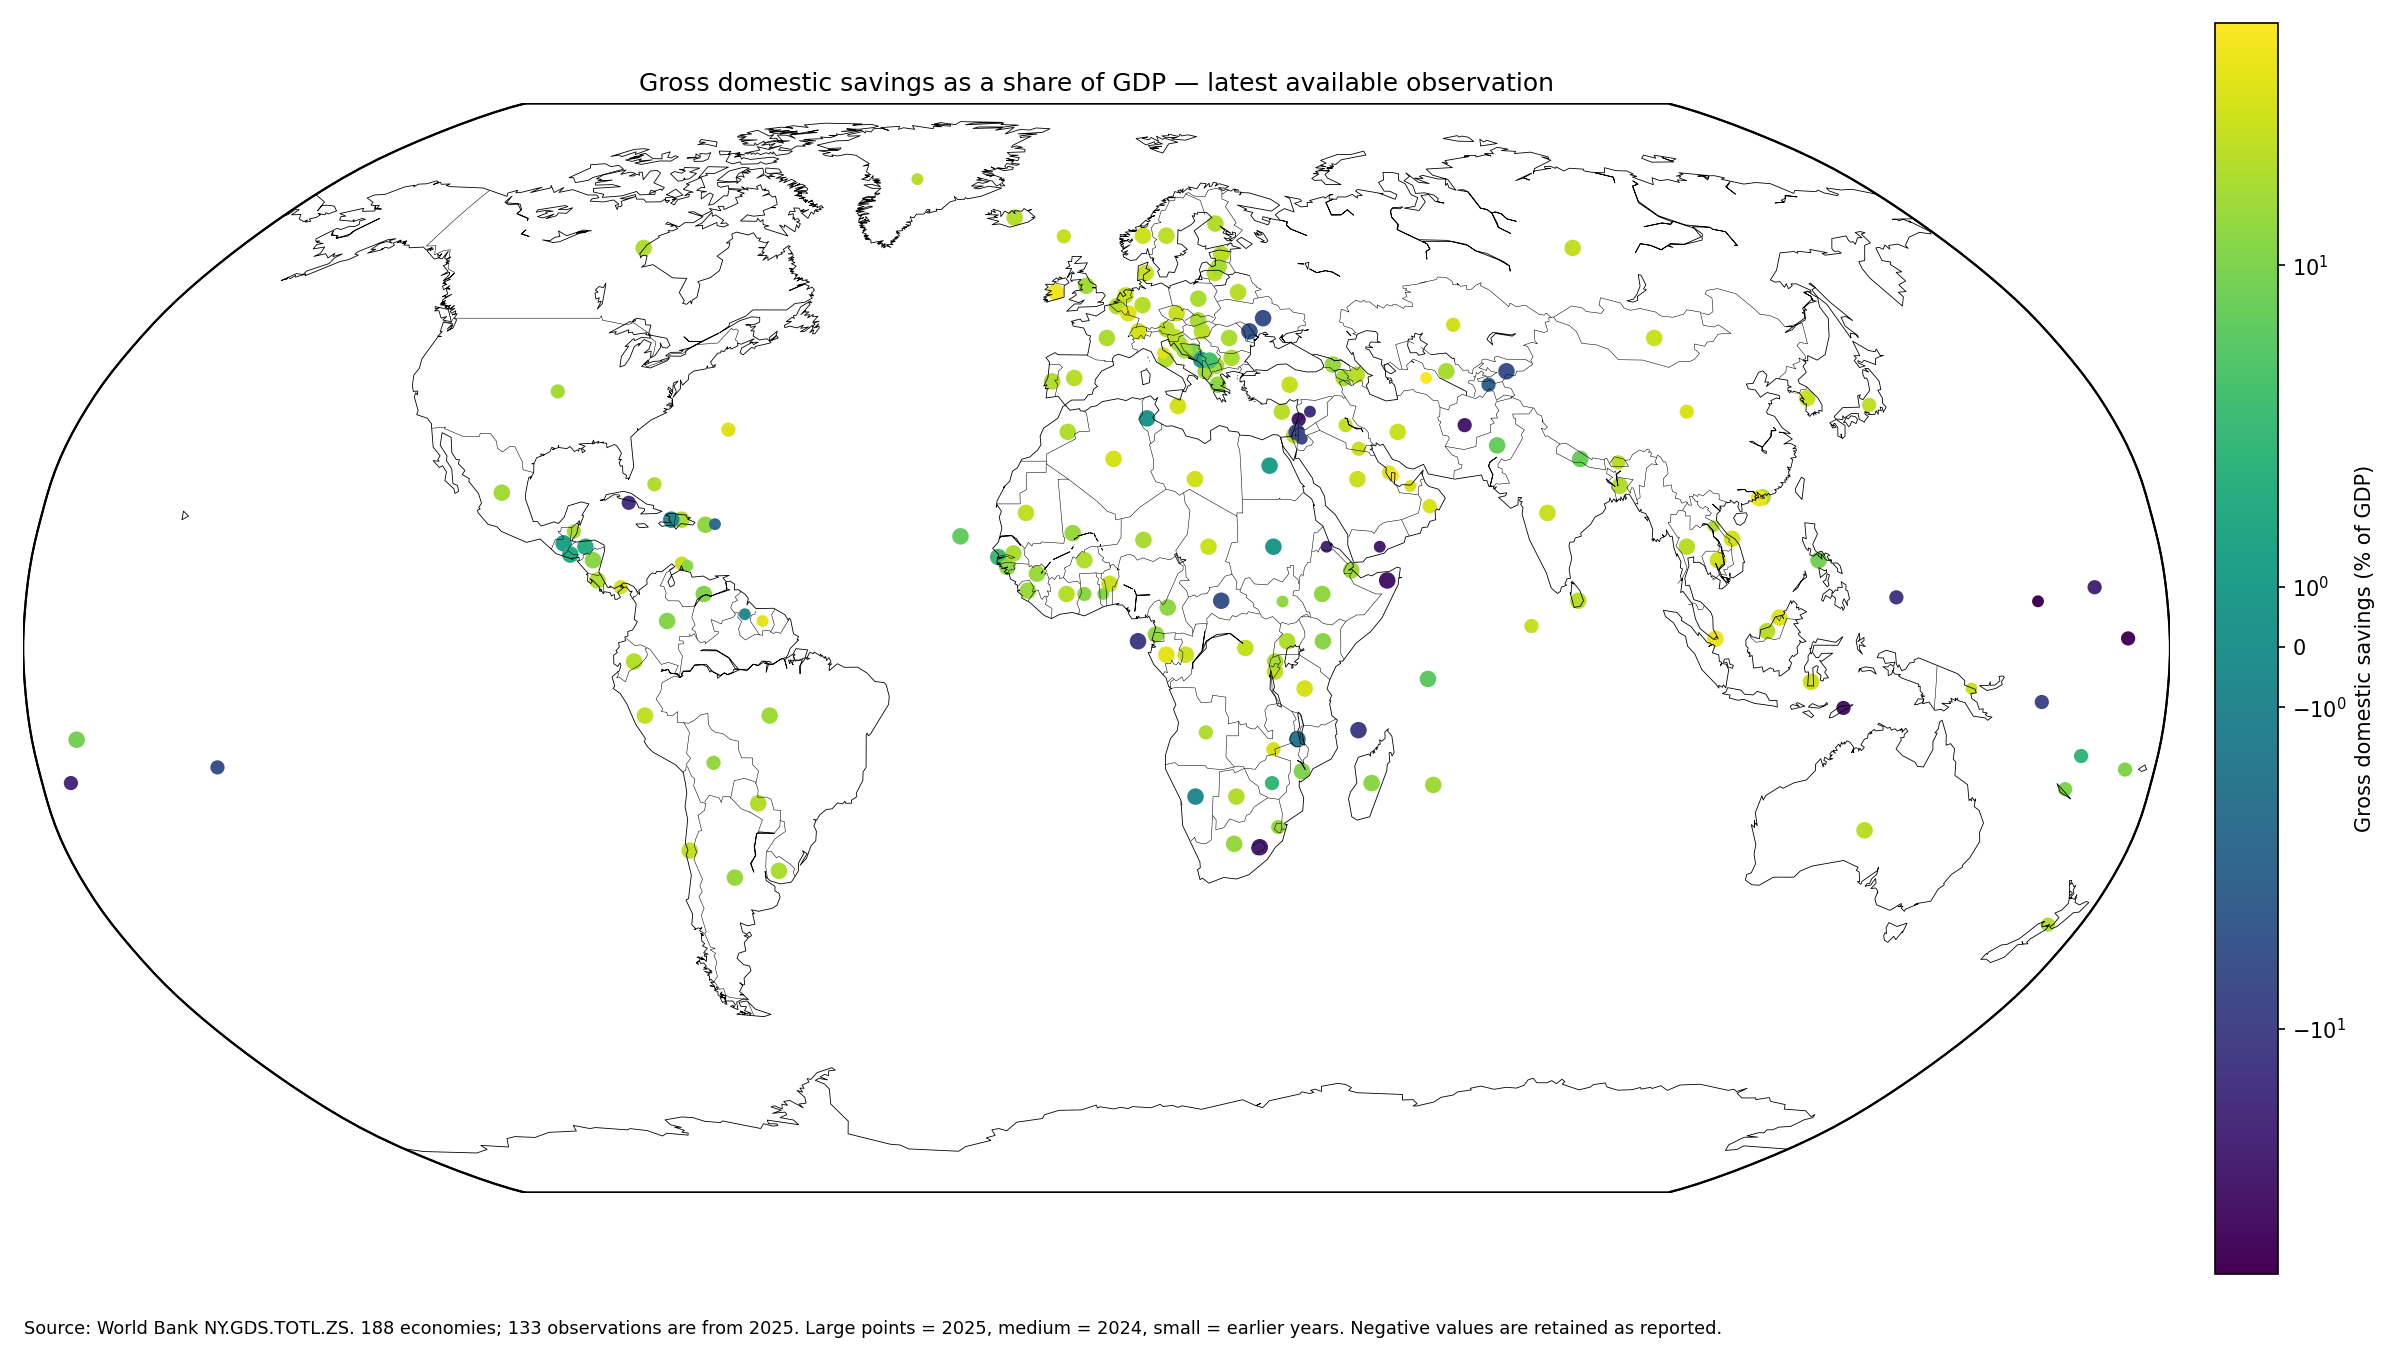
Table of Contents
Gross domestic savings are GDP minus final consumption
The World Bank metadata glossary defines gross domestic savings as GDP less final consumption expenditure. The indicator then expresses that amount as a percentage of GDP.
Final consumption includes more than household purchases. It also includes government final consumption, so the series is an economy-wide national-accounts measure. It should not be described as a household savings rate or as money deposited in banks.
This is not a household saving-rate indicator
A household saving rate is based on household disposable income and household consumption. Gross domestic savings instead uses GDP and economy-wide final consumption expenditure, so business and government sector outcomes are embedded in the national-accounts total.
A high gross domestic savings ratio therefore does not prove that every household saves a large share of income. Household behavior requires a household-sector savings series.
Negative gross domestic savings are possible
30 latest observations are negative. The lowest include the Federated States of Micronesia at -80.12%, Kiribati -62.83%, Timor-Leste -44.21%, Somalia -41.45%, Afghanistan -35.32%, Lebanon -34.15%, and Lesotho -33.19%.
A negative figure means final consumption expenditure exceeded GDP under the national-accounts calculation. It is not automatically the same as a government budget deficit, household dissaving, or a current-account deficit. Those concepts have different sector boundaries and accounting definitions.
| Low-end rank | Country or economy | Observation year | Gross domestic savings / GDP |
|---|---|---|---|
| 1 | Micronesia, Fed. Sts. | 1983 | -80.12% |
| 2 | Kiribati | 2024 | -62.83% |
| 3 | Timor-Leste | 2024 | -44.21% |
| 4 | Somalia, Fed. Rep. | 2025 | -41.45% |
| 5 | Afghanistan | 2024 | -35.32% |
| 6 | Lebanon | 2024 | -34.15% |
| 7 | Lesotho | 2025 | -33.19% |
| 8 | Yemen, Rep. | 2018 | -32.39% |
| 9 | Eritrea | 2011 | -24.79% |
| 10 | Marshall Islands | 2024 | -24.02% |
| 11 | Tonga | 2024 | -19.75% |
| 12 | Syrian Arab Republic | 2022 | -16.95% |
| 13 | Cuba | 2024 | -15.71% |
| 14 | Palau | 2024 | -12.94% |
| 15 | Sao Tome and Principe | 2025 | -11.30% |
The full latest-value ranking mixes old and new years
Across all 188 latest observations, Turkmenistan records 78.98%, Qatar 67.63%, Ireland 63.54%, Singapore 58.66%, and Macao SAR, China 57.68%.
Turkmenistan is a 2012 observation, Qatar is from 2022, and Suriname’s 50.75% value is from 2010. The full table is therefore a latest-available coverage view rather than a synchronized current-year ranking.
| Latest-observation rank | Country or economy | Observation year | Gross domestic savings / GDP |
|---|---|---|---|
| 1 | Turkmenistan | 2012 | 78.98% |
| 2 | Qatar | 2022 | 67.63% |
| 3 | Ireland | 2025 | 63.54% |
| 4 | Singapore | 2025 | 58.66% |
| 5 | Macao SAR, China | 2025 | 57.68% |
| 6 | Gabon | 2025 | 50.92% |
| 7 | Suriname | 2010 | 50.75% |
| 8 | San Marino | 2023 | 47.59% |
| 9 | Brunei Darussalam | 2025 | 46.88% |
| 10 | Luxembourg | 2025 | 46.66% |
| 11 | Bahrain | 2024 | 46.07% |
| 12 | Bermuda | 2024 | 44.98% |
| 13 | China | 2024 | 43.32% |
| 14 | United Arab Emirates | 2023 | 42.91% |
| 15 | Oman | 2024 | 42.14% |
The synchronized 2025 subset covers 133 economies
Among the 133 observations from 2025, Ireland records 63.54%, Singapore 58.66%, Macao SAR, China 57.68%, Gabon 50.92%, Brunei Darussalam 46.88%, and Luxembourg 46.66%.
| 2025 rank | Country or economy | Gross domestic savings / GDP |
|---|---|---|
| 1 | Ireland | 63.54% |
| 2 | Singapore | 58.66% |
| 3 | Macao SAR, China | 57.68% |
| 4 | Gabon | 50.92% |
| 5 | Brunei Darussalam | 46.88% |
| 6 | Luxembourg | 46.66% |
| 7 | Algeria | 39.96% |
| 8 | Tanzania | 39.68% |
| 9 | Switzerland | 38.43% |
| 10 | Malta | 37.91% |
| 11 | Viet Nam | 37.41% |
| 12 | Indonesia | 37.24% |
| 13 | Libya | 36.79% |
| 14 | Cambodia | 36.09% |
| 15 | Norway | 34.91% |
The 2025 subset has an unweighted mean of 19.73% and a median of 20.78%. The first quartile is 12.57% and the third quartile 27.59%. 12 of the 133 observations are negative.
The 2025 distribution is concentrated around 20–30%
In 2025, 12 observations are below zero, 16 are from zero to under 10%, 32 from 10% to under 20%, 44 from 20% to under 30%, 23 from 30% to under 40%, and 6 are at least 40%.
| 2025 gross domestic savings share | Economies | Share of 133 |
|---|---|---|
| Below 0% | 12 | 9.0% |
| 0% to under 10% | 16 | 12.0% |
| 10% to under 20% | 32 | 24.1% |
| 20% to under 30% | 44 | 33.1% |
| 30% to under 40% | 23 | 17.3% |
| 40% or more | 6 | 4.5% |
The overall median latest observation is 20.63%
The median across all latest observations is 20.63%. The middle half lies between 9.57% and 29.73%. The mean of 17.42% is lower than the median because several very large negative values create a long lower tail.
Across all 188 observations, 30 are negative, 18 are from zero to under 10%, 42 from 10% to under 20%, 51 from 20% to under 30%, 32 from 30% to under 40%, and 15 are at least 40%.
Gross domestic savings are related to, but not identical to, capital formation
The World Bank gross capital formation series measures additions to fixed assets, inventory changes, and net acquisitions of valuables. Gross domestic savings are GDP minus final consumption. In the national-accounts expenditure identity, domestic saving is linked to gross capital formation and net exports.
A domestic savings ratio of 35% therefore does not mean 35% of GDP was necessarily invested domestically. An economy with a large external surplus can save more than it invests at home, while an economy using external financing can invest more than its domestic saving.
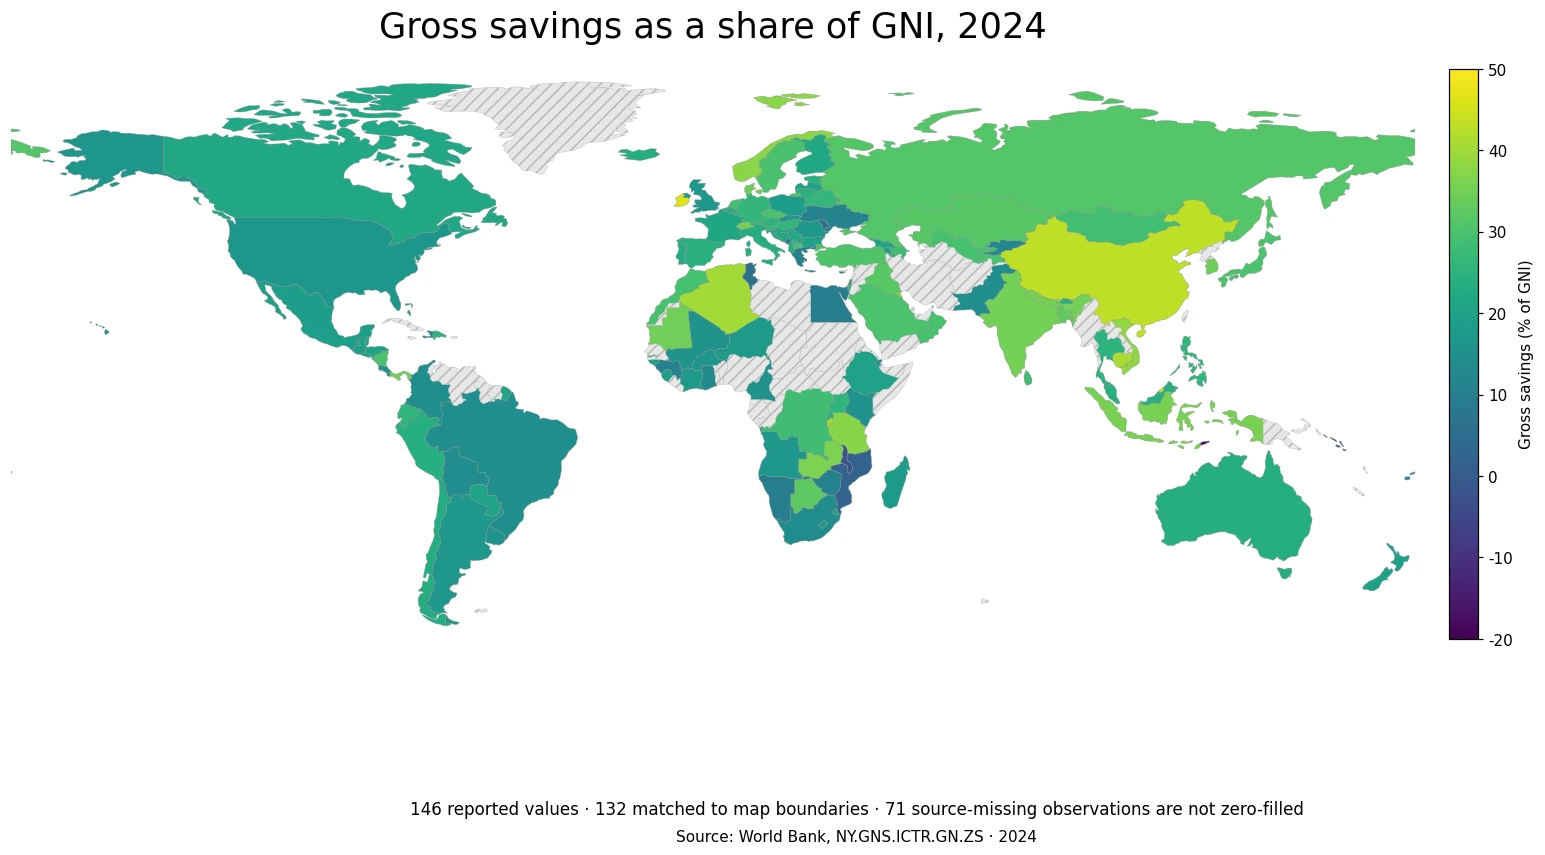
Gross domestic savings are also different from gross savings
The separate World Bank Gross savings series uses gross national income, consumption, and net transfers. Gross domestic savings use GDP and domestic final consumption, so cross-border primary income and transfer concepts enter differently.
The two indicators can diverge materially in economies with large cross-border income flows. Similar names are not enough to treat them as interchangeable.
A high savings share is not a general economic-performance score
A high ratio can provide domestic resources for investment, but it does not by itself measure living standards, productivity, economic resilience, or policy quality. A high value can also coexist with weak consumption or a large trade surplus.
Likewise, a low ratio can reflect many different circumstances, including cyclical conditions, fiscal choices, trade structure, investment financing, and external income flows. The country rows alone do not identify a single cause.
The percentage does not show the absolute amount saved
A 20% savings share in a very large economy represents a far larger absolute amount than the same 20% in a small economy. The percentage normalizes by GDP and is useful for structural comparison rather than comparing money amounts.
Current-dollar or local-currency gross domestic savings series are more appropriate for questions about absolute monetary size.
Observation-year differences remain a key limitation
Of the 188 latest observations, 133 are from 2025, 37 from 2024, and 4 from 2023. A small number are much older, with the earliest latest value in this dataset dating to 1983.
The World Bank most-recent-non-empty query broadens geographic coverage but does not synchronize years. The map therefore uses point size to distinguish 2025, 2024, and earlier observations.
| Observation year | Economies |
|---|---|
| 2025 | 133 |
| 2024 | 37 |
| 2023 | 4 |
| 2022 | 3 |
| 2018 | 2 |
| 2016 | 1 |
| 2015 | 1 |
| 2012 | 1 |
| 2011 | 1 |
| 2010 | 1 |
| 2007 | 1 |
| 2005 | 1 |
| 2004 | 1 |
| 1983 | 1 |
The simple country mean is not a GDP-weighted world savings rate
The 17.42% overall mean and 19.73% 2025 mean give each economy equal weight. A very large economy and a small territory each contribute one observation.
A global savings share would require weighting by GDP or using an official aggregate. The means and medians reported here summarize the distribution of country ratios only.
Source and calculation notes
The source is World Bank World Development Indicators series NY.GDS.TOTL.ZS, drawing on official country statistics, national statistical organizations and central banks, OECD National Accounts files, and World Bank staff estimates. The analysis uses 188 latest non-empty observations and separately summarizes the 133 observations from 2025.
All 188 country codes are matched to geographic centroids for the map, producing a 100% match. Negative values are preserved and no missing observation is replaced with zero.
Frequently Asked Questions
How are gross domestic savings calculated?
The World Bank defines them as GDP minus final consumption expenditure. This indicator expresses that amount as a percentage of GDP.
Can gross domestic savings be negative?
Yes. They can be negative when final consumption expenditure exceeds GDP. This is not the same as a household saving rate or government budget balance.
Are gross domestic savings the same as gross capital formation?
No. Domestic savings are GDP minus final consumption, while gross capital formation measures investment in fixed assets, inventories, and valuables.
Related Articles
Green Map creates custom-edited map images using open geographic data sources such as geoBoundaries, Natural Earth, OpenStreetMap, and government open data. These maps are edited visual materials, not raw data files, and are provided for education, documents, presentations, and graphic reference.