World Bank indicator SH.STA.BRTW.ZS provides a 2020 low-birthweight prevalence estimate for 157 countries and economies. The unweighted country mean is 10.92%, the median 10.20%, the first quartile 7.18%, and the third quartile 14.28%. India has the highest estimate at 27.44%, followed by Bangladesh at 23.05% and Comoros at 23.03%. Iceland, Finland, and Sweden are at the low end near 4%.
Low birthweight means a birth weight below 2,500 grams regardless of gestational age. Birthweight is the first weight obtained after birth and should preferably be measured within the first hour, before significant postnatal weight loss. The indicator is the percentage of live births meeting that weight threshold.
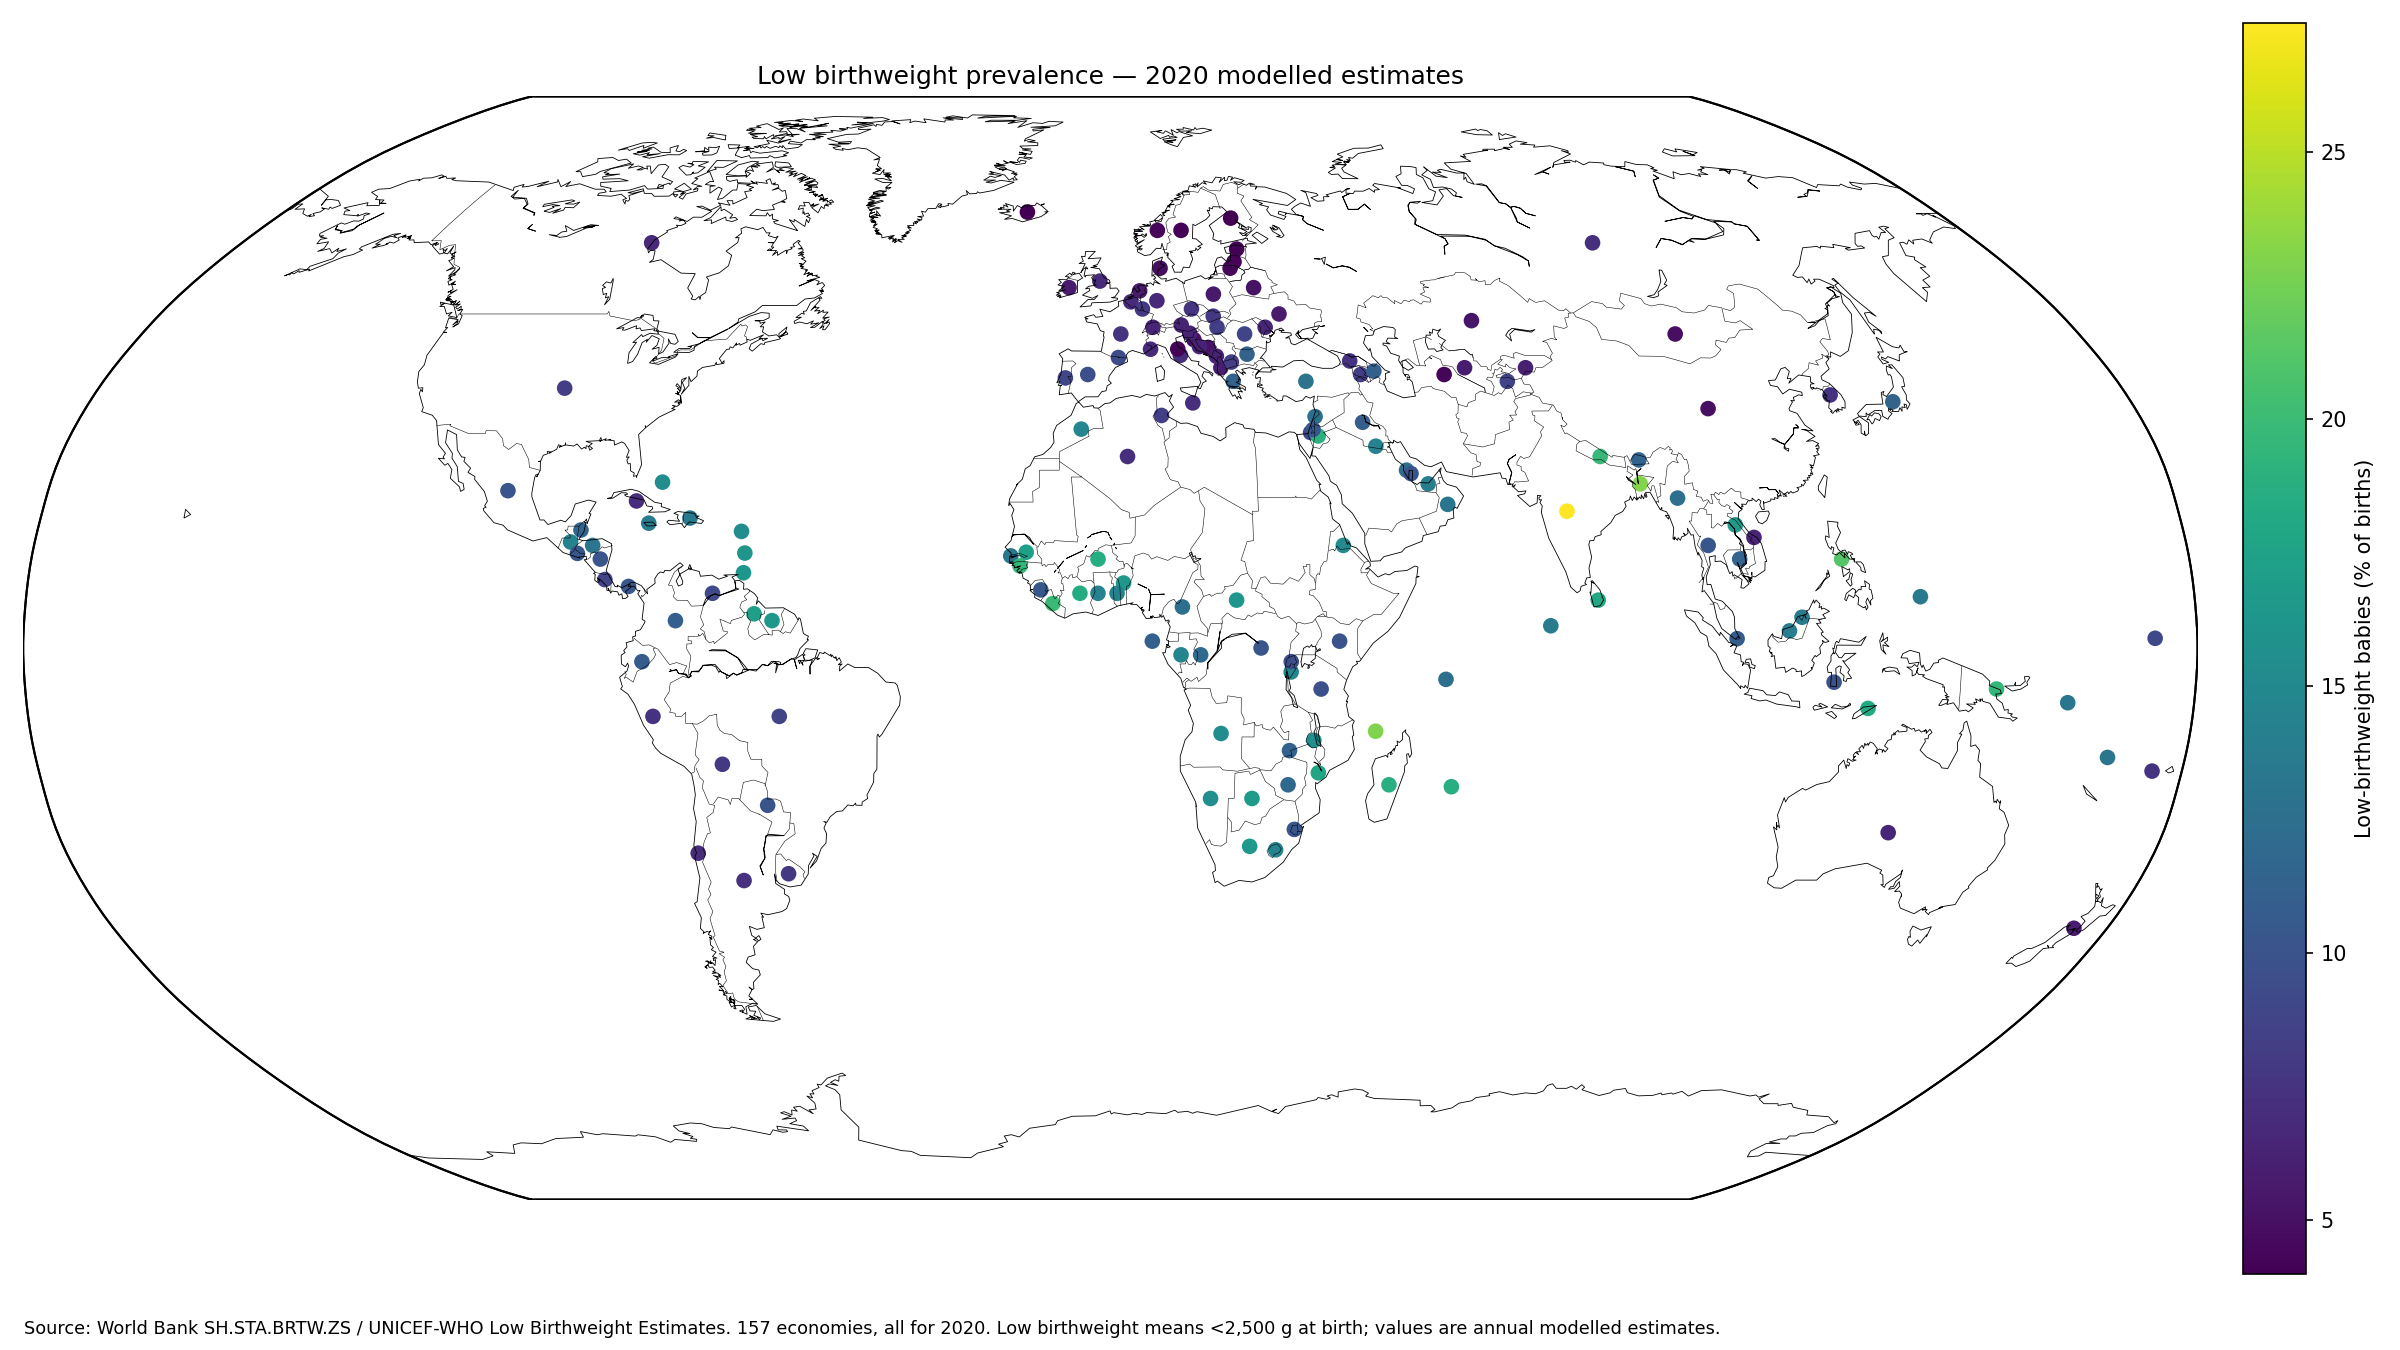
Table of Contents
Low birthweight means less than 2,500 grams
The World Bank metadata glossary defines low-birthweight babies as newborns weighing less than 2,500 grams. The World Health Organization uses the same threshold regardless of gestational age.
That makes low birthweight different from preterm birth. A newborn can have low weight because of preterm delivery, fetal growth restriction, or both. The two indicators overlap, but they do not identify the same group of births.
The 2020 country values are annual modelled estimates
UNICEF documentation explains that the 2023 low-birthweight database combined administrative data with nationally representative household surveys such as DHS and MICS. Survey inputs were adjusted for missing birthweights and heaping, then statistical modelling was used to produce annual country estimates for 2000–2020.
The values used here should therefore not be described as if every country conducted the same complete census of birthweights in 2020. They are harmonized annual estimates derived from the best available input data and a common modelling framework.
The median across 157 economies is about 10.2%
The median is 10.20%. The middle half of country estimates lies between 7.18% and 14.28%. The mean of 10.92% sits slightly above the median because a small group of estimates above 20% extends the upper tail.
For describing a typical country, the median and quartiles are therefore useful alongside the mean. They show that the distribution is broad rather than clustered around one global level.
Thirty-two economies are at or above 15%
13 estimates are below 5%, 36 are from 5% to under 7.5%, 26 from 7.5% to under 10%, and 50 from 10% to under 15%. Another 28 are from 15% to under 20%, while 4 are at least 20%.
Combining the two highest bands gives 32 economies at or above 15%. At the other end, 75 are below 10%.
| 2020 low-birthweight prevalence | Economies | Share of 157 |
|---|---|---|
| Below 5% | 13 | 8.3% |
| 5% to under 7.5% | 36 | 22.9% |
| 7.5% to under 10% | 26 | 16.6% |
| 10% to under 15% | 50 | 31.8% |
| 15% to under 20% | 28 | 17.8% |
| 20% or more | 4 | 2.5% |
India has the highest 2020 estimate at 27.44%
The highest estimates are India 27.44%, Bangladesh 23.05%, Comoros 23.03%, the Philippines 21.14%, Liberia 19.88%, Nepal 19.73%, Guinea-Bissau 19.55%, Papua New Guinea 19.38%, Jordan 18.94%, and Madagascar 18.71%.
These are modelled prevalence estimates, not a ranking of maternal health systems. Many pathways can contribute to low birthweight, including preterm birth and fetal growth restriction, and a single five-column country dataset cannot establish the reasons for one country’s level.
| Rank | Country or economy | 2020 low-birthweight prevalence |
|---|---|---|
| 1 | India | 27.44% |
| 2 | Bangladesh | 23.05% |
| 3 | Comoros | 23.03% |
| 4 | Philippines | 21.14% |
| 5 | Liberia | 19.88% |
| 6 | Nepal | 19.73% |
| 7 | Guinea-Bissau | 19.55% |
| 8 | Papua New Guinea | 19.38% |
| 9 | Jordan | 18.94% |
| 10 | Madagascar | 18.71% |
| 11 | Mauritius | 18.69% |
| 12 | Burkina Faso | 18.47% |
| 13 | Cote d’Ivoire | 18.29% |
| 14 | Timor-Leste | 18.21% |
| 15 | Sri Lanka | 17.98% |
The lowest estimates are around 4–6%
Iceland records 3.99%, Finland 4.07%, Sweden 4.12%, Estonia 4.17%, Latvia 4.23%, San Marino 4.24%, Turkmenistan 4.29%, Lithuania 4.40%, Norway 4.44%, and Denmark 4.81%.
A low percentage does not mean low birthweight is absent. Even a 4% prevalence can represent many newborns in a country with a large number of births.
| Low-end rank | Country or economy | 2020 low-birthweight prevalence |
|---|---|---|
| 1 | Iceland | 3.99% |
| 2 | Finland | 4.07% |
| 3 | Sweden | 4.12% |
| 4 | Estonia | 4.17% |
| 5 | Latvia | 4.23% |
| 6 | San Marino | 4.24% |
| 7 | Turkmenistan | 4.29% |
| 8 | Lithuania | 4.40% |
| 9 | Norway | 4.44% |
| 10 | Denmark | 4.81% |
| 11 | Mongolia | 4.90% |
| 12 | China | 4.97% |
| 13 | Croatia | 4.99% |
| 14 | Belarus | 5.12% |
| 15 | Bosnia and Herzegovina | 5.15% |
Prevalence and number of low-birthweight babies answer different questions
This indicator is expressed as a percentage of births. A country with one million births and 10% prevalence has a much larger estimated number of low-birthweight babies than a country with one hundred thousand births and the same 10% prevalence.
Absolute burden therefore requires the number of births or a modelled count of low-birthweight babies. Prevalence is better suited to comparing how common the outcome is among births.
Low birthweight is not the same as preterm birth
Preterm birth is defined by gestational age, generally before 37 completed weeks. Low birthweight is defined by weight below 2,500 grams. Preterm infants often have low birthweight, but not every preterm infant falls below the threshold and some term infants do because of growth restriction.
The two indicators should be analyzed separately. Using low-birthweight prevalence as if it were a preterm-birth rate would change the meaning of the data.
The 2,500-gram threshold applies regardless of gestational age
Under the WHO definition, a newborn weighing up to 2,499 grams is in the low-birthweight category, while 2,500 grams is not. The threshold provides a consistent international definition but does not explain whether the low weight was caused by prematurity or restricted fetal growth.
Assessing growth relative to gestational age requires a separate small-for-gestational-age measure. Birthweight alone cannot diagnose the full course of pregnancy.
Timing of the first weight measurement matters
Newborns normally lose some weight after birth, so the definition refers to the first weight and recommends measurement within the first hour when possible. A later measurement could be influenced by postnatal weight loss.
Birthweight data can also be incomplete or affected by heaping at round numbers. Those data-quality issues are among the reasons UNICEF and WHO use adjustment and modelling rather than relying on raw survey percentages alone.
Modelling improves coverage but does not remove uncertainty
The UNICEF-WHO estimation system uses Bayesian multilevel regression to combine incomplete and uneven input data into annual country estimates. This helps provide a consistent series even when source years differ or data are sparse.
A model estimate is still not identical to a direct measurement. Detailed policy analysis should consider uncertainty intervals and the underlying national data sources. This article uses the supplied 2020 point estimates only.
Geographic patterns are visible but causes need separate evidence
Many of the highest estimates are in South Asia, parts of sub-Saharan Africa, Southeast Asia, the Pacific, and the Middle East, while several Nordic and Baltic economies appear near the lower end. The map makes those broad spatial patterns easy to see.
Spatial clustering does not establish one common cause. Maternal nutrition and health, antenatal care, infections, smoking, multiple pregnancy, poverty, and health-system access can all matter in different settings.
Country prevalence is not an individual diagnosis
Low-birthweight prevalence is a population-level birth outcome. A high national estimate does not mean every pregnant woman in that country has poor nutrition or inadequate care, and a low estimate does not eliminate high-risk pregnancies or disadvantaged groups.
Population statistics are useful for monitoring and comparison but cannot replace individual medical assessment.
The simple country mean is not the global birth-weighted prevalence
The 10.92% mean used here gives each of the 157 economies equal weight. A country with tens of millions of births and a small island economy each contribute one value.
Regional and global UNICEF-WHO estimates weight countries by births. The simple country mean and the global prevalence therefore answer different statistical questions and should not be treated as interchangeable.
Source and calculation notes
The source is World Bank World Development Indicators series SH.STA.BRTW.ZS, based on UNICEF-WHO Low Birthweight Estimates. Mean, median, quartiles, rankings, and distribution bands are calculated directly from the 157 numeric observations for 2020. Definitions and methodology are checked against UNICEF and WHO.
All 157 country codes are joined to geographic centroids for the map, producing a 100% match. Economies outside the 157-row dataset are not converted to zero or assigned invented values.
Frequently Asked Questions
What weight is considered low birthweight?
WHO defines low birthweight as less than 2,500 grams at birth, regardless of gestational age.
Are the 2020 values direct surveys conducted in every country in 2020?
No. They are annual country estimates produced by UNICEF and WHO from administrative and survey inputs using adjustment and statistical modelling.
Is low birthweight the same as preterm birth?
No. Low birthweight is based on weight below 2,500 grams, while preterm birth is based on gestational age. The groups overlap but are not identical.
Related Articles
Green Map creates custom-edited map images using open geographic data sources such as geoBoundaries, Natural Earth, OpenStreetMap, and government open data. These maps are edited visual materials, not raw data files, and are provided for education, documents, presentations, and graphic reference.