The World Bank indicator TX.VAL.MANF.ZS.UN reports the share of merchandise exports classified as manufactures. Latest non-empty observations are available for 198 countries and territories, but they do not all belong to 2025. There are 24 observations from 2025, 108 from 2024, and 28 from 2023, while 30 observations are from 2019 or earlier. The oldest latest observation in this extract is from 1975. The dataset is therefore a latest-available comparison, not a complete 2025 world ranking.
The unweighted mean across the 198 latest observations is 37.46% and the median is 30.94%. The first quartile is 9.03% and the third quartile 66.00%. 21 economies are at 80% or more, while 54 are below 10%. The spread shows sharply different merchandise-export structures, from manufacturing-heavy baskets to exports dominated by non-manufactured goods.
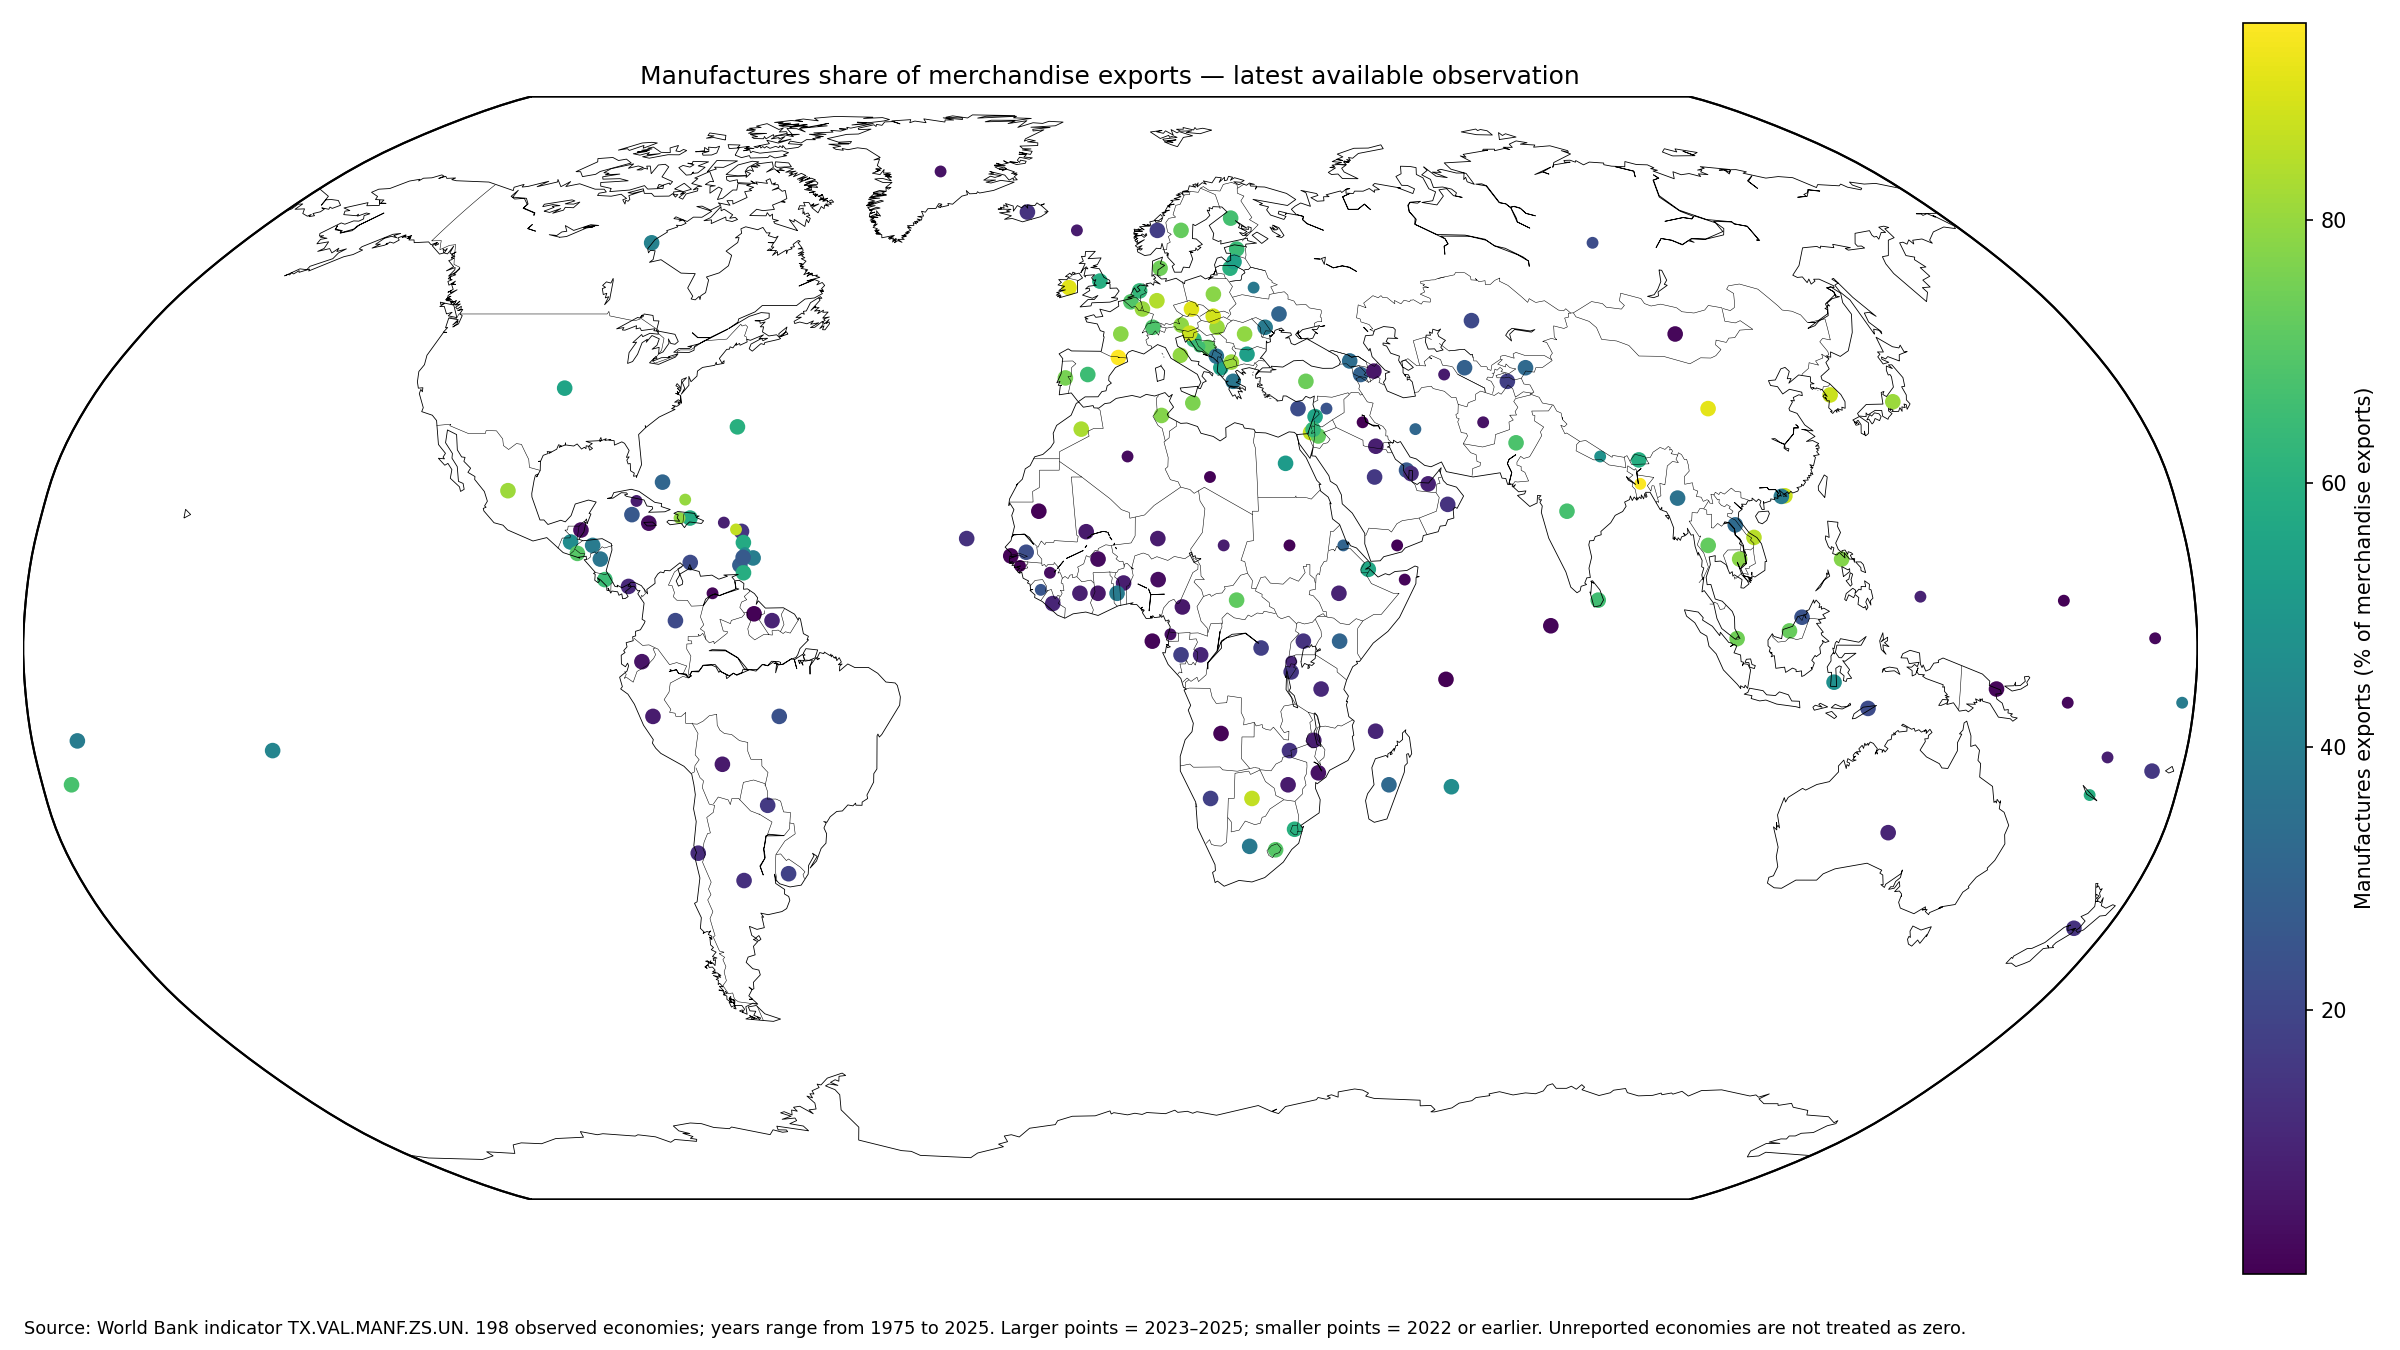
Table of Contents
What counts as manufactures in this indicator
World Bank metadata defines manufactures using SITC Revision 3 sections 5 through 8: chemicals, basic manufactures, machinery and transport equipment, and miscellaneous manufactured goods, while excluding division 68 for non-ferrous metals. The denominator is merchandise exports. Services exports are outside that denominator, so a 70% value means manufactures are 70% of merchandise exports, not 70% of all exports including services.
The official definition is available in the World Bank metadata glossary, and the World Bank API provides the observations. The metadata identifies UN Comtrade and World Bank staff estimates as the source framework and notes that merchandise-export shares may not sum perfectly to 100% because of unclassified trade.
The upper tail is dominated by 80–95% observations
Andorra has the highest latest observation at 94.99%, followed by Bangladesh at 94.45%, China at 91.16%, Ireland at 90.75%, and Czechia at 90.24%. The Slovak Republic, Hong Kong SAR, Slovenia, Korea, and Israel are also in the high-80% range. These figures describe the composition of merchandise exports, not the absolute size of export industries.
Observation year is critical. Andorra is a 2023 value, Bangladesh is 2018, China, Ireland, and Czechia are 2024, while Mexico, Japan, and Hungary are 2025. A value can rank highly and still be materially older than another country’s observation.
| Rank | Country or territory | Observation year | Manufactures share |
|---|---|---|---|
| 1 | Andorra | 2023 | 94.99% |
| 2 | Bangladesh | 2018 | 94.45% |
| 3 | China | 2024 | 91.16% |
| 4 | Ireland | 2024 | 90.75% |
| 5 | Czechia | 2024 | 90.24% |
| 6 | Slovak Republic | 2024 | 88.61% |
| 7 | Hong Kong SAR, China | 2024 | 87.41% |
| 8 | Slovenia | 2024 | 87.38% |
| 9 | Korea, Rep. | 2024 | 87.29% |
| 10 | Israel | 2024 | 86.60% |
| 11 | St. Kitts and Nevis | 2017 | 86.37% |
| 12 | Botswana | 2023 | 86.27% |
| 13 | Viet Nam | 2023 | 84.97% |
| 14 | Germany | 2024 | 84.13% |
| 15 | Morocco | 2024 | 82.89% |
At the low end, manufactures are close to zero
Guinea-Bissau records about 0.0001%, Iraq 0.0029%, Seychelles 0.33%, Guyana 0.46%, and the Federated States of Micronesia 0.49%. Mauritania, Yemen, Libya, The Gambia, and Angola are also near the bottom. These percentages do not say that the countries export little merchandise overall; they say manufactured products are a small part of the merchandise-export basket.
An economy can have substantial merchandise exports and still record a low manufactures share when fuels, minerals, agricultural goods, or other primary commodities dominate. Conversely, a small exporter can record a very high share if most exported goods fall inside the manufactures classification.
| Low-end rank | Country or territory | Observation year | Manufactures share |
|---|---|---|---|
| 1 | Guinea-Bissau | 2015 | 0.000% |
| 2 | Iraq | 2016 | 0.003% |
| 3 | Seychelles | 2024 | 0.329% |
| 4 | Guyana | 2025 | 0.461% |
| 5 | Micronesia, Fed. Sts. | 2013 | 0.493% |
| 6 | Mauritania | 2024 | 0.510% |
| 7 | Yemen, Rep. | 2019 | 0.553% |
| 8 | Libya | 2019 | 0.636% |
| 9 | Gambia, The | 2024 | 1.010% |
| 10 | Angola | 2024 | 1.058% |
| 11 | Sudan | 2018 | 1.109% |
| 12 | Maldives | 2024 | 1.239% |
A 30.94% median highlights the breadth of the distribution
The median is 30.94%, below the 37.46% mean. High values in the 80–95% range lift the average. The interquartile range stretches from 9.03% to 66.00%, a span of roughly 56.97 percentage points.
By broad bands, 54 observations are below 10%, 42 are from 10% to under 30%, 44 are from 30% to under 60%, 37 are from 60% to under 80%, and 21 are at least 80%. No single narrow band describes the world distribution.
Observation years range from 1975 to 2025
Most values are reasonably recent: 160 observations are from 2023–2025. Another 8 are from 2020–2022, but 30 are from 2019 or earlier. Chad’s latest value is from 1975, the U.S. Virgin Islands from 1978, Somalia from 1982, and Equatorial Guinea from 1983. Those rows should not be described as current trade structures without a clear date caveat.
Using the latest non-empty value preserves geographic coverage. The trade-off is uneven time comparability. Old observations can still be useful for locating the last reported structure, but they should not be mixed into a present-day policy comparison as if they were recent.
Restricting the comparison to 2024–2025 changes the coverage
Keeping only 2024 and 2025 observations leaves 132 countries and territories. China leads this recent subset at 91.16%, followed by Ireland at 90.75%, Czechia at 90.24%, the Slovak Republic at 88.61%, and Hong Kong SAR at 87.41%. Time comparability improves, but 66 of the 198 latest-observation economies are excluded.
| Recent-data rank | Country or territory | Year | Manufactures share |
|---|---|---|---|
| 1 | China | 2024 | 91.16% |
| 2 | Ireland | 2024 | 90.75% |
| 3 | Czechia | 2024 | 90.24% |
| 4 | Slovak Republic | 2024 | 88.61% |
| 5 | Hong Kong SAR, China | 2024 | 87.41% |
| 6 | Slovenia | 2024 | 87.38% |
| 7 | Korea, Rep. | 2024 | 87.29% |
| 8 | Israel | 2024 | 86.60% |
| 9 | Germany | 2024 | 84.13% |
| 10 | Morocco | 2024 | 82.89% |
| 11 | Mexico | 2025 | 81.21% |
| 12 | North Macedonia | 2024 | 80.60% |
The two views answer different questions. The 198-economy table maximizes coverage using each economy’s latest available value. The 2024–2025 subset improves temporal consistency. Users should choose between them based on whether broad coverage or a narrower recent-period comparison is more important.
Manufacturing-heavy export baskets appear across East Asia and Europe
The recent high-share group includes China, Hong Kong SAR, Japan, and Viet Nam, as well as Czechia, the Slovak Republic, Slovenia, Germany, Hungary, Italy, and Austria. The common feature shown by this indicator is a large manufactures share in merchandise exports.
That does not rank manufacturing sophistication, productivity, or industrial scale. A high share can consist of very different manufactured goods, and total export values differ enormously across economies. Questions about technology intensity or manufacturing scale need additional indicators such as medium- and high-tech export shares, manufacturing value added, or manufactured-export values.
Commodity-oriented exporters can record low manufactures shares
Economies where fuels, minerals, agricultural goods, or other primary commodities dominate merchandise exports can have low values in this indicator. Angola, Mauritania, and Libya are examples of low latest shares. The percentage itself does not identify which commodity group is responsible.
A causal interpretation requires commodity-level export data. The ratio can also change because of movements in the denominator: if commodity exports surge, the manufactures share can fall even when manufactured exports do not decline. Likewise, a fall in commodity exports can raise the share without a rise in manufactured-export value.
A rising share is not the same as growing manufactured-export value
This is a ratio. Manufactured exports in the numerator and total merchandise exports in the denominator can both move. A higher share can result from stronger manufactured exports, weaker non-manufactured exports, or both. A lower share can occur even while manufactured exports grow if other merchandise exports rise faster.
For growth analysis, a time series of manufactured-export value is needed. For the role of manufacturing in the domestic economy, manufacturing value added, employment, output, or productivity indicators are more appropriate. This series is strongest as a structural trade-composition measure.
The country mean is not a world trade-weighted average
The 37.46% mean gives every country or territory equal weight. China and a very small exporter each contribute one percentage observation. It therefore cannot be interpreted as the actual share of manufactures in total world merchandise exports.
A world trade-weighted share would require merchandise-export values as weights. The median also describes the distribution of economies, not the middle dollar of global trade. Mean and median here are country-level summary statistics only.
Source and calculation notes
The source is World Bank World Development Indicators series TX.VAL.MANF.ZS.UN. The analysis uses the latest non-empty observation for 198 countries and territories and calculates the mean, median, quartiles, distribution bands, and rankings directly from those values. The official World Bank API provides the series.
The map joins all 198 ISO country codes to country centroids, producing a 100% match for the reported observations. Larger points mark 2023–2025 values and smaller points mark 2022 or earlier. Missing economies are left as no data, not converted to zero, and old latest observations retain their actual observation year.
Frequently Asked Questions
Is this a complete 2025 global ranking?
No. The 198 latest observations span 1975–2025. Only 24 are from 2025 and 108 are from 2024.
Does an 80% value mean manufactures are 80% of all exports?
No. The denominator is merchandise exports, so services exports are not included.
Does a high share mean a country has a large manufactured-export value?
Not necessarily. This is a composition ratio, so a small exporter can have a high share if manufactures dominate its merchandise-export basket.
Related Articles
Green Map creates custom-edited map images using open geographic data sources such as geoBoundaries, Natural Earth, OpenStreetMap, and government open data. These maps are edited visual materials, not raw data files, and are provided for education, documents, presentations, and graphic reference.