UNESCO Institute for Statistics provides a 2025 modelled estimate of female upper-secondary completion for 164 countries and territories. The indicator is more specific than a general graduation or enrolment statistic. It looks at the share of females in an age group three to five years older than the official age for the last grade of upper secondary education who have completed that level. In other words, it asks whether a young cohort has reached completion within a reasonable period after the expected finishing age.
The distribution is extremely wide. The unweighted median across the 164 observations is 72.63%, while the simple mean is 61.13%. The lower quartile is 32.70% and the upper quartile is 90.33%. Because the median is 11.50 percentage points above the mean, the dataset has a pronounced lower tail: many systems cluster at relatively high completion levels, but a substantial group of low values pulls the average downward.
These percentages should not be treated as a one-dimensional league table of education systems. Completion can reflect entry timing, repetition, dropout, access, household constraints, conflict, migration and many other processes. A high rate does not by itself demonstrate stronger learning outcomes, and a low rate does not identify a single cause. The indicator is most useful as a clearly defined outcome that can be combined with other education and social measures.
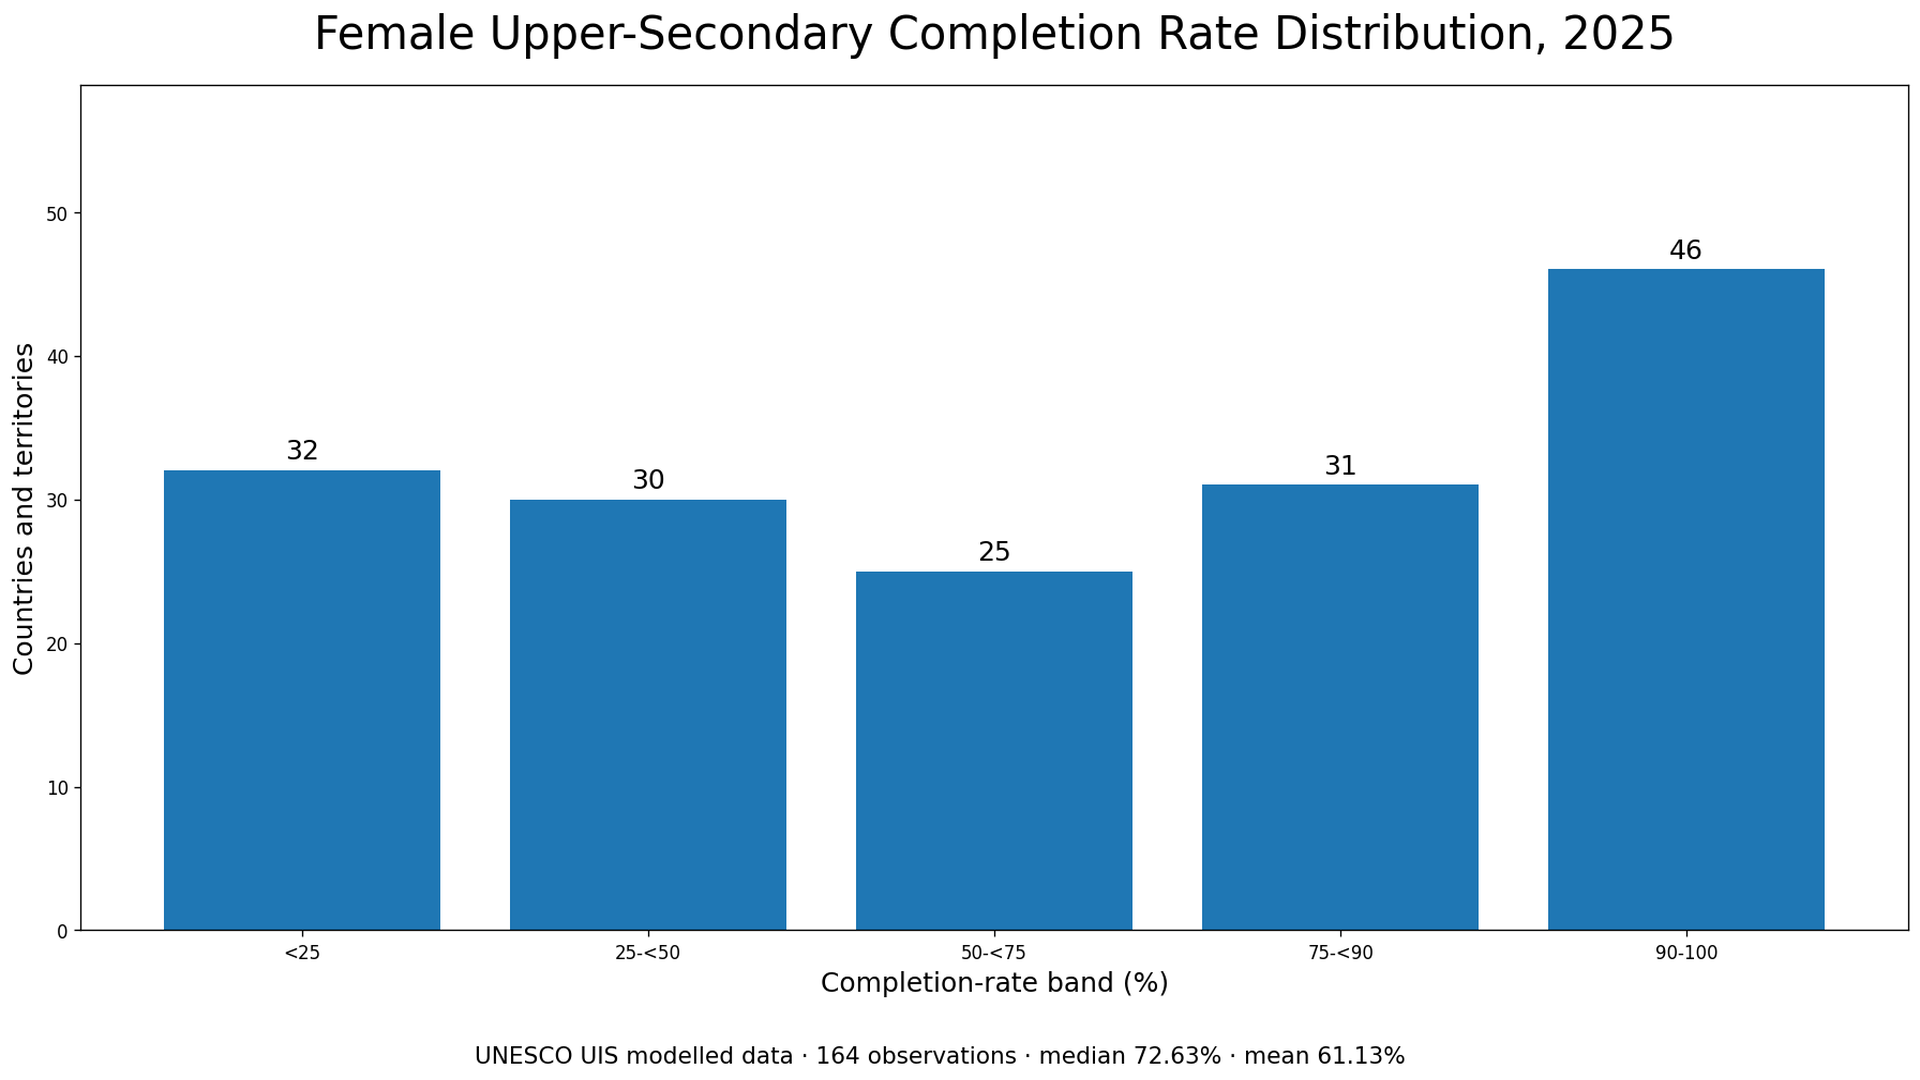
Table of Contents
The median is 72.63%, well above the 61.13% mean
The gap between the mean and median is one of the most important features of the dataset. If every country and territory is given equal weight, the average is 61.13%. Yet the middle observation in the ordered distribution is 72.63%. That means a description based only on the mean would make the typical country look lower than the median country. The difference is created by a broad set of low-completion observations rather than by one isolated outlier.
The interquartile range runs from 32.70% to 90.33%, a span of 57.63 percentage points. Even the middle half of the distribution therefore covers a large range. A country just above the median and one near the upper quartile can have very different completion conditions despite both being casually described as “above average.” Quartiles are a better reminder of that spread than a single central number.
Forty-six observations are at 90% or above, while 32 are below 25%
The distribution bands make the contrast concrete. There are 46 observations at 90% or above and 31 from 75% to below 90%. Another 25 fall from 50% to below 75%. At the lower end, 30 are between 25% and below 50%, and 32 are below 25%. The world represented by these observations is not concentrated around one common completion level.
A value above 90% suggests that upper-secondary completion is close to universal for the female cohort defined by the indicator, but it does not mean every individual followed the same path or completed on time. Similarly, a value below 25% signals that completion is uncommon in the measured cohort, but the percentage alone cannot tell us whether school availability, cost, early marriage, labour-market pressures, displacement, repetition or another mechanism is most important.
The observed range spans 98.57 percentage points
Saint Lucia is at the top of the 2025 dataset with a modelled value of 100.00%, followed by China at 99.33% and Uzbekistan at 99.12%. At the other end, South Sudan is at 1.43%, Somalia at 3.09%, Niger at 3.30% and Chad at 3.53%. The difference between the maximum and minimum is 98.57 percentage points, illustrating how little is gained by talking about a single global “typical” experience.
The extremes should be read as rates, not counts. A smaller country can have a very high percentage while contributing far fewer completed students in absolute numbers than a much larger country. The same applies at the bottom: a low percentage does not reveal the number of people affected unless the size of the relevant female age cohort is also known. Percentage rankings and population counts answer different questions.
| Group | Country or territory | Female completion rate, 2025 |
|---|---|---|
| T1 | Saint Lucia | 100.00% |
| T2 | China | 99.33% |
| T3 | Uzbekistan | 99.12% |
| T4 | Republic of Korea | 99.02% |
| T5 | Croatia | 98.52% |
| T6 | Barbados | 98.44% |
| T7 | Ukraine | 98.29% |
| T8 | Kazakhstan | 97.71% |
| T9 | Greece | 96.87% |
| T10 | Israel | 96.76% |
| B1 | South Sudan | 1.43% |
| B2 | Somalia | 3.09% |
| B3 | Niger | 3.30% |
| B4 | Chad | 3.53% |
| B5 | Central African Republic | 5.18% |
| B6 | Zimbabwe | 6.35% |
| B7 | Mozambique | 6.74% |
| B8 | Equatorial Guinea | 6.78% |
| B9 | United Republic of Tanzania | 7.52% |
| B10 | Mali | 8.13% |
What the completion-rate indicator actually measures
UNESCO defines the completion rate for a level of education as the percentage of a cohort aged three to five years above the intended age for the final grade that has completed that grade. For upper secondary education, this focuses on a relatively young group that should already have had enough time to finish even if entry or progression was somewhat delayed. It is therefore an outcome of progression through the education system, not a snapshot of current attendance.
This distinction matters because several education indicators use similar words but different denominators. An enrolment rate asks whether people are enrolled, an intake rate may focus on entry to a grade, and educational attainment among adults reflects the cumulative experience of older generations. Completion rate is narrower: it asks whether the specified young cohort has completed the level. Mixing these concepts can create apparent contradictions that are actually differences in measurement.
Why “modelled data” needs a careful reading
The series is explicitly labelled as modelled data. That means it should not be understood as 164 perfectly synchronized direct surveys conducted in 2025 with identical fieldwork. UIS uses available country observations and a modelling framework to produce internationally comparable estimates and fill gaps in a consistent way. This is valuable for cross-country comparison, but the modelled estimate can differ from a national administrative statistic or survey result published for a closely related concept.
Values close to 100% should also be interpreted as estimates near the ceiling rather than proof that measurement uncertainty has disappeared or that literally every individual completed upper secondary education. At the low end, one annual modelled estimate should not be used by itself to forecast the next year. Trend analysis requires multiple years from the same series and attention to revisions in the underlying data and modelling process.
Completion is not the same as learning, current enrolment or adult attainment
A completion rate tells us that a level of education was completed; it does not directly tell us how much students learned. Literacy and numeracy proficiency, examination performance, teacher qualifications, instructional time and school resources answer different questions. A system can achieve high completion while still facing learning-quality challenges, and a lower-completion system can contain schools or groups with strong learning outcomes. Completion and learning should be analysed together, not substituted for one another.
The indicator also differs from the share of adults whose highest educational attainment is upper secondary or higher. Adult attainment combines many cohorts educated under different historical conditions. The 2025 completion estimate focuses on a younger cohort around the expected finishing age. Countries that expanded secondary education rapidly may therefore show much stronger youth completion than older adult attainment, while recent disruptions may appear in youth measures before they are visible in the adult stock.
Gender comparisons require the matching male series
This dataset covers females only. A statement about a gender gap requires the corresponding male completion rate based on the same level, age definition, year and modelling approach. A high female rate does not automatically imply a small gap, and a low female rate does not prove that males are doing better. The direction and size of the gap must be measured from both sides using comparable indicators.
It is also useful to distinguish gender parity from overall completion. Two groups can have nearly identical rates while both remain low, meaning parity is relatively close but universal completion is far away. Conversely, both groups can have high rates with a small remaining difference. Equity and overall access are related policy questions, but they are not interchangeable and should not be collapsed into a single score.
What the 2025 comparison can and cannot establish
The strongest use of this dataset is descriptive. Because all 164 observations refer to 2025 and the same official indicator, they can be compared to show the scale of cross-country variation, the size of the lower tail and the concentration of high-completion systems. The median, quartiles and distribution bands provide context that a simple rank cannot.
The dataset does not establish why one country differs from another. Explanations involving education spending, school distance, household income, early marriage, fertility, conflict, migration, urbanization or policy design require additional evidence. A cross-sectional rank is therefore not a causal evaluation and should not be presented as a direct measure of policy effectiveness.
The 164 observations also should not be described as a complete list of every country and territory in the world. Absence from the dataset is not a zero. Missing information and a measured value of zero are fundamentally different states. Replacing missing values with zero would distort the average, the distribution and any map derived from the data.
Source and calculation notes
The underlying series is UNESCO Institute for Statistics indicator CR.MOD.3.F, “Completion rate, upper secondary education, female (modelled data) (%)”. Every row used here is dated 2025, and the dataset contains 164 non-missing percentage values. The mean, median, quartiles, band counts and extreme values in this article were calculated directly from those observations.
The reported 61.13% mean is an unweighted country average. China, Barbados and every other observation contribute one value each regardless of population size. It therefore does not mean that 61.13% of all females worldwide completed upper secondary education. A population-weighted global rate would require the size of the relevant female cohort in every country and a different calculation.
Frequently Asked Questions
What is the median female upper-secondary completion rate in the 2025 dataset?
The unweighted median across 164 countries and territories is 72.63%, compared with a simple mean of 61.13%.
Is upper-secondary completion the same as current enrolment?
No. The indicator measures whether females three to five years older than the intended age for the last grade have completed the level, not whether they are currently enrolled.
What does “modelled data” mean in this UNESCO series?
UIS uses available observations and a statistical modelling framework to produce comparable estimates. A modelled value can differ from a national administrative or survey figure that uses a different definition or reference point.
Related Articles
Green Map creates custom-edited map images using open geographic data sources such as geoBoundaries, Natural Earth, OpenStreetMap, and government open data. These maps are edited visual materials, not raw data files, and are provided for education, documents, presentations, and graphic reference.