Utility-scale net generation from petroleum liquids was highly concentrated across U.S. states in 2024. Summing the 50 states and the District of Columbia in the EIA dataset gives 11,455.73 thousand megawatthours. Hawaii alone recorded 7,054.02 thousand MWh, or 61.6% of that state-level total. Alaska ranked second at 919.32 thousand MWh, or 8.0%. Together, the two states represented 69.6% of all generation recorded in the 51-area comparison. This article examines the distribution without treating generation as a proxy for fuel consumption, capacity, cost, or policy performance.
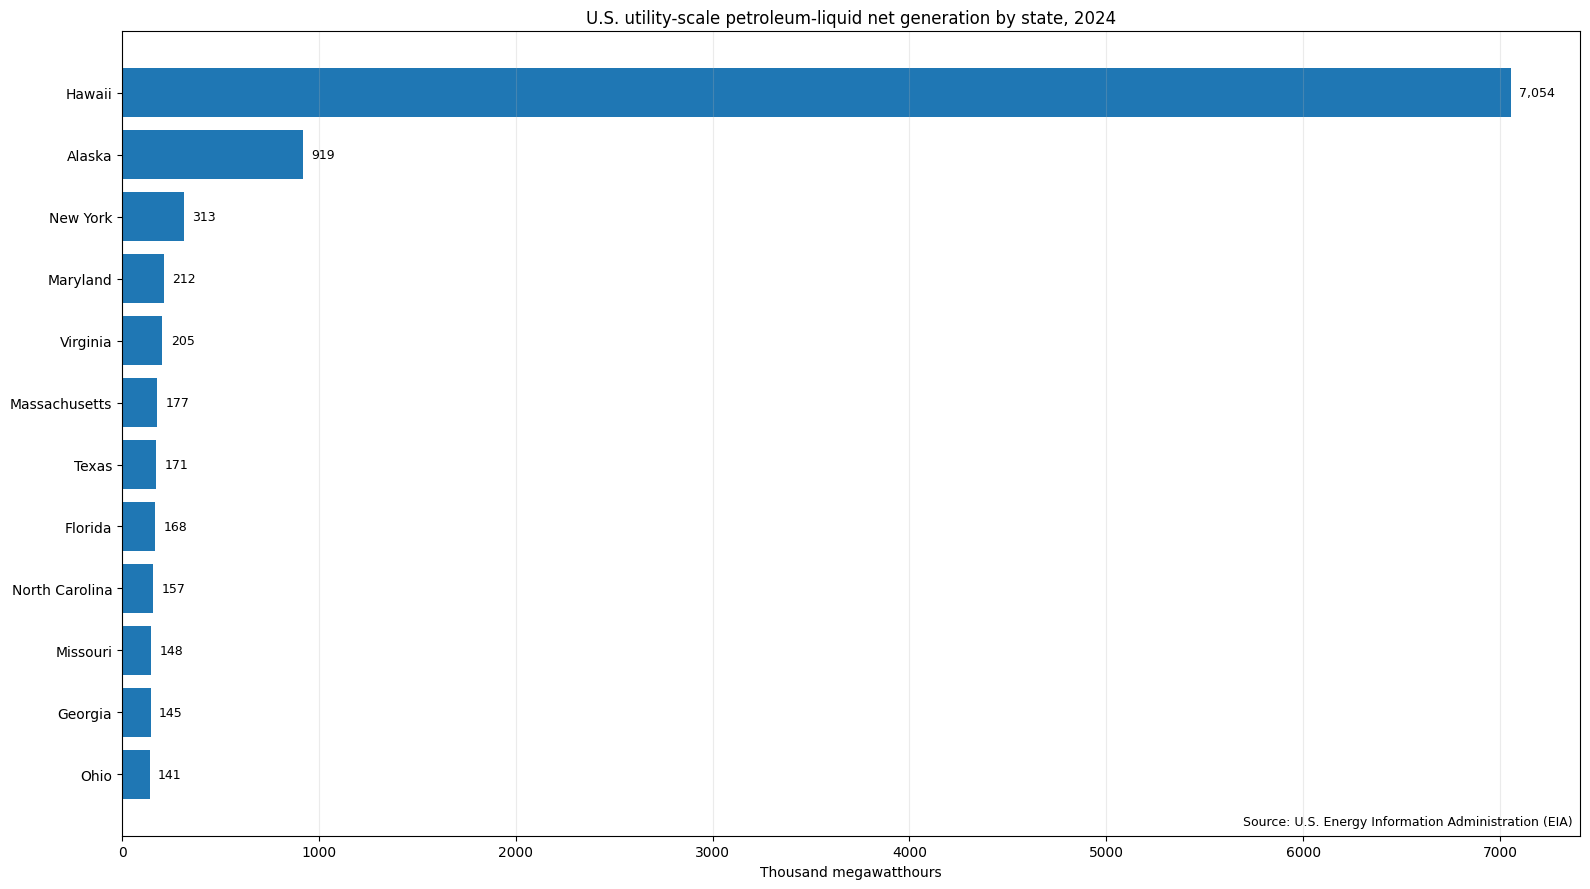
Table of Contents
What the dataset measures
The underlying series comes from the U.S. Energy Information Administration Electricity Electric Power Operational Data API. The selected observations use the annual frequency, the generation field, petroleum liquids as the fuel type (PEL), and sector 99. The geography is state level, and the dataset contains one 2024 observation for each of the 50 states plus the District of Columbia. The common unit is thousand megawatthours, so every ranking and share below is calculated from values that use the same year, fuel category, sector filter, and unit.
The metric is net generation, not petroleum-liquid fuel consumption and not generating capacity. That distinction matters because a state can rank differently on fuel used, electricity produced, installed capacity, or the petroleum share of its total electricity mix. The present data can establish how much net generation was recorded for this one fuel category in each area. It cannot, by itself, establish why a state recorded a high or low value or how important petroleum liquids were relative to every other electricity source in that state.
Hawaii accounted for 61.6% and Alaska for another 8.0%
The 51-area sum is 11,455.73 thousand MWh, equivalent to about 11.46 million MWh. Hawaii contributed 7,054.02 thousand MWh, equal to 61.6% of the combined state-level values. Alaska contributed 919.32 thousand MWh, or 8.0%. Hawaii therefore recorded about 7.7 times Alaska’s value, making the gap between first and second unusually large.
The scale drops sharply after those two states. New York ranked third at 312.64 thousand MWh, 2.7% of the 51-area sum. Maryland followed at 211.56 thousand MWh, or 1.8%, and Virginia recorded 204.69 thousand MWh, also about 1.8%. Even New York, the third-highest state, had less than one twentieth of Hawaii’s level. The distribution is therefore better described by concentration than by a gradual decline from one state to the next.
The median was 46.59 thousand MWh, far below the mean
The arithmetic mean across the 51 observations was 224.62 thousand MWh, while the median was only 46.59 thousand MWh. The mean was about 4.8 times the median. That gap is a simple indicator of a strongly right-skewed distribution: a small number of very large values lift the average far above the middle observation. For a reader trying to understand what a more typical state-level value looked like, the median is therefore more informative than the mean by itself.
Concentration ratios reinforce that point. Hawaii and Alaska together made up 69.6% of the total. The top five states reached 76.0%, and the top ten reached 83.1%. Only 16 of the 51 areas exceeded 100 thousand MWh, and only five reached at least 200 thousand MWh. The remaining 41 areas together accounted for about 16.9% of the state-level sum.
Top 15 state-level values
The table below ranks the 15 largest observations. The share column uses the sum of all 51 state and District of Columbia values as the denominator. Shares are rounded to one decimal place, so displayed percentages do not necessarily add to exactly 100%.
| Rank | State | Net generation (thousand MWh) | Share of 51-area total |
|---|---|---|---|
| 1 | Hawaii | 7,054.02 | 61.6% |
| 2 | Alaska | 919.32 | 8.0% |
| 3 | New York | 312.64 | 2.7% |
| 4 | Maryland | 211.56 | 1.8% |
| 5 | Virginia | 204.69 | 1.8% |
| 6 | Massachusetts | 176.75 | 1.5% |
| 7 | Texas | 171.46 | 1.5% |
| 8 | Florida | 167.98 | 1.5% |
| 9 | North Carolina | 157.36 | 1.4% |
| 10 | Missouri | 147.52 | 1.3% |
| 11 | Georgia | 144.52 | 1.3% |
| 12 | Ohio | 140.84 | 1.2% |
| 13 | West Virginia | 124.79 | 1.1% |
| 14 | Tennessee | 121.15 | 1.1% |
| 15 | Indiana | 120.02 | 1.0% |
After Hawaii and Alaska, the next tier is much smaller. New York, Maryland, and Virginia were the only additional areas above 200 thousand MWh. Massachusetts, Texas, Florida, and North Carolina were between roughly 157 and 177 thousand MWh. Missouri, Georgia, and Ohio were clustered around 141 to 148 thousand MWh, while West Virginia, Tennessee, and Indiana rounded out the top 15 at a little over 120 thousand MWh each.
Several areas recorded very small but positive values
At the bottom of the distribution, the District of Columbia recorded 0.03476 thousand MWh and Idaho recorded 0.045 thousand MWh. New Mexico was also below 1 thousand MWh at 0.75187. Vermont recorded 3.08 thousand MWh, Nevada 5.69, Rhode Island 8.35, Mississippi 8.56, and Louisiana 9.89. Eight areas were at or below 10 thousand MWh.
These small observations should not be converted to zeros. They are positive values in the source data, and preserving them is important for tables, maps, and distribution analysis. A visualization that groups every very small value with zero would erase real differences between places. The dataset used here does not require filling missing values, and no missing observation has been replaced with zero.
What can be concluded from the distribution
Three conclusions are directly supported. First, petroleum-liquid net generation was highly concentrated in 2024, with the top two states accounting for nearly seven tenths of the 51-area total. Second, the spread between the highest and lowest values was enormous. Hawaii’s recorded generation was more than 200,000 times the District of Columbia value. Third, the distance between the mean and median confirms that the largest observations dominate the aggregate.
Those findings do not explain the causes of the differences. Fuel prices, plant configuration, dispatch decisions, local supply conditions, reliability needs, and overall electricity demand could all matter in principle, but this single series does not test those factors. Likewise, a large petroleum-liquid generation value does not automatically mean petroleum liquids supplied a large share of that state’s total electricity. Answering that question requires the total net generation denominator for the same state and year.
The dataset is also a one-year cross section. It supports a 2024 comparison but not a statement that a state is increasing or decreasing over time. Trend analysis would require the same EIA series across multiple years. Keeping the time scope narrow avoids turning a clear state comparison into an unsupported historical narrative.
Useful benchmarks for reading an individual state
A practical way to read any state value is to compare it with three benchmarks. The first is its share of the 51-area sum, which shows its relative contribution to the national state-level distribution. The second is the median of 46.59 thousand MWh, which gives a better sense of the middle of this skewed distribution. The third is the concentration of the leading states: 69.6% for the top two, 76.0% for the top five, and 83.1% for the top ten.
Texas illustrates why both absolute values and shares are useful. Its 171.46 thousand MWh was well above the median and ranked seventh, yet it represented only about 1.5% of the 51-area total. Florida was close behind at 167.98 thousand MWh, also about 1.5%, and North Carolina recorded 157.36 thousand MWh, about 1.4%. These are substantial state-level observations, but Hawaii’s very large value compresses their percentage shares.
Source and calculation method
The source is the U.S. Energy Information Administration Electricity Electric Power Operational Data annual API. The series uses the generation field with fueltypeid=PEL and sectorid=99 for 2024. Coverage is the 50 states and the District of Columbia, and the unit is thousand megawatthours. The source endpoint is available through the EIA Electric Power Operational Data API.
The total is the simple sum of the 51 published observations. Each state share is its value divided by that sum and multiplied by 100. Rankings use the original unrounded values. The mean and median are calculated from the same 51 observations. No value was imputed, and the calculations do not introduce population, capacity, total-generation, or fuel-consumption denominators that are absent from this series.
2024 in one view
The 2024 state-level pattern is dominated by Hawaii. It supplied 61.6% of the combined petroleum-liquid utility-scale net generation recorded for the 50 states and the District of Columbia, while Alaska added 8.0%. The top ten areas together reached 83.1%. The mean was 224.62 thousand MWh, but the median was only 46.59 thousand MWh, underscoring how strongly a few states shaped the total. The safest interpretation is therefore a distributional one: this EIA series shows where petroleum-liquid net generation was recorded in 2024, not why it occurred or how large petroleum liquids were within each state’s full electricity mix.
Frequently Asked Questions
Which state had the most utility-scale petroleum-liquid net generation in 2024?
Hawaii ranked first with 7,054.02 thousand MWh, equal to 61.6% of the combined values for the 50 states and District of Columbia.
What share did Hawaii and Alaska account for together?
Hawaii accounted for 61.6% and Alaska for 8.0%, for a combined share of 69.6%.
Does this dataset measure petroleum fuel consumption?
No. It measures utility-scale net electricity generation associated with petroleum liquids, not the amount of petroleum fuel consumed or installed capacity.
Can this one-year dataset show a long-term trend?
No. The comparison is a 2024 cross section. A trend analysis would require the same EIA series across multiple years.
Related Articles
Green Map creates custom-edited map images using open geographic data sources such as geoBoundaries, Natural Earth, OpenStreetMap, and government open data. These maps are edited visual materials, not raw data files, and are provided for education, documents, presentations, and graphic reference.