UNESCO Institute for Statistics indicator MOGER.5T8.40522.GPIA is the adjusted gender parity index for the mobile outbound gross enrolment ratio of tertiary students studying in Latin America. All 189 reported countries and territories refer to 2023, so the comparison is not affected by mixed observation years. The measure compares female and male outbound mobility ratios for this destination region rather than describing all international study or overall tertiary participation.
The median GPIA is 1.093 and the simple mean is 1.023. Only 9 of the 189 observations fall within the conventional UNESCO UIS parity band of 0.97–1.03. 75 are below 0.97 and 105 are above 1.03. The broad distribution shows substantial variation across origins, but it should be interpreted as destination-specific gender parity in mobility to Latin America, not as a general higher-education gender ranking.
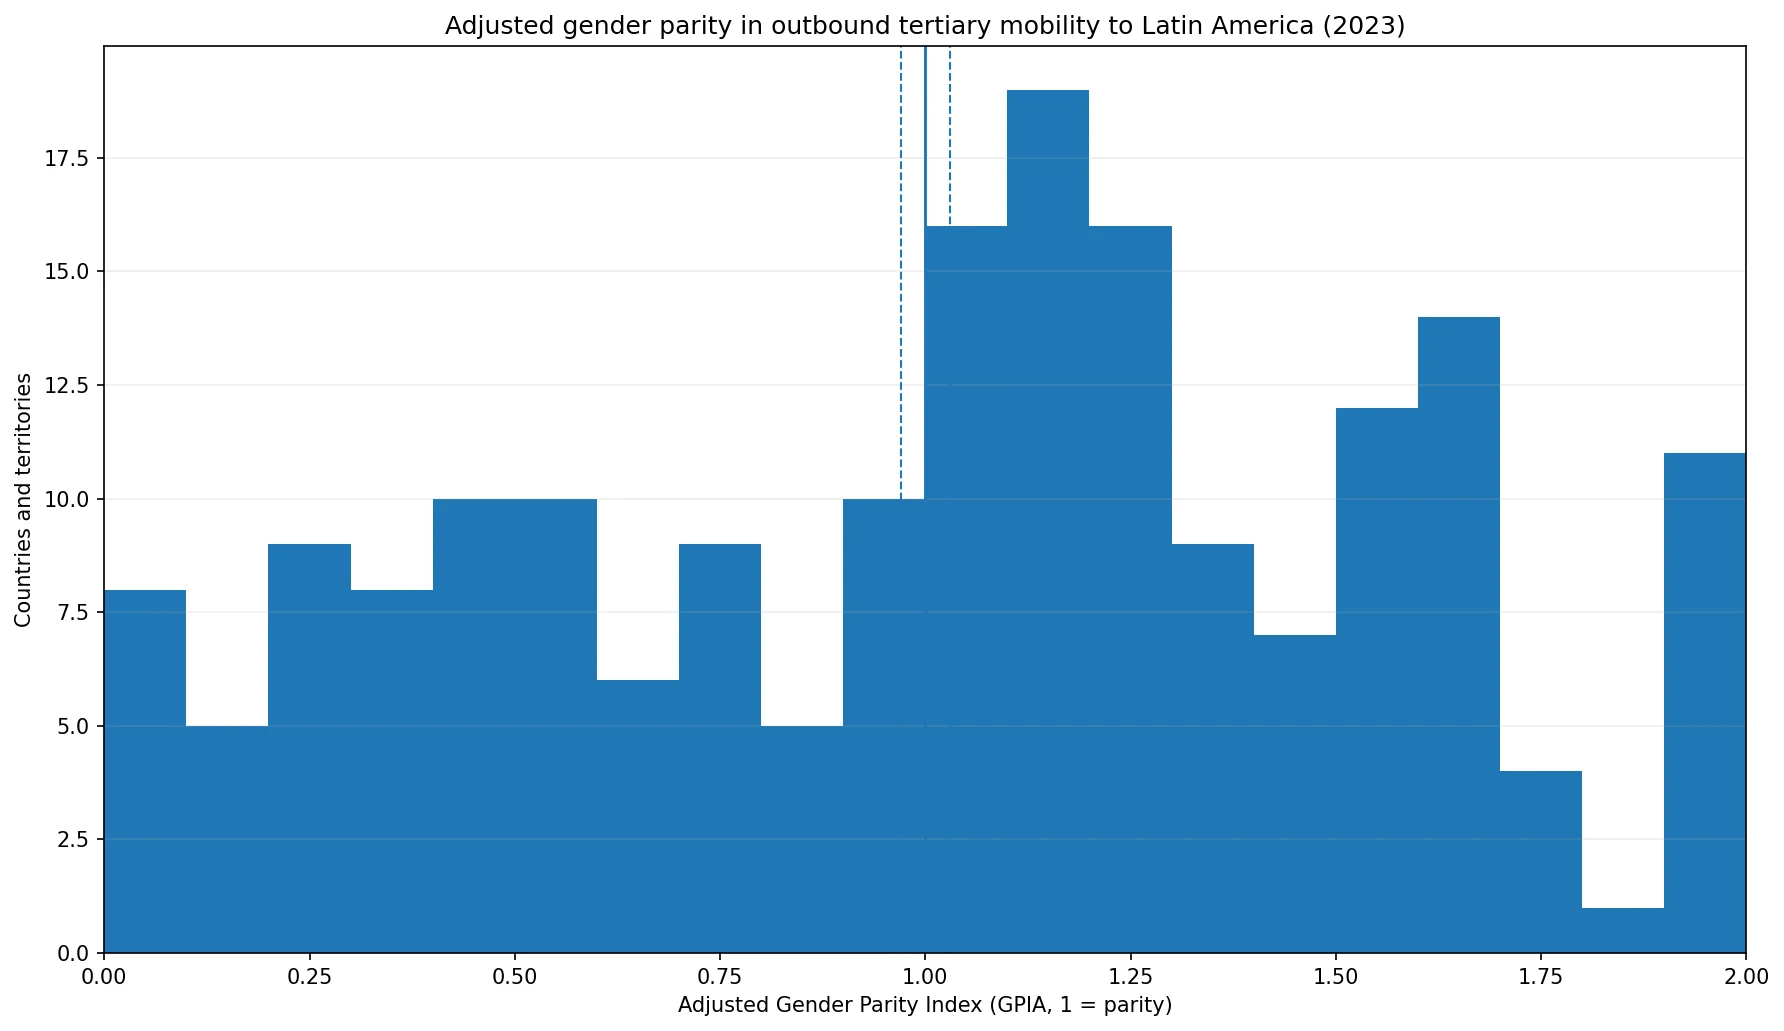
Table of Contents
The indicator is specific to Latin America as the destination
The underlying mobile outbound gross enrolment ratio relates internationally mobile tertiary students from an origin country to the population in the five-year age group immediately following the end of upper secondary education. This series limits the destination to Latin America. GPIA compares the female mobility ratio with the corresponding male ratio for that destination.
That scope matters. A low female-to-male balance for study in Latin America does not mean women from an origin country are less internationally mobile overall. Their mobility may be higher toward other destination regions. Likewise, a value above 1 for Latin America does not demonstrate a general female advantage in higher education. It describes one route within the international student system.
Adjusted GPIA is read on a 0–2 scale centred on 1
The adjusted gender parity index is designed to be symmetrical around parity. When the female indicator value is less than or equal to the male value, the female-to-male ratio is used. When the female value is higher, an inverse-ratio transformation places an equally sized disparity at the same distance above 1. The scale therefore runs from 0 to 2, with 1 representing parity.
Values such as 0.8 and 1.2 are both 0.2 from 1 and indicate differences of the same adjusted magnitude in opposite directions. For a destination-specific mobility indicator, neither side is automatically better. A value close to 1 means female and male outbound ratios to Latin America are similar; values below or above 1 show the direction of the difference.
Nine observations fall inside the 0.97–1.03 parity band
The conventional parity interval contains 9 observations: Rwanda at 0.974, Portugal at 0.991, Kyrgyzstan at 0.993, Vanuatu at 0.993, Austria at 0.997, Sint Maarten at 1.011, Eritrea at 1.012, Liberia at 1.016 and Hong Kong at 1.029. These are the reported origins closest to parity under the standard band.
The middle half of the distribution runs from 0.576 to 1.406, while the median is 1.093. 80 observations are below 1 and 109 are above 1. Female outbound ratios to Latin America are therefore higher than male ratios in more of the reported origins, but that country count is not a student-weighted measure and should not be generalized to all international mobility.
| Country or territory | Year | GPIA |
|---|---|---|
| Rwanda | 2023 | 0.974 |
| Portugal | 2023 | 0.991 |
| Kyrgyzstan | 2023 | 0.993 |
| Vanuatu | 2023 | 0.993 |
| Austria | 2023 | 0.997 |
| Sint Maarten (Dutch part) | 2023 | 1.011 |
| Eritrea | 2023 | 1.012 |
| Liberia | 2023 | 1.016 |
| China, Hong Kong Special Administrative Region | 2023 | 1.029 |
The reported zeros and twos are scale boundaries, not missing values
The official observations include 8 values equal to 0 and 10 equal to 2.0. These are the lower and upper boundaries of the adjusted GPIA scale. They were not created by filling missing countries with zero: the 189 rows used here are reported observations, and the source information records no missing values in this set.
Boundary observations still require caution. Destination-specific student flows can be very small, and an underlying female or male mobility ratio that is zero or close to zero can move the adjusted parity index to a boundary. Because this series does not include the underlying female and male ratios or student counts, it cannot establish why any individual origin has a value of 0 or 2.
Large gaps remain after excluding the boundary values
Among observations strictly between 0 and 2, Bahrain records 1.927, Fiji 1.855, Chad 1.768, Andorra 1.767, Maldives 1.766 and Romania 1.703. These values indicate a substantially higher female than male outbound gross enrolment ratio for tertiary study in Latin America.
At the other end, South Africa records 0.110, South Sudan 0.145, Palestine 0.165, Sudan 0.190, Niger 0.195 and the United Republic of Tanzania 0.201. These indicate a much lower female ratio for the Latin America destination. The magnitude of the social difference cannot be inferred from GPIA alone because the underlying flow sizes are not shown.
| Country or territory | Year | GPIA |
|---|---|---|
| Bahrain | 2023 | 1.927 |
| Fiji | 2023 | 1.855 |
| Chad | 2023 | 1.768 |
| Andorra | 2023 | 1.767 |
| Maldives | 2023 | 1.766 |
| Romania | 2023 | 1.703 |
| South Africa | 2023 | 0.110 |
| South Sudan | 2023 | 0.145 |
| Palestine | 2023 | 0.165 |
| Sudan | 2023 | 0.190 |
| Niger | 2023 | 0.195 |
| United Republic of Tanzania | 2023 | 0.201 |
A median of 1.093 is not a simple percentage advantage
The median of 1.093 is the middle country-level GPIA among the 189 origins. It would be incorrect to translate it into “women study in Latin America 9.3% more than men.” The adjusted index is not always identical to a raw female-to-male ratio because values above parity are transformed to preserve symmetry.
The median also gives every country or territory equal weight, regardless of the number of internationally mobile students. A student-weighted regional or global measure would require the female and male mobility counts and the relevant population denominators. The current statistic is best used to describe the distribution of origin-country parity values.
Destination choice can create a gender pattern that differs from overall mobility
International mobility depends on both the decision to study abroad and the choice of destination. Language, distance, tuition, visa rules, scholarship opportunities, diaspora networks and the availability of particular fields can influence that choice. These factors can affect female and male students differently across origins.
Comparing the same origin countries across destination regions would help identify whether a gender pattern is specific to Latin America. If an origin is far from parity only for this destination, route-specific factors become more plausible. If the same direction appears across many destinations, broader mobility conditions may be involved. This single destination series cannot make that distinction by itself.
Official zeros must remain separate from no data
The eight source-reported zeros have substantive meaning on the GPIA scale and should remain visible in maps and tables. A country with no observation, by contrast, should remain missing. Replacing absent observations with zero would create artificial extreme disparities and materially distort the distribution.
The ten values at 2.0 require the same care. Two is the upper boundary of the adjusted index, not a statement that the female mobility ratio is exactly twice the male ratio. The adjustment compresses ratios above parity into a bounded scale, so boundary values should be described as extreme adjusted differences rather than simple multiples.
What the indicator can and cannot show
The series can show the direction and magnitude of the 2023 gender difference in the mobile outbound gross enrolment ratio for tertiary students studying in Latin America. Because all observations share the same year, it supports a clean cross-country comparison of destination-specific parity and helps identify origins near parity or far from it.
It cannot show actual student counts, the specific destination country within Latin America, field of study, degree level, scholarship status or socioeconomic background. It also cannot explain the cause of the gender gap. Those questions require the underlying female and male mobility ratios, student counts and additional destination-specific evidence.
The clearest finding from the 2023 distribution
The distribution is wide: only 9 observations fall inside 0.97–1.03, while 8 are at 0 and 10 are at 2. The median is 1.093, and there are many origins far from 1 in both directions. The evidence therefore shows substantial cross-country variation in the gender pattern of tertiary mobility to Latin America.
The result should remain tightly scoped. It is not a score of national gender equality, university quality or overall internationalization. For extreme observations, the most useful next step is to inspect the underlying female and male mobility ratios and student counts before drawing broader conclusions.
Source and interpretation limits
The source is UNESCO Institute for Statistics indicator MOGER.5T8.40522.GPIA for 2023. UIS adjusted parity indices are interpreted on a 0–2 scale centred on 1, with 0.97–1.03 commonly used as the parity band. The 189 reported observations are retained as published, including official zeros, and no unreported country is assigned zero.
A stronger follow-up analysis would combine the adjusted index with the underlying female and male mobile outbound gross enrolment ratios and the corresponding student counts. Comparing the same measures across other destination regions would also show whether the observed gender pattern is specific to Latin America or part of a broader mobility structure.
Frequently Asked Questions
What does a GPIA value of 1 mean here?
It means the female and male mobile outbound gross enrolment ratios for tertiary study in Latin America are equal.
Why is 0.97–1.03 used as the parity band?
UNESCO UIS commonly uses this range to allow small variation around exact parity rather than treating every tiny difference as substantive.
Do values of 0 or 2 mean the data are missing?
No. In this 2023 series they are source-reported boundary values and must be kept separate from countries with no observation.
Related Articles
Green Map creates custom-edited map images using open geographic data sources such as geoBoundaries, Natural Earth, OpenStreetMap, and government open data. These maps are edited visual materials, not raw data files, and are provided for education, documents, presentations, and graphic reference.