UNESCO Institute for Statistics indicator ETOIP.2T3.PU.F reports the female percentage of enrolment in public secondary education. The 2024 figures cover 82 countries and territories, all with the same reference year. This makes the comparison a true 2024 cross-section rather than a mixture of recent and older national observations. The denominator is enrolment in public secondary institutions, so the indicator describes the female share within that enrolment. It does not measure the percentage of all female students who attend public schools.
The country-level distribution is concentrated near an even female-male composition. The median is 49.03% and the simple mean is 49.13%. 70 of the 82 reported values fall between 47% and 53%, while 49 fall inside the narrower 48% to 52% band. The central pattern is therefore much more important than the exact rank of countries separated by only a few tenths of a percentage point.
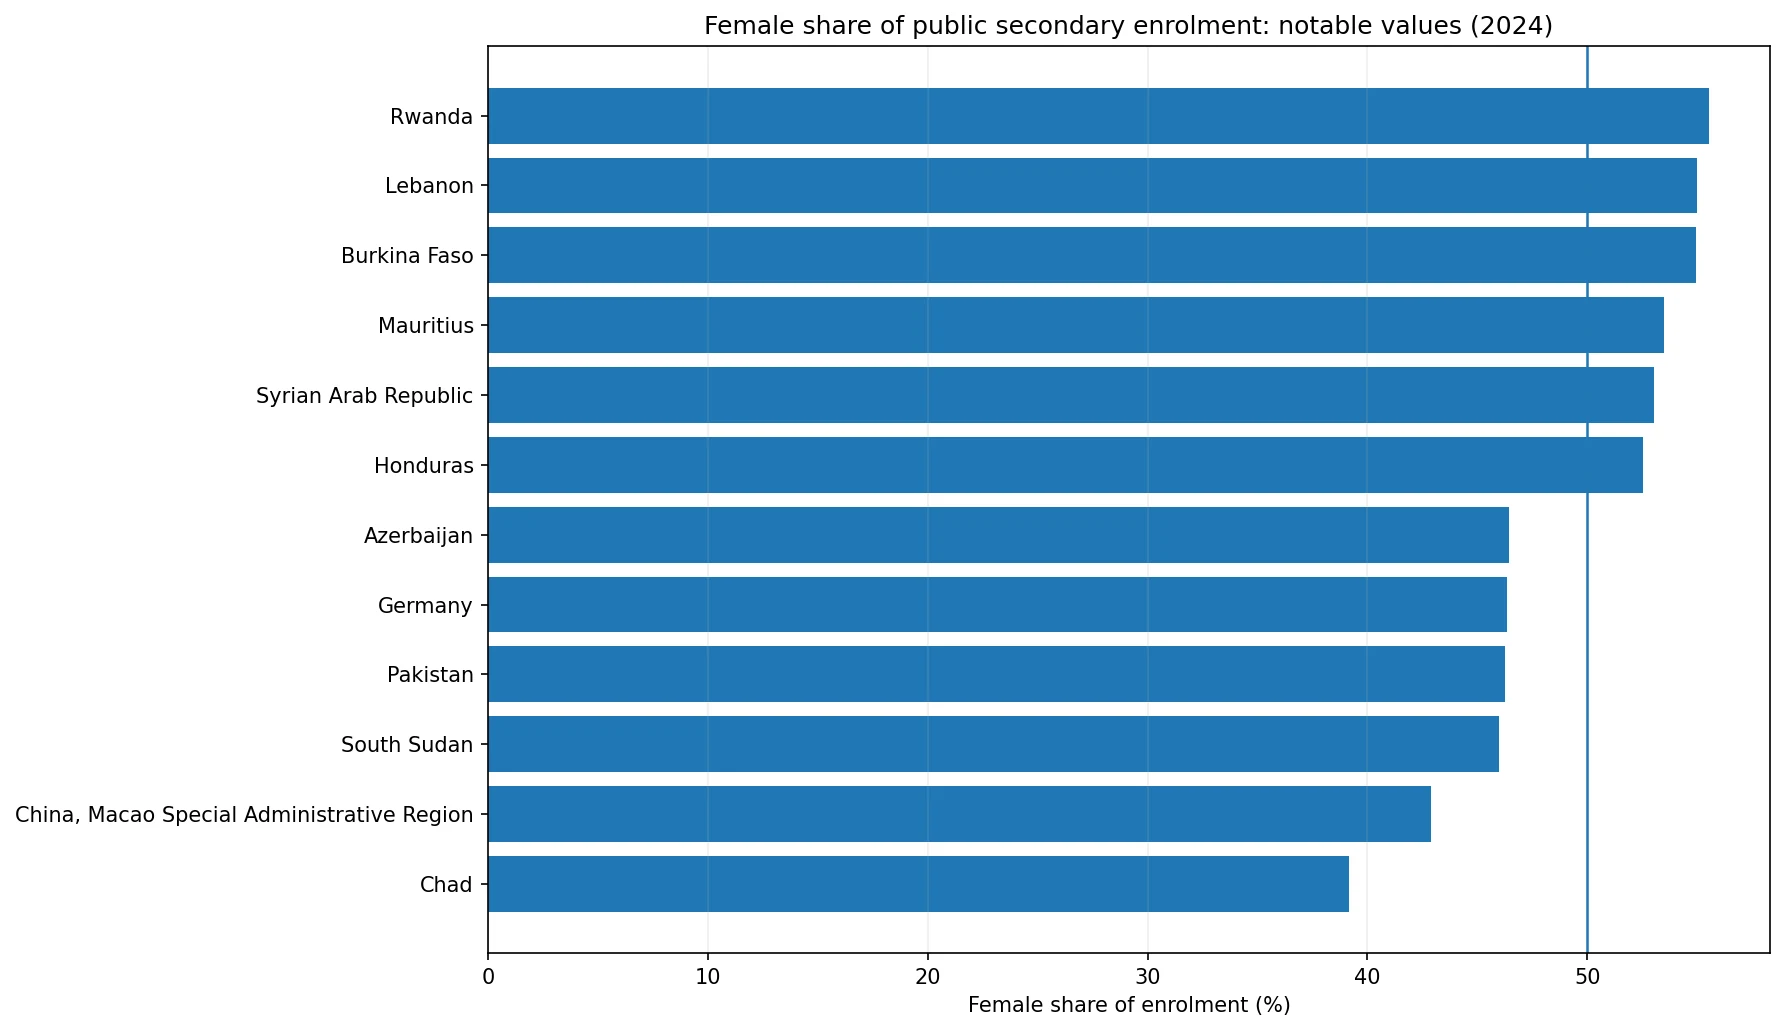
Table of Contents
The denominator determines what the indicator means
A value of 49% means females account for about 49% of students enrolled in public secondary institutions in the country or territory. It should not be restated as “49% of female students attend public schools.” That second statement would require a different denominator: all female secondary students. Keeping the denominator fixed is essential because the two questions describe different aspects of an education system.
The 50% line is a convenient descriptive reference. A value above 50% means females make up the larger share of public secondary enrolment, while a value below 50% means males make up the larger share. However, a value close to 50% is not a complete measure of gender equity. Participation rates, population structure, public-private enrolment patterns and school completion can differ even when the composition inside public institutions looks balanced.
Most reported values sit in a narrow band around 50%
62 of the 82 observations are below 50% and 20 are above it. That count alone can make the distribution appear more male-heavy than it really is, because many of the below-50 observations sit only slightly below the reference line. The middle half of the reported values ranges from 47.84% to 49.95%, showing that country-level differences are usually modest.
Expanding the band to 45% through 55% captures 79 of the 82 observations. In other words, only one reported value lies outside that interval. The mean and median are also close to each other, both slightly below 50%, which reinforces the picture of a dense central distribution rather than a set of sharply divided national patterns.
The highest and lowest values in 2024
Rwanda records the highest female share at 55.53%. Lebanon follows at 55.00%, Burkina Faso at 54.95%, Mauritius at 53.50%, the Syrian Arab Republic at 53.05% and Honduras at 52.55%. These values indicate that females make up the larger share of public secondary enrolment in those systems. Yet most of the upper group is still only a few percentage points away from 50%, so rank position should not be confused with a large substantive gap.
At the lower end, Chad reports 39.14%, followed by Macao at 42.91%, South Sudan at 45.97%, Pakistan at 46.24%, Germany at 46.33% and Azerbaijan at 46.46%. Chad and Macao are notably farther from the central cluster than most other observations. The figures identify unusual compositions, but they do not establish the causes. Explaining those differences requires additional evidence on participation, school ownership, age structure and enrolment patterns.
| Country or territory | Year | Female share |
|---|---|---|
| Rwanda | 2024 | 55.53% |
| Lebanon | 2024 | 55.00% |
| Burkina Faso | 2024 | 54.95% |
| Mauritius | 2024 | 53.50% |
| Syrian Arab Republic | 2024 | 53.05% |
| Honduras | 2024 | 52.55% |
| Chad | 2024 | 39.14% |
| China, Macao Special Administrative Region | 2024 | 42.91% |
| South Sudan | 2024 | 45.97% |
| Pakistan | 2024 | 46.24% |
| Germany | 2024 | 46.33% |
| Azerbaijan | 2024 | 46.46% |
Distance from 50% is more informative than rank
A country at 50.4% and one at 49.6% would appear on opposite sides of a ranking threshold, but their public secondary enrolment is almost equally balanced by sex. A strict ranking can exaggerate tiny differences because many countries are packed into a narrow range. For this indicator, grouping observations by their distance from 50% gives a clearer sense of whether a difference is small, moderate or unusually large.
That does not mean every departure from 50% should be ignored. Rwanda at 55.53% and Chad at 39.14% are clearly farther from the center than most systems in the comparison. They are useful cases for follow-up, especially with national time series. What the 2024 figure alone cannot show is whether the pattern is persistent, temporary, concentrated in particular grades or connected to differences between public and private education.
The indicator does not show how large the public sector is
Two countries can both report a female share of 49% in public secondary education while having very different school systems. In one, public institutions may account for nearly all secondary enrolment; in another, private institutions may serve a large share of students. The current indicator describes the sex composition inside the public sector but does not measure the public sector’s share of total secondary enrolment.
That distinction matters for interpretation. If public schools serve a small segment of students, their gender composition covers only part of the national system. If public schools serve most secondary students, the same composition is more representative of national enrolment. A fuller comparison would therefore pair the female share with total public enrolment and the public-private distribution of secondary students.
A balanced composition is not the same as equal access
A public-school female share near 50% can coexist with low overall secondary participation. It can also coexist with different completion rates for females and males. The indicator says who is enrolled inside public secondary institutions, not how many eligible adolescents enter secondary school, remain enrolled or complete the level. Those are separate questions that require enrolment rates, out-of-school rates and completion measures.
The same caution applies to values below or above 50%. A 47% female share does not by itself prove that females face a specific barrier, just as 53% does not prove that females have better access overall. Population sex ratios, grade repetition, migration, private-school participation and age-specific enrolment can all influence the observed composition. Identifying a mechanism requires evidence beyond a single percentage.
Unusual observations should prompt follow-up, not speculation
Chad’s 39.14% is the clearest low-side exception in the 2024 comparison. Macao is also well below the central cluster at 42.91%. These observations are worth examining with national education statistics and historical values, but the cross-country percentage alone cannot determine whether the gap reflects participation differences, institutional structure, reporting coverage or another factor.
The same principle applies to the higher values. Rwanda, Lebanon and Burkina Faso all exceed 54%, but the current measure cannot tell whether the pattern comes from higher female participation in public schools, lower male participation, different use of private schools or demographic factors. Describing the composition is supported by the evidence; choosing a cause without additional material would go beyond it.
The average of 82 observations is not a world average
The 2024 comparison includes 82 countries and territories rather than every education system. The simple mean of 49.13% therefore describes these 82 country-level observations, not the female share of all public secondary students worldwide. Each country or territory receives equal weight in the calculation regardless of the number of enrolled students.
A global student-level percentage would require counts of female and total public secondary enrolment for each system and an aggregation based on those counts. Countries without a reported 2024 value should also remain unreported rather than being assigned 0%. A missing observation and a true zero have completely different meanings, and substituting one for the other would distort maps, rankings and averages.
What the 2024 comparison supports most clearly
The strongest descriptive finding is concentration near parity. The median is 49.03%, 70 observations fall between 47% and 53%, and 79 fall between 45% and 55%. Rwanda stands out on the high side, while Chad and Macao are farther below the central range. Most other reported systems differ from 50% by only a few percentage points.
These facts support a careful comparison of gender composition within public secondary education. They do not support an overall ranking of education quality, a causal explanation for national differences or a judgment about equal opportunity across the entire secondary-age population. Those broader questions require additional indicators and country-specific context.
Source and interpretation limits
The figures come from the UNESCO Institute for Statistics indicator ETOIP.2T3.PU.F, reported in percent for 2024. Published observations are used directly, and no value is estimated for countries and territories without a reported observation. The indicator should be interpreted as the female share within public secondary enrolment, with its scope kept separate from measures of overall enrolment, attainment or completion.
A time series would provide an important next step because it could show whether the distance from 50% is stable or temporary. Combining the series with the public share of total secondary enrolment, female and male participation rates and completion indicators would also help distinguish changes in composition from broader changes in access and persistence.
Common interpretation mistakes
The first mistake is treating a one- or two-point departure from 50% as a major gender gap. The second is changing the denominator and describing the measure as the share of all female students who attend public schools. The third is assigning 0% to systems without a reported value. The fourth is using one year to claim a specific cause. Avoiding these errors keeps the comparison aligned with what the indicator can actually show.
It is also important to remember that the unweighted country average answers a country-distribution question rather than a global student-distribution question. The 82 reported values are highly useful for identifying the center, spread and unusual cases in 2024, but they should not be transformed into a worldwide student estimate without enrolment counts and appropriate weighting.
Frequently Asked Questions
What does 50% mean in this indicator?
It means females account for about half of students enrolled in public secondary institutions. It does not mean that half of all female students attend public schools.
Is the average of the 82 observations a global average?
No. It is an unweighted average of the countries and territories with reported 2024 observations, not a student-weighted world estimate.
Should countries without a reported value be treated as 0%?
No. Missing observations and true zero values are different and should remain separate.
Related Articles
Green Map creates custom-edited map images using open geographic data sources such as geoBoundaries, Natural Earth, OpenStreetMap, and government open data. These maps are edited visual materials, not raw data files, and are provided for education, documents, presentations, and graphic reference.