Renewable electricity produced by the U.S. independent power producer non-CHP sector was highly concentrated across states in 2025. The 51 state and District of Columbia observations in the EIA dataset sum to about 675.45 TWh. Texas alone recorded 184.44 TWh, or 27.3% of that 51-jurisdiction sum, while California contributed 83.82 TWh, or 12.4%. Together, the two states accounted for 39.7% of the observed total.
The metric is an absolute amount of net generation, not the renewable share of a state’s electricity mix. That distinction changes how the ranking should be read. A low value does not prove that renewables are unimportant in a state, because the state may have a smaller power system or may produce renewable electricity in sectors outside the IPP non-CHP category. A high value means that this particular EIA sector produced a large quantity of renewable electricity; it does not by itself establish a high renewable percentage.
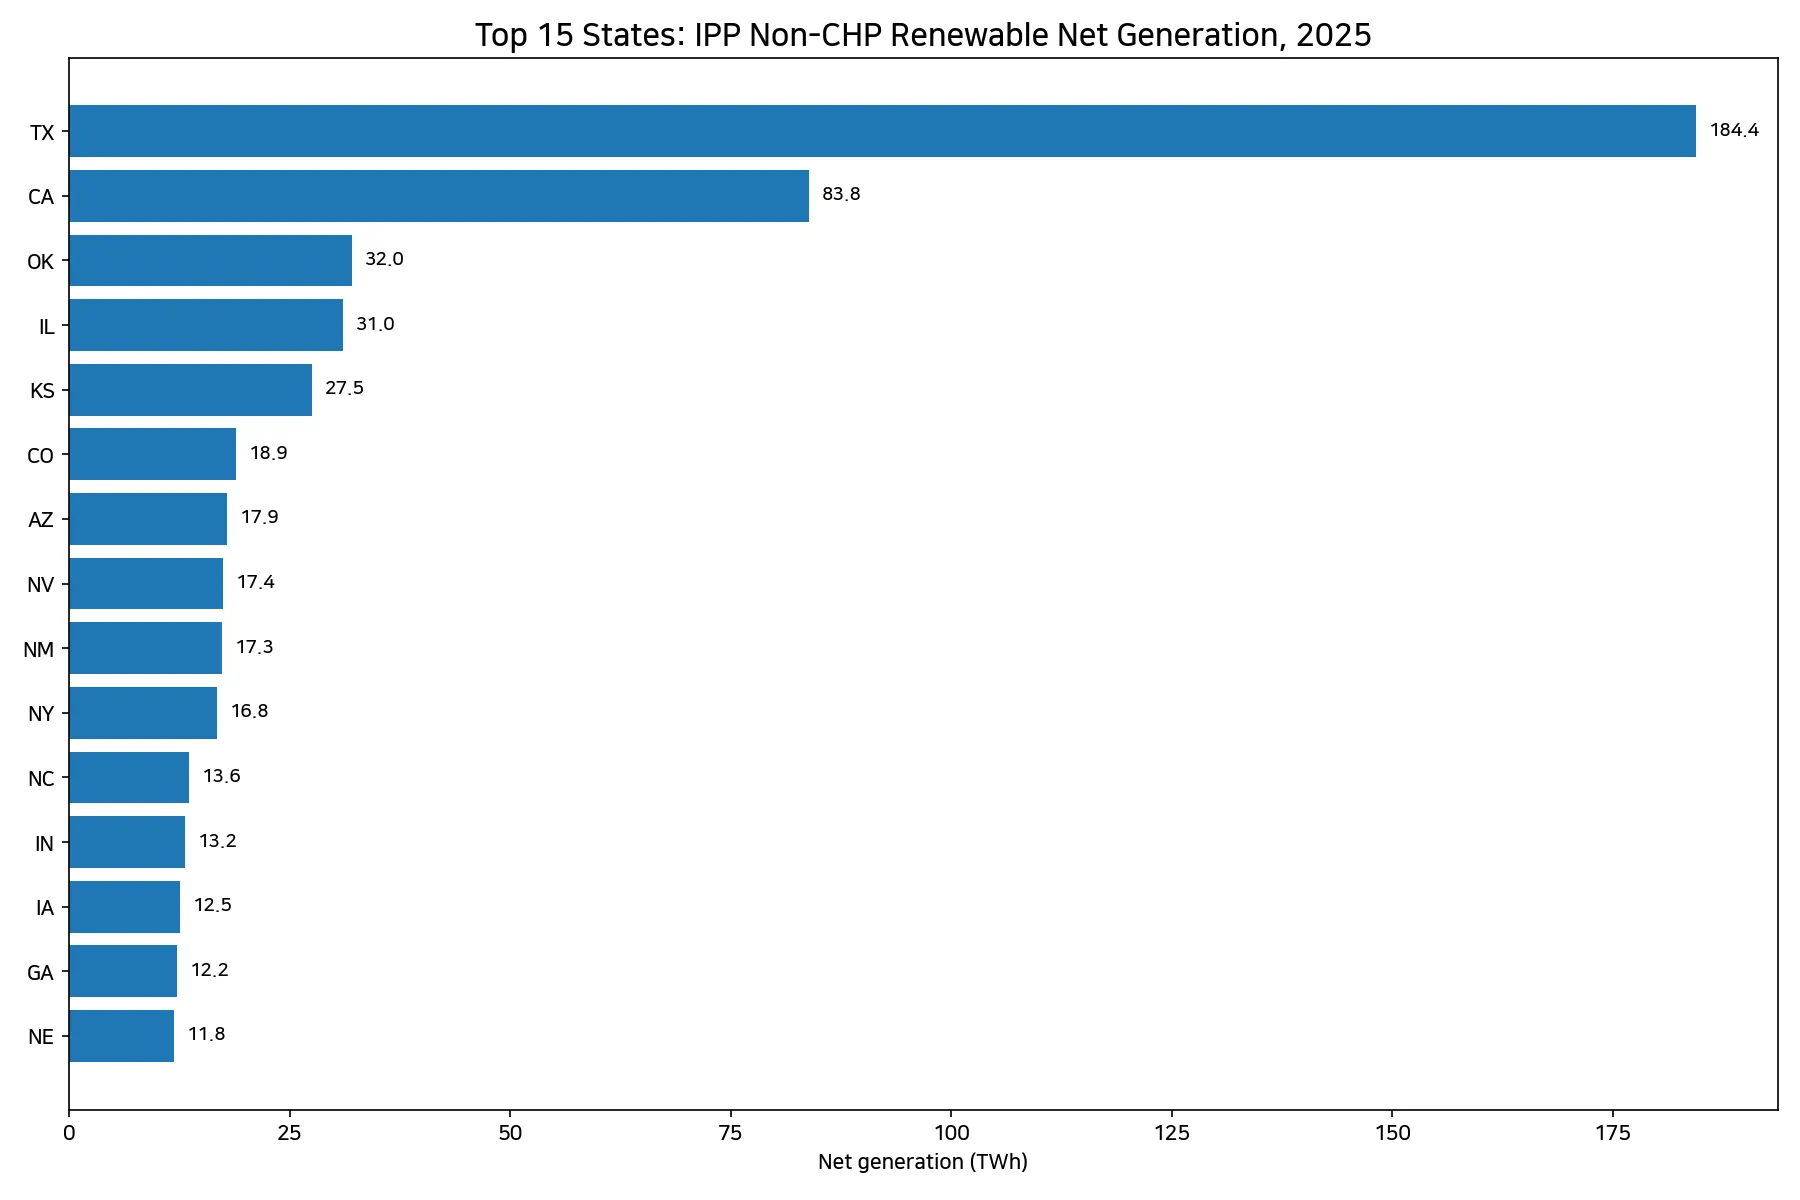
Table of Contents
What the EIA series measures
The source is the U.S. Energy Information Administration electric power operational dataset filtered to annual frequency, the renewable fuel group, and sector 2, IPP Non-CHP. In practical terms, the series isolates renewable net generation from independent power producers whose plants are not reported as combined heat and power facilities. It is therefore narrower than all renewable generation from every ownership and sector category.
The original unit is thousand megawatthours. Dividing by 1,000 converts the values to terawatt-hours, which makes the state totals easier to compare. Texas is 184,439.34 thousand MWh, or 184.44 TWh. California is 83,824.96 thousand MWh, or 83.82 TWh. Oklahoma, the third-largest observation, is 32.03 TWh.
Texas and California dominate the upper end
The gap between the two largest states and the rest of the distribution is substantial. Texas generated about 2.2 times California’s value and nearly six times Oklahoma’s value. Because the top observations are so large, the mean across the 51 jurisdictions is 13.24 TWh, while the median is only 6.57 TWh. That mean-median gap is a clear sign that a small group of very large states pulls the average upward.
The middle half of the observations lies between roughly 2.53 TWh and 12.35 TWh, based on the 25th and 75th percentiles. This range is useful because it describes the center of the distribution without letting Texas and California dominate the summary. A state near 6 to 8 TWh is much closer to the typical jurisdiction in this dataset than the overall mean might suggest.
The top 10 states account for two-thirds of the observed total
After Texas and California, the next tier includes Oklahoma at 32.03 TWh, Illinois at 30.98 TWh, and Kansas at 27.53 TWh. Those five states together represent 53.1% of the 51-jurisdiction sum. Adding Colorado, Arizona, Nevada, New Mexico, and New York raises the top-10 total to 447.02 TWh, or 66.2%. In other words, roughly one-fifth of the jurisdictions account for about two-thirds of the renewable net generation measured in this sector.
| State | Net generation (TWh) | Share of 51-jurisdiction sum |
|---|---|---|
| Texas | 184.44 | 27.3% |
| California | 83.82 | 12.4% |
| Oklahoma | 32.03 | 4.7% |
| Illinois | 30.98 | 4.6% |
| Kansas | 27.53 | 4.1% |
| Colorado | 18.87 | 2.8% |
| Arizona | 17.90 | 2.6% |
| Nevada | 17.43 | 2.6% |
| New Mexico | 17.27 | 2.6% |
| New York | 16.76 | 2.5% |
This concentration should not be treated as a stand-alone explanation of why the states differ. The dataset reports generation outcomes, not causal factors. Power-market size, resource availability, plant ownership, project age, transmission access, capacity factors, and other conditions can all matter, but this single series does not quantify their separate effects. The defensible conclusion is about the distribution of generation, not about which policy or technology caused it.
Most jurisdictions are far below the two leaders
Twenty jurisdictions recorded at least 10 TWh, 29 recorded at least 5 TWh, and 48 were at or above 1 TWh. These thresholds show that meaningful IPP non-CHP renewable generation exists across much of the country, but very large values are relatively uncommon. The median jurisdiction, Utah, is at 6.57 TWh; nearby values include Virginia at 7.02 TWh, Wyoming at 7.42 TWh, Maine at 7.70 TWh, and Michigan at 7.89 TWh.
Looking at the middle of the ranking matters because the headline leaders can make the distribution look more uniform than it is. The difference between a 6 to 8 TWh state and Texas is more than an order of magnitude. Texas alone is about 28 times the median value. That scale gap is central to understanding the dataset.
The smallest values need context
At the lower end, the District of Columbia recorded 0.048 TWh, Alaska 0.063 TWh, and Delaware 0.186 TWh. Rhode Island was at 1.124 TWh, Alabama at 1.283 TWh, and Vermont at 1.352 TWh. These numbers describe the selected EIA sector, not total renewable electricity from every source and ownership category within each jurisdiction.
| State or district | Net generation (TWh) |
|---|---|
| District of Columbia | 0.048 |
| Alaska | 0.063 |
| Delaware | 0.186 |
| Rhode Island | 1.124 |
| Alabama | 1.283 |
| Vermont | 1.352 |
| Wisconsin | 1.464 |
| Kentucky | 1.550 |
The District of Columbia is especially important as a reminder that absolute generation is strongly affected by geography and the physical scale of the power system. Treating an absolute-output ranking as a performance ranking would mix very different questions. The data can show where a large amount of electricity was produced in this sector, but it does not measure efficiency, policy quality, affordability, reliability, or renewable penetration.
Absolute generation is different from renewable share
A state can have a high renewable share of electricity while producing fewer renewable megawatt-hours than a much larger state. Conversely, a large state can rank highly in renewable output even if renewables account for a more modest share of its total generation. To answer the “how much” question, this series is appropriate. To answer the “what percentage of the power mix” question, a share-based series is needed.
The renewable fuel group is also aggregated. The table does not show how much came from wind, solar, hydroelectric, geothermal, biomass, or other renewable sources. Technology-specific conclusions require separate fuel-level data. It would therefore be unsupported to attribute Texas’s lead to one technology, or to infer a state’s resource mix from the total alone.
How to compare the 2025 observations correctly
All 51 rows carry the same observation year, 2025, so there is no mixed-year problem within this dataset. Still, official energy statistics can be revised, and a later EIA retrieval may contain adjusted values for the same annual period. The calculations here use the 51 annual observations supplied for 2025: totals, ranks, percent shares, quartiles, and threshold counts are derived directly from those values.
The official source is the U.S. Energy Information Administration Electricity Data API. Reproducing the comparison requires matching the annual frequency, renewable fuel filter, and IPP non-CHP sector filter. Similar-looking EIA series can represent a different sector, fuel group, or unit, so the filter dimensions matter as much as the year.
What the distribution says most clearly
The strongest finding is concentration. Texas accounts for 27.3% of the 51-jurisdiction sum, California for 12.4%, and the top five states together exceed half of the total. The top 10 reach 66.2%. At the same time, the median is just 6.57 TWh, roughly half the mean. A national discussion based only on the average would therefore miss how sharply the largest states separate from the middle of the distribution.
Used carefully, the series is a useful geographic measure of where IPP non-CHP renewable electricity was produced at scale in 2025. It is less suitable for judging renewable dependence or comparing policy performance. Pairing absolute generation with renewable-share, total-generation, and technology-level data produces a more complete picture and avoids turning one narrow but useful measure into a broader claim than the evidence supports.
Frequently Asked Questions
Which state had the most IPP non-CHP renewable net generation in 2025?
Texas had the largest value in the supplied EIA data at 184.44 TWh, about 27.3% of the 51-jurisdiction sum.
Does this ranking show each state’s renewable electricity share?
No. It ranks an absolute amount of renewable net generation in the IPP non-CHP sector. Renewable share of total generation is a different metric.
What is the total across the 50 states and District of Columbia?
The 51 observations sum to about 675.45 TWh. The top 10 states account for roughly 66.2% of that amount.
Can the data identify which renewable technology caused each state’s result?
No. The renewable fuel group is aggregated in this dataset. Wind, solar, hydro and other technologies require separate fuel-level data.
Related Articles
Green Map creates custom-edited map images using open geographic data sources such as geoBoundaries, Natural Earth, OpenStreetMap, and government open data. These maps are edited visual materials, not raw data files, and are provided for education, documents, presentations, and graphic reference.