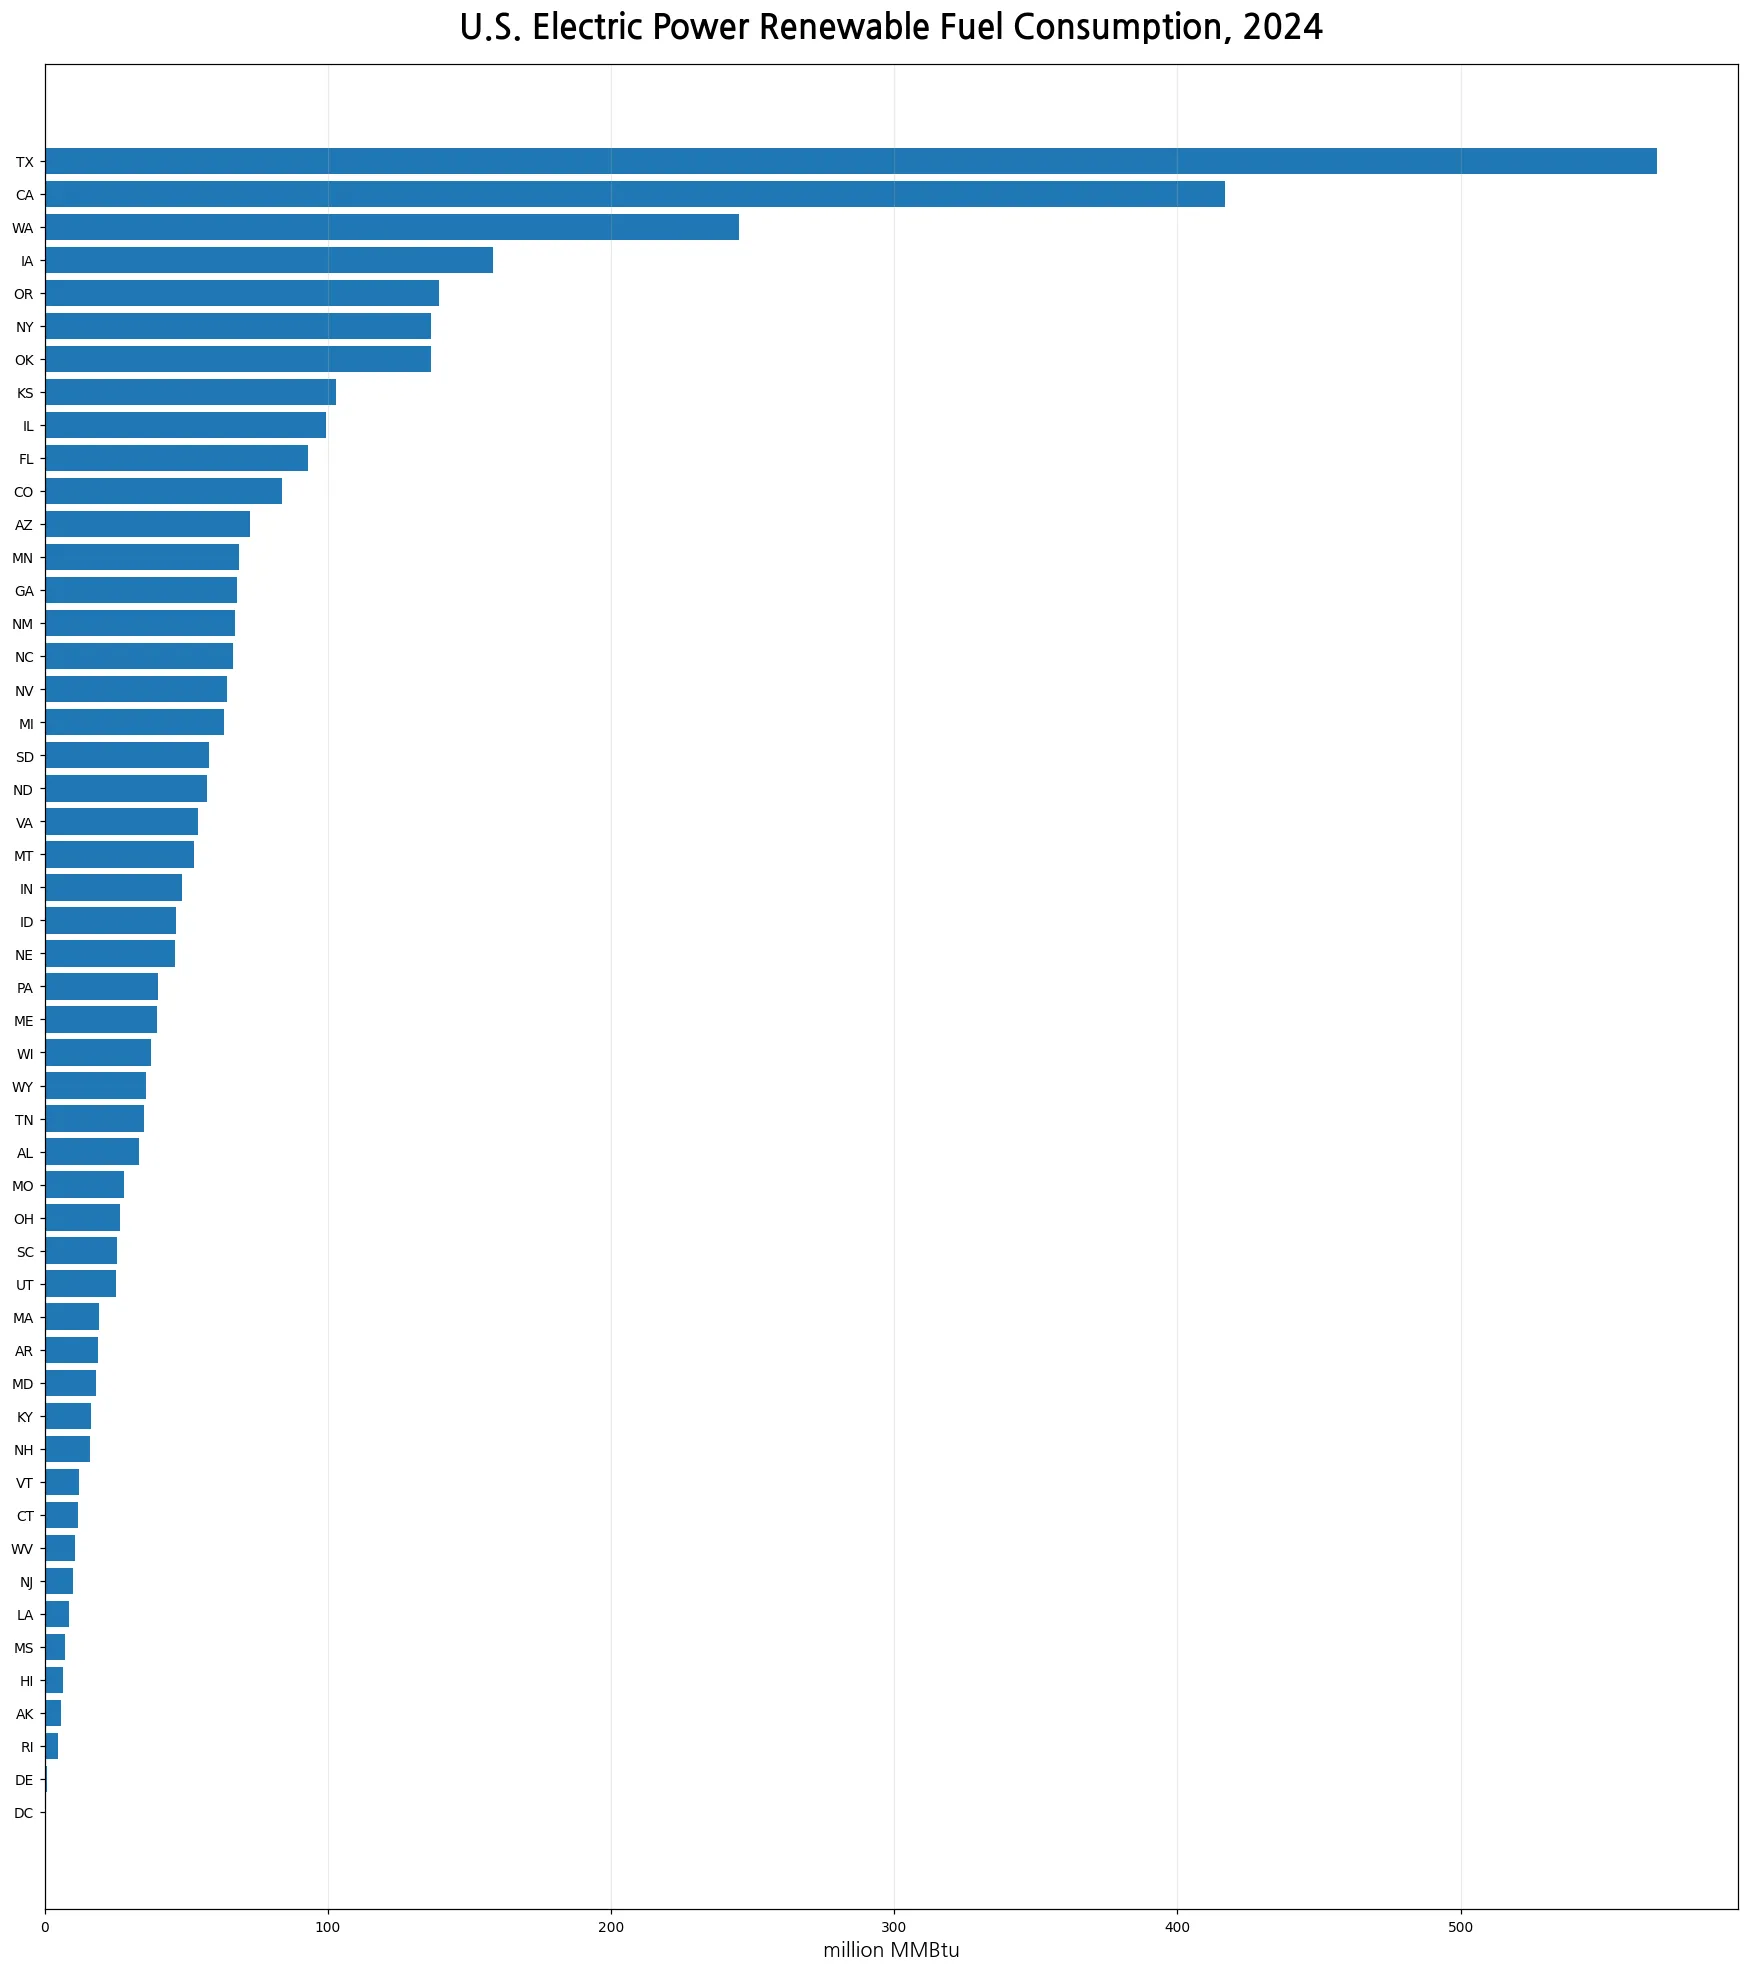
The 2024 U.S. Energy Information Administration state series for renewable fuels consumed for electricity generation shows California at 48,791.380 thousand physical units, the largest observation among the 50 states and the District of Columbia. Michigan follows at 18,622.844, and New York at 16,433.773. All 51 jurisdictions have numeric observations. Their simple sum is 237,631.712, and California accounts for 20.5% of that analytical sum. That percentage describes concentration within this specific EIA series; it is not a claim that California supplied the same percentage of U.S. renewable energy.
The statistical identity is unusually important here. The query fixes fueltypeid=REN, sectorid=99, annual frequency, 2024, and the field consumption-for-eg. EIA labels sector 99 as All Sectors within its electric-power operational dataset, while the unit supplied for this slice is thousand physical units. Those conditions make this series different from renewable net generation in MWh, Btu-normalized fuel input, installed capacity, or a renewable share of total electricity. The article therefore treats the values as the physical-unit series EIA published and does not relabel them as a common energy measure.
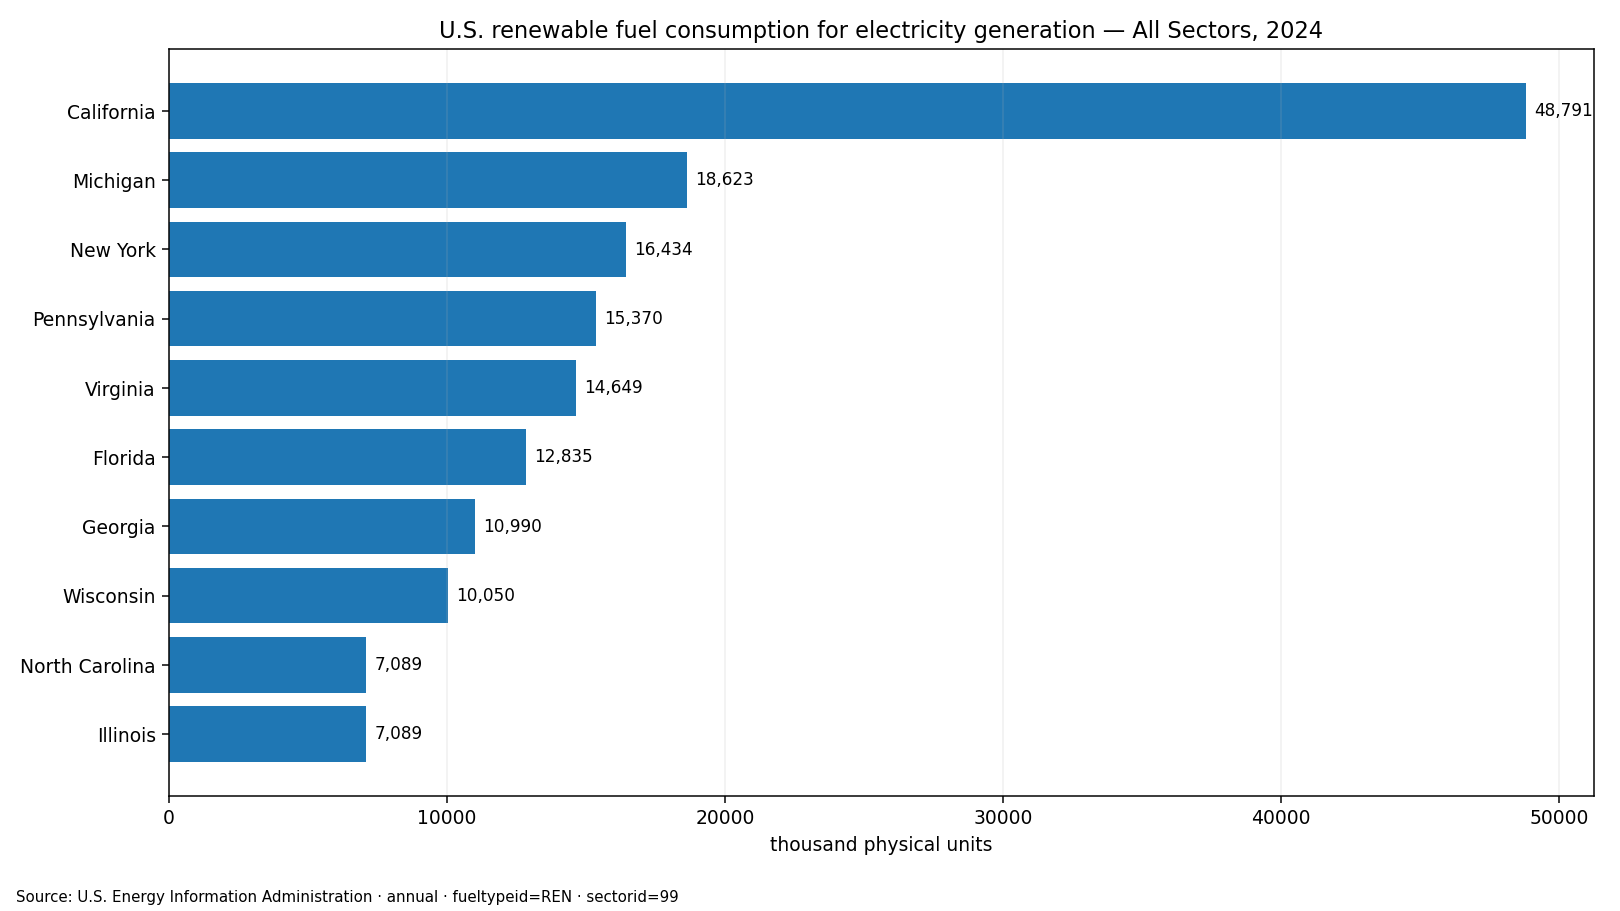
Table of Contents
What All Sectors means in this EIA series
Sector 99 is the All Sectors aggregation inside EIA electric-power operational data. It should be read in the context of that dataset. It does not mean every form of final energy use in the U.S. economy, and it should not be expanded to include unrelated transportation, building, or industrial energy use outside the electricity-production data represented here. The narrow question is how much renewable-fuel physical quantity was reported for electricity generation under EIA’s all-sector producer aggregation in 2024.
This scope also separates the current series from similar-looking EIA slices. A renewable-fuel record for sector 98, sector 90, or an independent-power-producer category can use the same year and fuel facet yet still describe a different producer population. Treating those records as interchangeable would blur a real dataset dimension. Keeping All Sectors visible in the title and source description makes it clear why the state values can differ from another renewable-fuel article even when both mention 2024 and electricity generation.
California contributes 20.5% of the 51-observation sum
California alone represents 20.53% of the simple state-and-D.C. sum. The top three observations—California, Michigan, and New York—reach 35.28%. Adding Pennsylvania and Virginia brings the top five to 47.92%, while the top ten account for 68.14%. Those cumulative shares show a substantial upper-tail concentration, although the other 41 jurisdictions still contribute about 31.86% of the series total.
This is a useful example of why a ranking and a total should be read together. A headline focused only on California can make the distribution look more one-sided than it is, while a national-looking aggregate hides the importance of the leading states. Michigan, New York, Pennsylvania, Virginia, Florida, Georgia, and Wisconsin all have large observations. The top group also spans the West, Midwest, Northeast, and South, so the ranking is not confined to one broad U.S. region. The state totals alone, however, do not identify the fuel mix or facility structure responsible for those values.
| Rank | State | Value (thousand physical units) | Share of 51-value sum |
|---|---|---|---|
| 1 | California | 48,791.380 | 20.53% |
| 2 | Michigan | 18,622.844 | 7.84% |
| 3 | New York | 16,433.773 | 6.92% |
| 4 | Pennsylvania | 15,369.842 | 6.47% |
| 5 | Virginia | 14,648.873 | 6.16% |
| 6 | Florida | 12,835.037 | 5.40% |
| 7 | Georgia | 10,990.468 | 4.63% |
| 8 | Wisconsin | 10,050.289 | 4.23% |
| 9 | North Carolina | 7,088.965 | 2.98% |
| 10 | Illinois | 7,088.649 | 2.98% |
The median is far below the mean
The arithmetic mean is 4,659.445 thousand physical units, whereas the median is only 1,886.382. The first quartile is 989.546 and the third quartile is 4,152.552. The mean is roughly 2.5 times the median because the largest observations pull the average upward. Describing a typical jurisdiction with the mean would therefore overstate the middle of the distribution. For a cross-section with a long upper tail, the median and quartiles give a more grounded picture of where most observations sit.
Eleven jurisdictions are at or above 5,000 thousand physical units, while 13 are below 1,000. This broad spread reinforces the same point: the data are not clustered tightly around one central value. California is an obvious high-end observation, but there is also a substantial middle group. Presenting the mean, median, quartiles, and concentration shares together is more informative than relying on any single summary statistic.
Reported zeros are not missing data
North Dakota and Wyoming are reported at exactly 0.000 in this slice. Those are observed zeros, not empty cells converted to zero. South Dakota is the smallest positive observation at 38.294, followed by West Virginia at 88.507. Alaska and the District of Columbia, by contrast, have positive values of 819.013 and 1,014.206. All 51 rows contain numeric values, so no imputation is required for the state comparison.
A zero should also remain tied to the exact metric. It does not mean that a state had no renewable generation, no renewable capacity, or no renewable-energy activity in 2024. It means the value is zero for this particular combination of REN, sector 99, consumption-for-eg, annual frequency, and the published physical unit. Another EIA field or sector can legitimately show a different result for the same state.
| Lower-ranked jurisdiction | Value (thousand physical units) |
|---|---|
| Oklahoma | 718.105 |
| Mississippi | 673.339 |
| New Mexico | 659.476 |
| Arizona | 594.779 |
| Hawaii | 519.380 |
| Montana | 434.655 |
| West Virginia | 88.507 |
| South Dakota | 38.294 |
| North Dakota | 0.000 |
| Wyoming | 0.000 |
Physical units are not the same as Btu
The published unit is a central limitation, not a formatting detail. A physical-unit fuel series preserves reported quantities rather than converting every fuel to a common energy basis. Renewable fuel categories can contain materials with different physical measures and heat contents. For that reason, the state values can be compared as observations in this EIA series, but they should not automatically be interpreted as equivalent quantities of usable energy.
A Btu-based field is more appropriate when the analytical question is energy input on a common heat-content basis. The same caution applies to the simple 237,631.712 sum used in this article: it is an analytical sum of 51 observations in the published physical-unit series, not a separately published national energy total. The concentration percentages are therefore distribution statistics. They should not be relabeled as state shares of U.S. renewable energy consumption without a properly normalized denominator.
Fuel consumed for generation is not electricity generated
The field consumption-for-eg measures fuel consumed for electricity generation. Electricity output is a different quantity, normally represented by net generation in megawatthours. Fuel input and electrical output are connected, but they are not interchangeable. Fuel heat content, generating technology, plant operating conditions, and efficiency can all affect how an input ranking relates to an output ranking.
Consequently, this table does not answer which state produced the most renewable electricity in 2024. It also does not establish renewable capacity, renewable share of a state’s generation mix, plant efficiency, electricity prices, or emissions reductions. Each of those questions requires its own matching metric. The current data are strongest when used for what they directly contain: a state cross-section of reported renewable-fuel physical quantities consumed for electricity generation across EIA’s All Sectors aggregation.
The leading states form a multi-region pattern
The top ten are California, Michigan, New York, Pennsylvania, Virginia, Florida, Georgia, Wisconsin, North Carolina, and Illinois. That list crosses several census regions and does not support a simple claim that one broad region dominates the ranking. The pattern could reflect differences in renewable fuel composition, plant populations, reporting categories, industrial structure, or other factors, but those causal explanations are not present in the state-level totals themselves.
A causal investigation would need more granular evidence, such as renewable-fuel subtypes, plant-level records, or matched generation and heat-content data. Without those additions, the defensible findings are descriptive: which states have the largest observations, how concentrated the upper tail is, how the median compares with the mean, and which values are zero. Keeping the interpretation at that level avoids turning a one-year cross-section into a story the dataset cannot verify.
What a single 2024 cross-section can and cannot show
Because the file contains only 2024, it cannot establish growth or decline. It does not show whether California rose from 2023, whether the state distribution is becoming more concentrated, or whether renewable fuel use is following a long-term national trend. A valid time-series analysis would need multiple years while holding the API route, field, fuel facet, sector facet, geography, frequency, and unit constant. Changing one of those dimensions can create a different statistical series even when the labels appear similar.
What the cross-section can show is precise and useful. California has the largest observation; the top five make up just under half of the 51-value sum; the top ten account for a little over two-thirds; the mean substantially exceeds the median; and North Dakota and Wyoming are reported at zero. These are direct properties of the 2024 data rather than assumptions about policy or causation.
Source and calculation method
The primary source is the U.S. Energy Information Administration electricity data program, using the electricity/electric-power-operational-data API route. The fixed dimensions are annual 2024, fueltypeid=REN, sectorid=99 (All Sectors), field=consumption-for-eg, state geography, and the EIA-published unit thousand physical units. Coverage is the 50 states plus the District of Columbia.
The sum (237,631.712), mean (4,659.445), median (1,886.382), quartiles, ranks, and cumulative top-state shares were calculated from those 51 observations. No missing value was converted to zero, no other year was substituted, and no values from another sector were combined with this series. The calculation is intentionally descriptive so that the result remains faithful to the unit and dimensions EIA supplied.
Frequently Asked Questions
Which state had the largest 2024 renewable-fuel physical-unit value under All Sectors?
California ranked first at 48,791.380 thousand physical units, followed by Michigan and New York.
Does All Sectors mean all energy use in the U.S. economy?
No. Sector 99 is the All Sectors aggregation within EIA electric-power operational data, not every form of final energy consumption in the economy.
Are thousand physical units the same as Btu or MWh?
No. The physical-unit series is not a Btu-normalized energy measure and it is not electricity generation in MWh.
Are the zero values for North Dakota and Wyoming missing data?
No. Both are reported as 0.000 for this exact 2024 REN, sector 99 and consumption-for-eg slice, and all 51 rows contain numeric observations.
Related Articles
Green Map creates custom-edited map images using open geographic data sources such as geoBoundaries, Natural Earth, OpenStreetMap, and government open data. These maps are edited visual materials, not raw data files, and are provided for education, documents, presentations, and graphic reference.