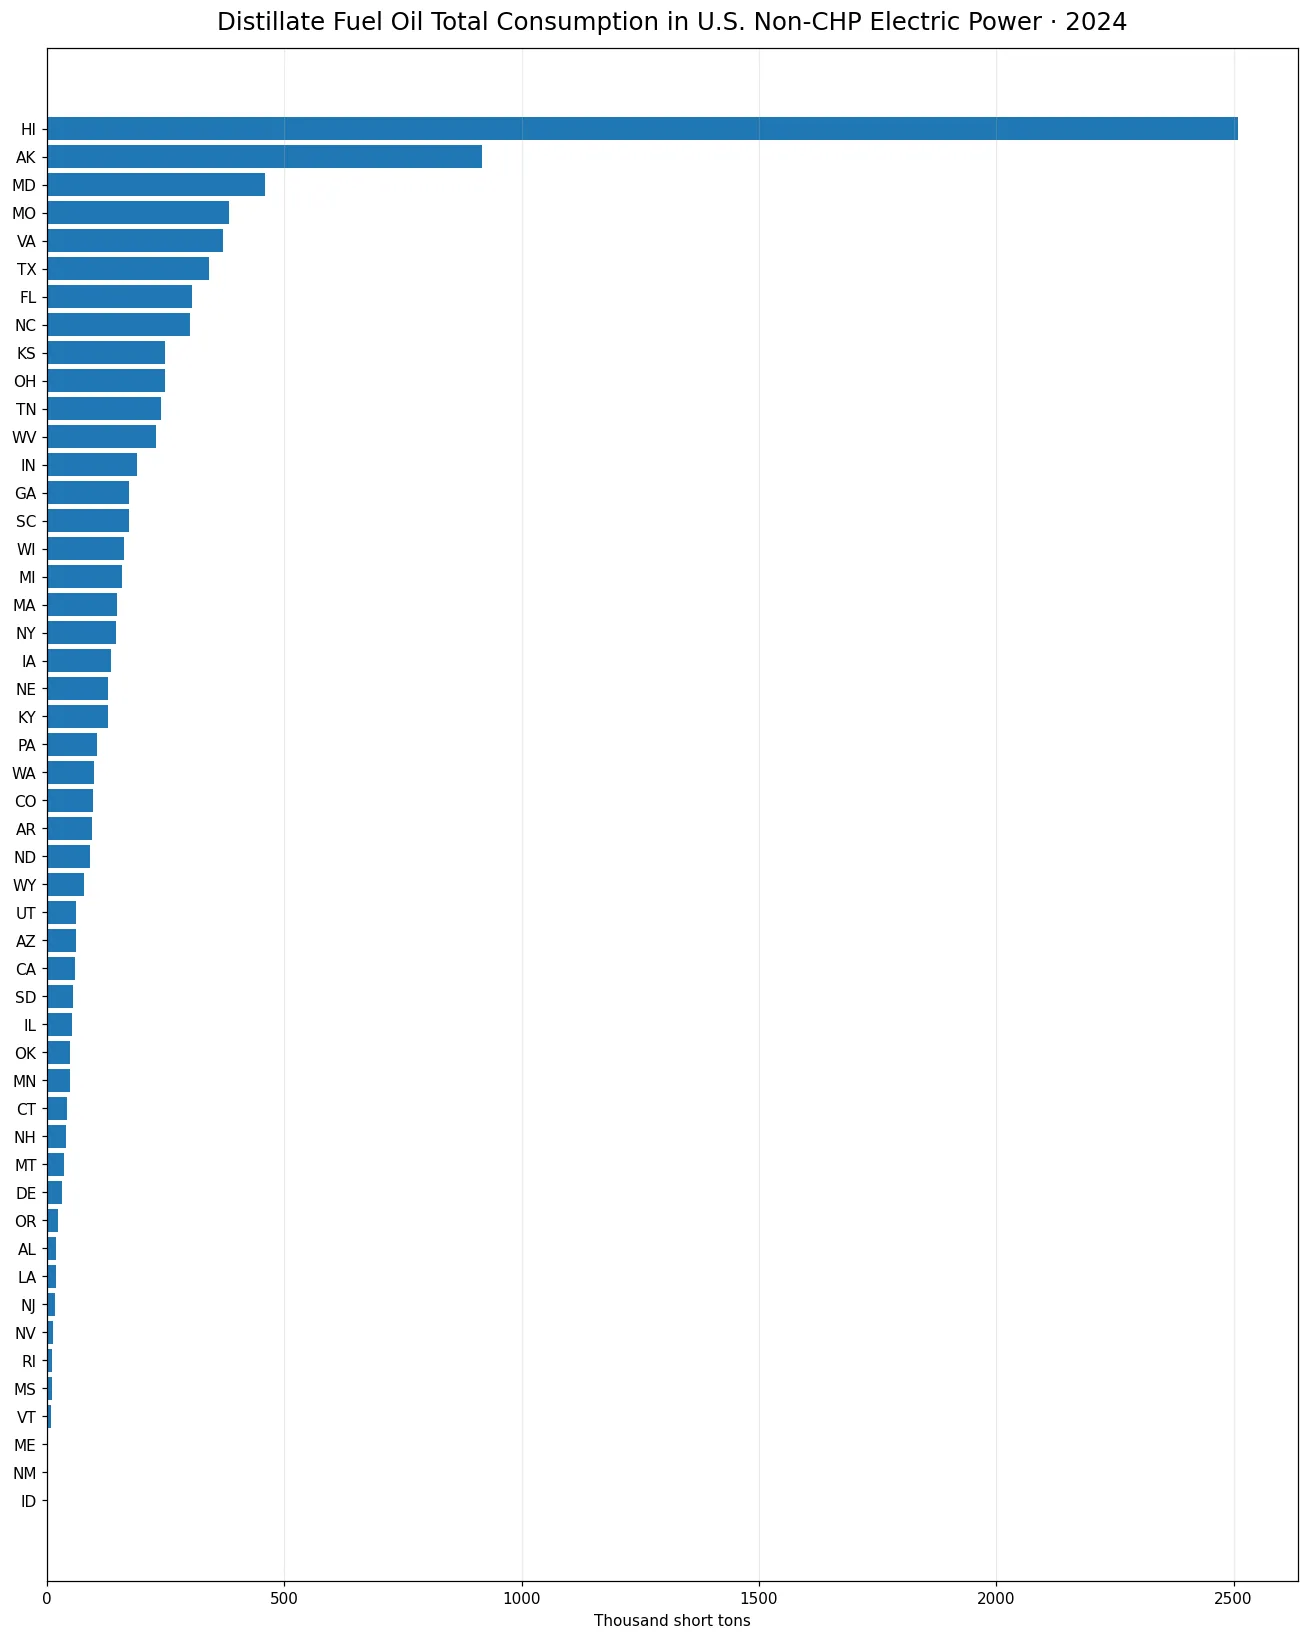
In 2024, U.S. utility-scale net generation from distillate fuel oil totaled 4,757.29 thousand megawatthours across the 50 states and the District of Columbia. Hawaii led by a very large margin at 1,387.91 thousand MWh, followed by Alaska at 520.81. Maryland recorded 206.97, Virginia 199.92, and Texas 168.02. At the other end, Connecticut had an official negative value of -33.34 thousand MWh. Because this is a net-generation series, that negative observation must remain negative rather than being replaced with zero.
The EIA measure uses the `generation` field with fuel type DFO, or distillate fuel oil, for 2024. Its unit is thousand megawatthours. That makes it fundamentally different from fuel-consumption series measured in barrels or million MMBtu. One describes electricity output on a net basis; the others describe fuel input. Similar names should not obscure that distinction.
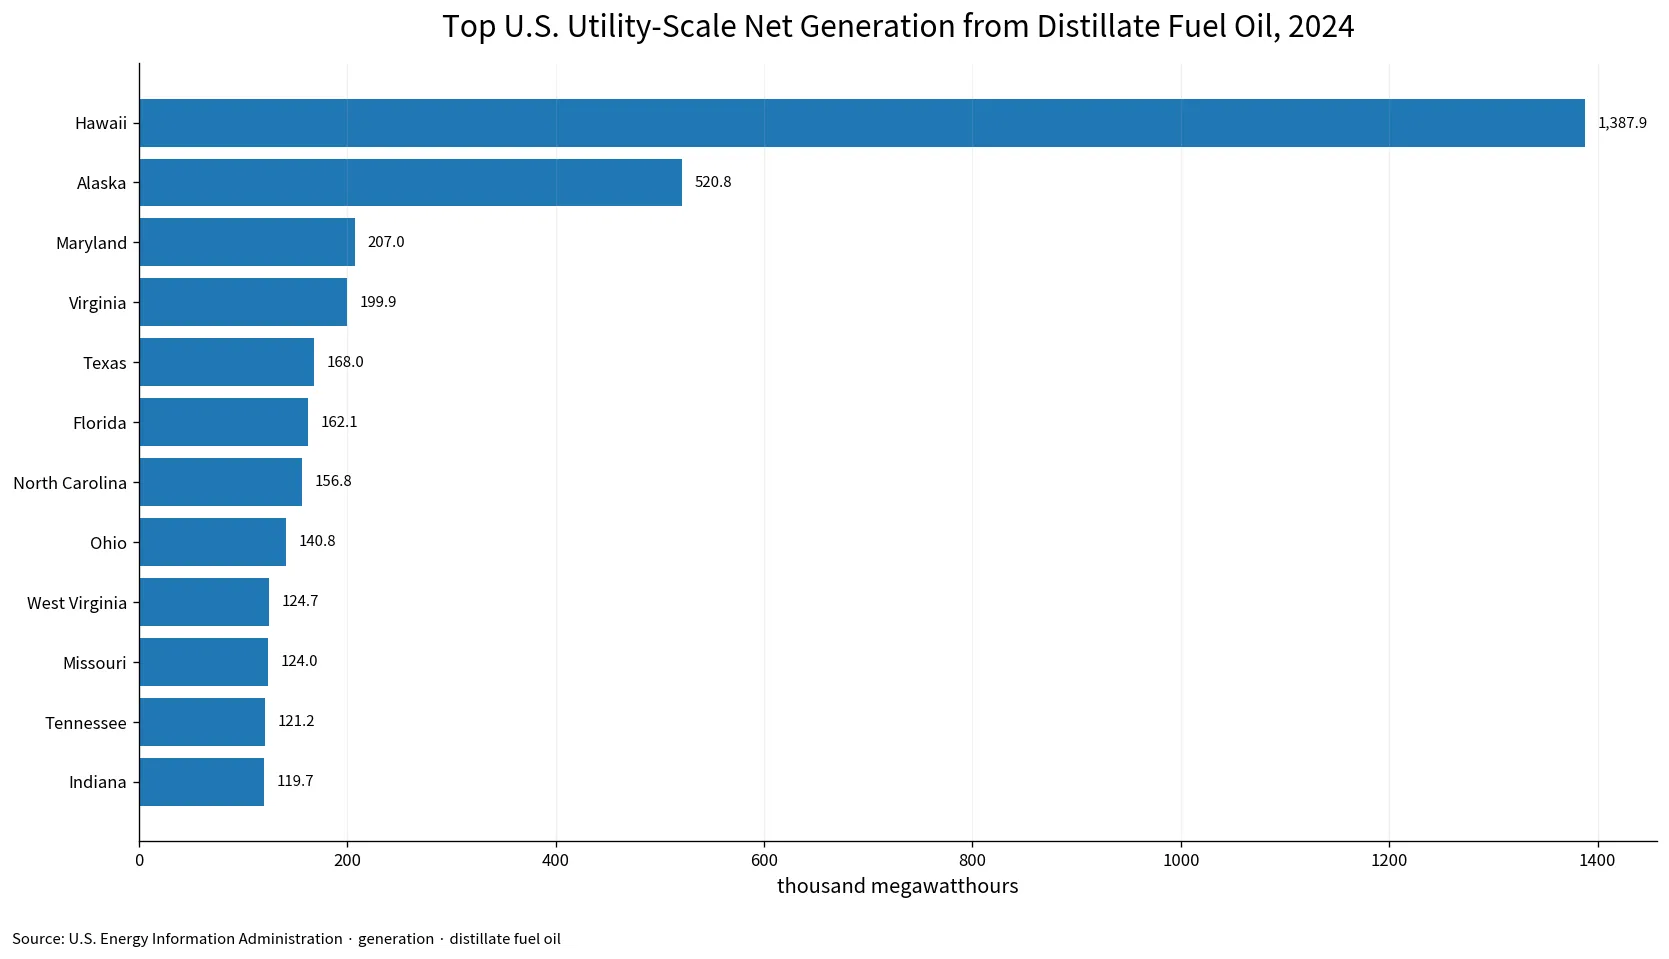
Table of Contents
Hawaii alone accounted for 29.2% of the net total
Hawaii represented 29.2% of the 51-area net total. Adding Alaska raises the top-two share to 40.1%. The top five locations accounted for 52.2% and the top ten for 67.1%. The pattern is therefore highly concentrated, with Hawaii and Alaska contributing an unusually large share before the distribution drops into a lower range.
The mean was 93.28 thousand MWh, compared with a median of 42.08. The first quartile was 14.52 and the third quartile 105.10. The mean being more than twice the median is a direct consequence of the large upper tail. A typical middle-ranked state was much closer to 42 thousand MWh than to the 93 thousand MWh average.
Generation dropped sharply after Hawaii and Alaska
Hawaii’s value was roughly 2.7 times Alaska’s, and Alaska was about 2.5 times Maryland’s. After the two leaders, Maryland, Virginia, Texas, Florida, North Carolina, Ohio, West Virginia, and Missouri form a much lower upper tier. The ranking therefore has clear breaks rather than a smooth decline from one state to the next.
| State or area | 2024 net generation (thousand MWh) | Share of net total |
|---|---|---|
| Hawaii | 1,387.91 | 29.2% |
| Alaska | 520.81 | 10.9% |
| Maryland | 206.97 | 4.4% |
| Virginia | 199.92 | 4.2% |
| Texas | 168.02 | 3.5% |
| Florida | 162.11 | 3.4% |
| North Carolina | 156.79 | 3.3% |
| Ohio | 140.84 | 3.0% |
| West Virginia | 124.69 | 2.6% |
| Missouri | 123.96 | 2.6% |
| Tennessee | 121.15 | 2.5% |
| Indiana | 119.70 | 2.5% |
The percentages in the table use the sum of all 51 official values, including Connecticut’s negative observation. This matters because net generation is not the same as summing only positive output. If the negative value were removed, the denominator would be larger and the leading shares would change slightly. The calculation here stays faithful to the published state-level net series.
Connecticut’s -33.34 is an observed negative net-generation value
There are no zero values in this file, but there is one negative value: Connecticut at -33.34357 thousand MWh. The dataset itself does not provide a detailed causal explanation for that sign. Net-generation accounting can contain adjustments that make a reported aggregate negative, but identifying the specific reason for Connecticut would require more detailed EIA records.
From a data-handling perspective, the rule is clear. A negative value is not missing data, and it should not be converted to zero or to an absolute value. Doing so would change the total, the mean, and the lower end of the distribution. The verified file contains numeric observations for all 51 areas, with 50 positive values and one negative value.
Net generation should not be confused with distillate fuel consumption
A related EIA series measures distillate fuel oil consumed for electricity generation in thousand barrels, and another can express fuel input in million MMBtu. Neither is the same as this thousand-MWh generation series. Fuel input and electricity output are connected physically, but not by a universal one-to-one conversion because plant efficiency and operating conditions differ.
That distinction also prevents misleading efficiency calculations. Comparing a generation value with a consumption value from a different sector scope or fuel definition could produce a ratio that looks precise but has no consistent denominator. This article therefore analyzes the output distribution only and leaves input-output analysis to a matched dataset.
Thirteen areas generated at least 100 thousand MWh
In 2024, 13 state or district observations reached at least 100 thousand MWh, while 3 reached 200 thousand MWh or more. At the lower end, 29 observations were below 50 thousand MWh and 11 were below 10 thousand MWh. These counts show that most areas were far below the two leading values.
These thresholds are descriptive, not official EIA categories. Their purpose is to make the distribution easier to read. One area exceeded 1.3 million MWh, one exceeded half a million, only a small number exceeded 200 thousand, and many remained below 50 thousand. The gaps themselves are more informative than the rank numbers alone.
The data show where generation was high, not why
Hawaii and Alaska being the top two is a factual result of the dataset. The file does not contain plant technology, fuel-delivery arrangements, grid structure, operating constraints, or local demand conditions. Those factors may be relevant to an explanation, but they cannot be inferred reliably from four columns of state, year, and generation data.
The same applies to the cluster of mainland states that follows. Maryland, Virginia, Texas, Florida, and North Carolina all have comparatively high values, but the current series only establishes their output levels. A causal account would need plant-level or fuel-specific operational evidence and, ideally, a longer time series.
A single 2024 snapshot cannot establish a trend
Every row is dated 2024. That makes the cross-state comparison internally consistent, but it cannot show whether a state increased or decreased from the previous year. Hawaii’s 1,387.91 thousand MWh might be part of a stable pattern or an unusual year; this file alone cannot distinguish between those possibilities.
A trend analysis would need the same EIA route, generation field, DFO fuel facet, sector scope, unit, and geography across multiple years. The 2024 snapshot is instead best used to describe concentration, rank, median, quartiles, and the presence of a negative observation.
The District of Columbia is included in the 51 observations
The coverage is 50 states plus the District of Columbia. D.C. reported 0.03476 thousand MWh, a very small positive value. The total, mean, median, and concentration shares in this analysis use all 51 rows to match the official coverage.
The representative image uses a bar chart rather than forcing an administrative map. The key feature of the data is the scale gap between the leaders and the rest, which a bar chart shows directly. It also avoids any risk of dropping a state because of boundary-matching problems.
The net total includes the negative observation
The 51-area net sum is 4,757.29 thousand MWh, and Connecticut’s -33.34 is part of that total. Hawaii’s 29.2% share, the top-two 40.1% share, and the top-five 52.2% share all use this net denominator. Summing positive observations only would answer a different statistical question.
This is an important feature of net-generation data. Analysts should check for negative values before calculating shares or averages instead of assuming all generation observations are nonnegative. Here the structure is simple but consequential: 50 positive observations, one negative observation, and no missing values.
The median gives a better sense of the middle of the distribution
The median of 42.08 thousand MWh is less than half the mean of 93.28. That contrast shows how strongly Hawaii and Alaska, along with several other high states, pull the arithmetic average upward. The middle 50% lies between 14.52 and 105.10, far below Hawaii’s 1,387.91.
For readers comparing states, this means the national average is not a good stand-in for a typical state. A state near 50 thousand MWh is close to the middle of the distribution even though it is far below the mean. Reporting both statistics prevents the upper tail from dominating the interpretation.
Summary: distillate-fuel-oil net generation was heavily concentrated in Hawaii
In 2024, the 51 state and district observations summed to 4,757.29 thousand MWh. Hawaii led at 1,387.91, accounting for 29.2% of the net total. Alaska followed at 520.81, bringing the top-two share to 40.1%. The top five accounted for 52.2% and the top ten for 67.1%. The median was 42.08 thousand MWh, compared with a 93.28 mean.
Connecticut’s -33.34 thousand MWh is an official negative value and remains part of the net total. The metric is electricity net generation, not distillate fuel consumption. Keeping those two points clear makes the 2024 state comparison much more accurate and prevents the series from being mixed with nearby EIA fuel-input indicators.
Frequently Asked Questions
Which area had the highest distillate-fuel-oil net generation in 2024?
Hawaii led at 1,387.91 thousand MWh, about 29.2% of the net total across the 51 reported areas.
Should Connecticut’s negative generation value be changed to zero?
No. The -33.34 thousand MWh figure is an official net-generation observation and should remain negative.
Is this the same as distillate fuel oil consumed for electricity generation?
No. This series measures net electricity generation in thousand MWh, while fuel-consumption series use input units such as barrels or MMBtu.
Related Articles
Green Map creates custom-edited map images using open geographic data sources such as geoBoundaries, Natural Earth, OpenStreetMap, and government open data. These maps are edited visual materials, not raw data files, and are provided for education, documents, presentations, and graphic reference.