In 2024, energy input from distillate fuel oil used for electricity generation varied widely across the 50 U.S. states. Hawaii recorded 14.48972 million MMBtu, followed by Alaska at 5.06992 and Maryland at 2.77063 million MMBtu. Hawaii alone represented about 26.9% of the 50-state total, while the top three states accounted for 41.5%. The distribution is therefore defined less by small rank differences than by a strong concentration of distillate-fuel energy input in a limited number of states.
The measure comes from the U.S. Energy Information Administration annual Electric Power operational data. It uses the `consumption-for-eg-btu` field, the distillate fuel oil fuel type, and the Electric Power sector. The unit is million MMBtu. This is not a barrel count and it is not electricity generation. It expresses the heat-energy content of distillate fuel oil actually consumed for electricity generation, which makes it a different question from a physical-units series measured in barrels.
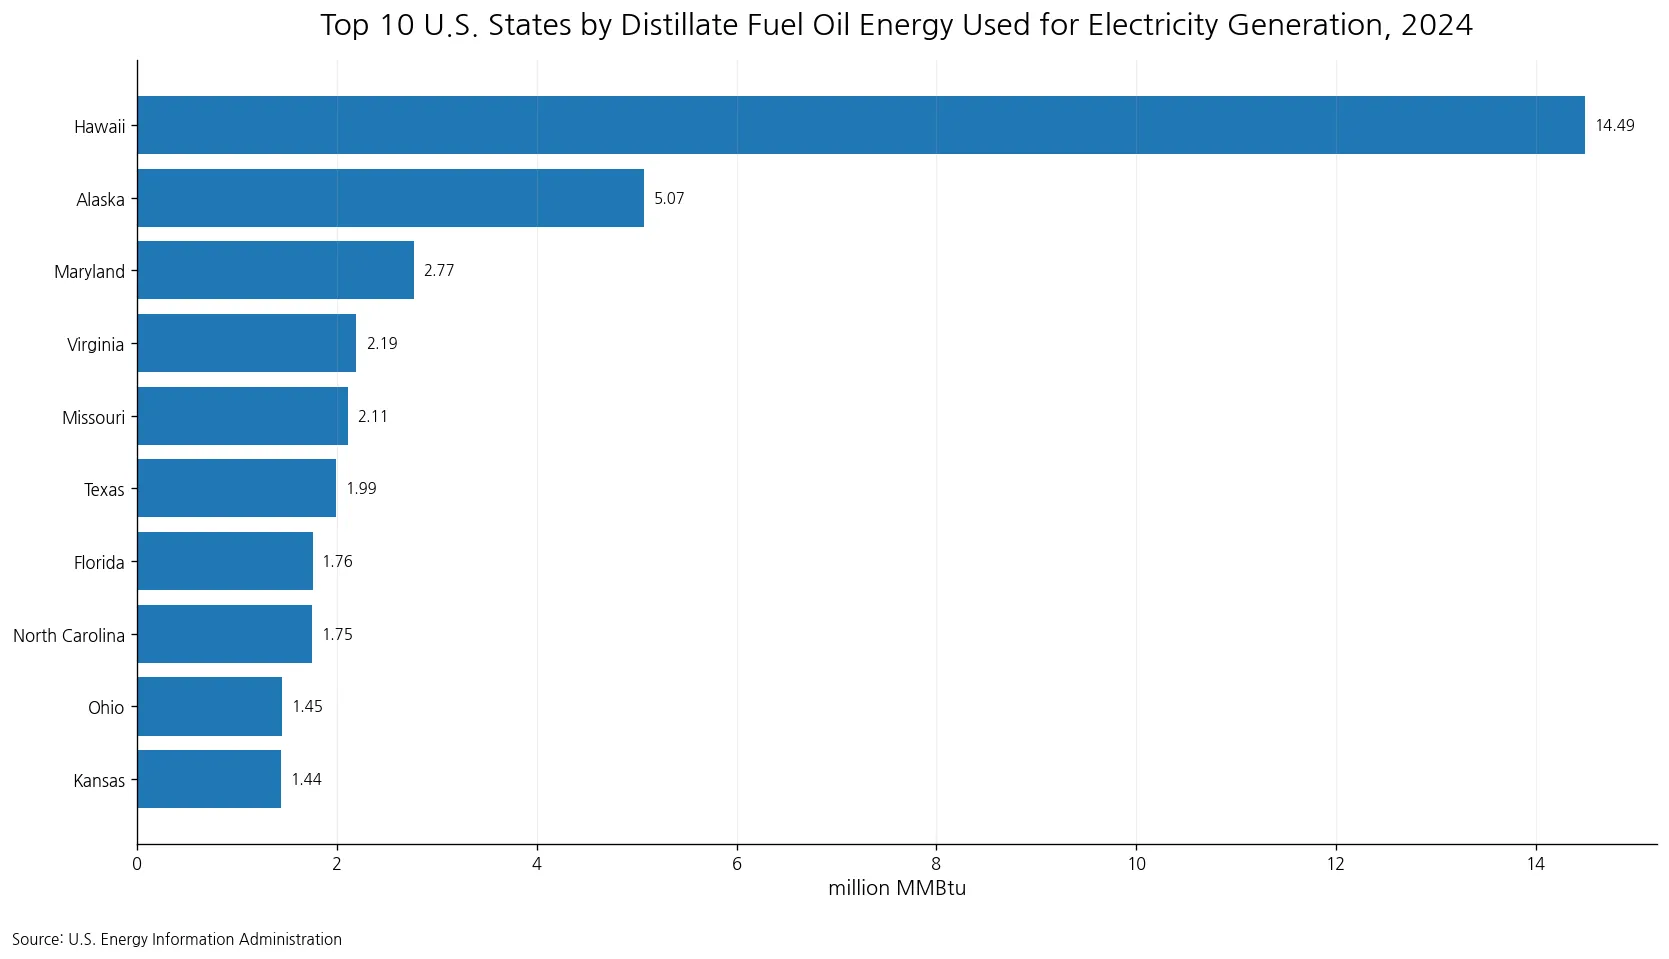
Table of Contents
Hawaii accounted for 26.9% of the 50-state total
The 50 observations sum to 53.81186 million MMBtu. Hawaii contributed 26.9%, Alaska 9.4%, and Maryland 5.1%. The top five states together represented 49.5% of the total, and the top ten represented 65.1%. Nearly two thirds of all measured distillate-fuel energy input was therefore concentrated in only one fifth of the states.
Hawaii was not just narrowly ahead. Its value was about 26.6 times the median of 0.54497 million MMBtu. The gap between Hawaii and Alaska was 9.41980 million MMBtu, while the gap between Alaska and Maryland was 2.29929. Looking at these distances prevents a ranked list from hiding how exceptional the leading observation really is.
The top ten states show several distinct levels
The top ten states were Hawaii, Alaska, Maryland, Virginia, Missouri, Texas, Florida, North Carolina, Ohio, and Kansas. The first five exceeded 2 million MMBtu, while fifteen states exceeded 1 million MMBtu. The ranking does not fall in evenly spaced steps: Hawaii stands far above the rest, Alaska forms a second high point, and a broader group of states sits in the roughly 1 to 3 million MMBtu range.
| State | 2024 distillate fuel oil consumption for electricity generation (million MMBtu) |
|---|---|
| Hawaii | 14.48972 |
| Alaska | 5.06992 |
| Maryland | 2.77063 |
| Virginia | 2.19411 |
| Missouri | 2.10611 |
| Texas | 1.99310 |
| Florida | 1.75594 |
| North Carolina | 1.75284 |
| Ohio | 1.45490 |
| Kansas | 1.43720 |
Texas ranked sixth with 1.99310 million MMBtu, followed by Florida at 1.75594 and North Carolina at 1.75284. Ohio and Kansas completed the top ten with 1.45490 and 1.43720. These values are useful because ranking positions alone can exaggerate small differences or conceal large ones.
The mean was 1.076 million MMBtu, but the median was 0.545
The 50-state mean was 1.07624 million MMBtu, compared with a median of 0.54497. The mean was about 1.97 times the median because a small number of large values pulled the average upward. The first quartile was 0.21915 and the third quartile was 1.07192 million MMBtu, placing the middle half of states roughly inside that interval.
For a right-skewed distribution like this one, the median is often a better description of a typical position than the mean. The mean still matters because it reflects the overall scale of the total, but it should not be interpreted as the amount used by a representative state. Reading the mean, median, quartiles, and concentration shares together gives a fuller view of the state distribution.
The bottom ten states contributed only about 1.1%
The bottom ten states together used 0.61740 million MMBtu, or about 1.1% of the total. Idaho recorded the smallest value at 0.00049 million MMBtu, followed by New Mexico at 0.01135 and Maine at 0.01170. Even combined, the bottom ten amounted to only about 4.3% of Hawaii’s value.
| State | 2024 distillate fuel oil consumption for electricity generation (million MMBtu) |
|---|---|
| Oregon | 0.13637 |
| Alabama | 0.11143 |
| Louisiana | 0.10674 |
| Nevada | 0.07323 |
| Rhode Island | 0.05803 |
| Mississippi | 0.05589 |
| Vermont | 0.05217 |
| Maine | 0.01170 |
| New Mexico | 0.01135 |
| Idaho | 0.00049 |
A low value does not mean that a state had low electricity demand or little generating activity. The series isolates one fuel input: distillate fuel oil used for electricity generation. A state may generate large amounts of electricity from natural gas, coal, nuclear, hydro, wind, solar, or other sources and still appear near the bottom of this indicator. The lower end should therefore be read as low distillate-fuel energy input, not low electricity use.
Barrels and million MMBtu answer different questions
Distillate fuel oil consumption can be represented in physical volume or in energy terms. A barrel-based series tells how much fuel volume was consumed. The million-MMBtu series tells how much heat energy was contained in the fuel consumed. The two measures are related, but they are not identical because the average heat content of distillate fuel oil can vary somewhat across states and observations.
This distinction also explains why a separate EIA average-heat-content series is useful. Average heat content describes energy per unit of fuel, while this series describes total energy input from the fuel actually consumed. A state can use a similar physical amount of fuel as another state but register a somewhat different energy total if the heat-content assumptions differ. Keeping volume, heat content, and total energy input separate avoids false equivalence.
This is fuel energy input, not electricity output
MMBtu is a thermal-energy unit, not an electricity-generation unit. Electricity output is typically reported in megawatthours. Converting fuel energy input into electricity output requires information about generating efficiency and operating conditions. The same thermal input can produce different amounts of electricity at different plants, so the ranking cannot be relabeled as a ranking of electricity generation.
The precise question answered here is where the Electric Power sector consumed the greatest heat-energy quantity of distillate fuel oil for electricity generation in 2024. To examine efficiency, an analyst would need corresponding generation data and could then study measures such as heat rate. This dataset alone does not show whether a state converted the fuel efficiently or inefficiently.
The geographic coverage is exactly 50 states
The verified data contain 50 state observations and do not include the District of Columbia. That coverage detail matters when comparing totals or averages with another EIA article that may include D.C. A difference in geographic denominator can change the sum, mean, and concentration shares even when the year and fuel type look similar.
For an exact match, six elements should remain fixed: 2024 as the year, distillate fuel oil as the fuel, Electric Power as the sector, `consumption-for-eg-btu` as the measure, million MMBtu as the unit, and the 50 U.S. states as the geography. Changing any of those dimensions creates a related but different series. The title alone is not enough to establish that two EIA tables are the same metric.
A one-year snapshot describes structure, not trend
The comparison is a 2024 cross-section. It establishes that Hawaii had the highest value and that the top ten states accounted for 65.1% of the total, but it does not tell whether those shares increased or decreased from 2023. Claims about long-term decline, rising dependence, or structural change require multiple years of the same EIA series.
The single-year snapshot is still valuable because it provides a clean baseline. It identifies the extreme observations, quantifies concentration, and shows the distance between the center and the upper tail. If additional years are later connected, the same calculations can be repeated to track state changes, the top-ten share, the Hawaii-Alaska gap, and shifts in the median.
The data show where energy input was high, not why
Hawaii and Alaska clearly have high values in this series, but the series itself does not identify the causes. Generation mix, plant operation, fuel logistics, grid structure, peak use, emergency generation, or other factors may matter, yet each explanation requires additional evidence. A sound reading separates the observed level from hypotheses about the mechanisms behind it.
High distillate-fuel energy input also does not automatically mean that distillate fuel oil had the highest share of a state’s total power mix. A share requires a denominator such as total generation or total fuel energy input. Without that denominator, this article should be read as an absolute-energy comparison rather than a dependence measure.
Conclusion: distillate-fuel energy input was highly concentrated in 2024
Across the 50 states, 2024 distillate fuel oil energy used for electricity generation totaled 53.81186 million MMBtu. Hawaii led with 14.48972 million MMBtu, or 26.9% of the total. The top three states represented 41.5%, the top ten 65.1%, and the bottom ten only 1.1%. The contrast between the mean of 1.07624 and the median of 0.54497 reinforces the same concentration pattern.
The main interpretation rule is to keep the metric identity intact. This is thermal energy input from distillate fuel oil used for electricity generation. It is not barrel volume, electricity output, efficiency, or fuel share. With that distinction in place, the 2024 state comparison offers a clear view of where this specific fuel-energy input was concentrated.
Frequently Asked Questions
Which state used the most distillate fuel oil energy for electricity generation in 2024?
Hawaii recorded 14.48972 million MMBtu, about 26.9% of the 50-state total.
Is million MMBtu the same as barrels of fuel consumed?
No. Barrels measure physical volume, while million MMBtu measures the heat-energy content of the fuel consumed.
Can this indicator be used to compare generating efficiency?
Not by itself. Efficiency analysis also requires corresponding electricity generation or related output data.
Related Articles
Green Map creates custom-edited map images using open geographic data sources such as geoBoundaries, Natural Earth, OpenStreetMap, and government open data. These maps are edited visual materials, not raw data files, and are provided for education, documents, presentations, and graphic reference.