UNESCO Institute for Statistics (UIS) reports a 2023 adjusted gender parity index (GPIA) for the number of internationally mobile tertiary students studying abroad from 210 countries and territories. The indicator answers a narrower question than a general student-mobility ranking: within each origin country, how does the female value compare with the male value for students studying in another country? It does not measure the total size of the outbound population, and it is not the same series as the outbound mobility ratio.
The distribution is unusually discrete. Of the 210 reported observations, 174 are exactly 1.00000 and 34 are exactly 0. Two values sit outside those two points: Saudi Arabia at 0.64567 and Paraguay at 2.00000. The arithmetic mean is 0.84117, while the median is 1.00000. That difference is a useful warning: the mean is pulled down by the large block of reported zeros and does not describe the most common observation.
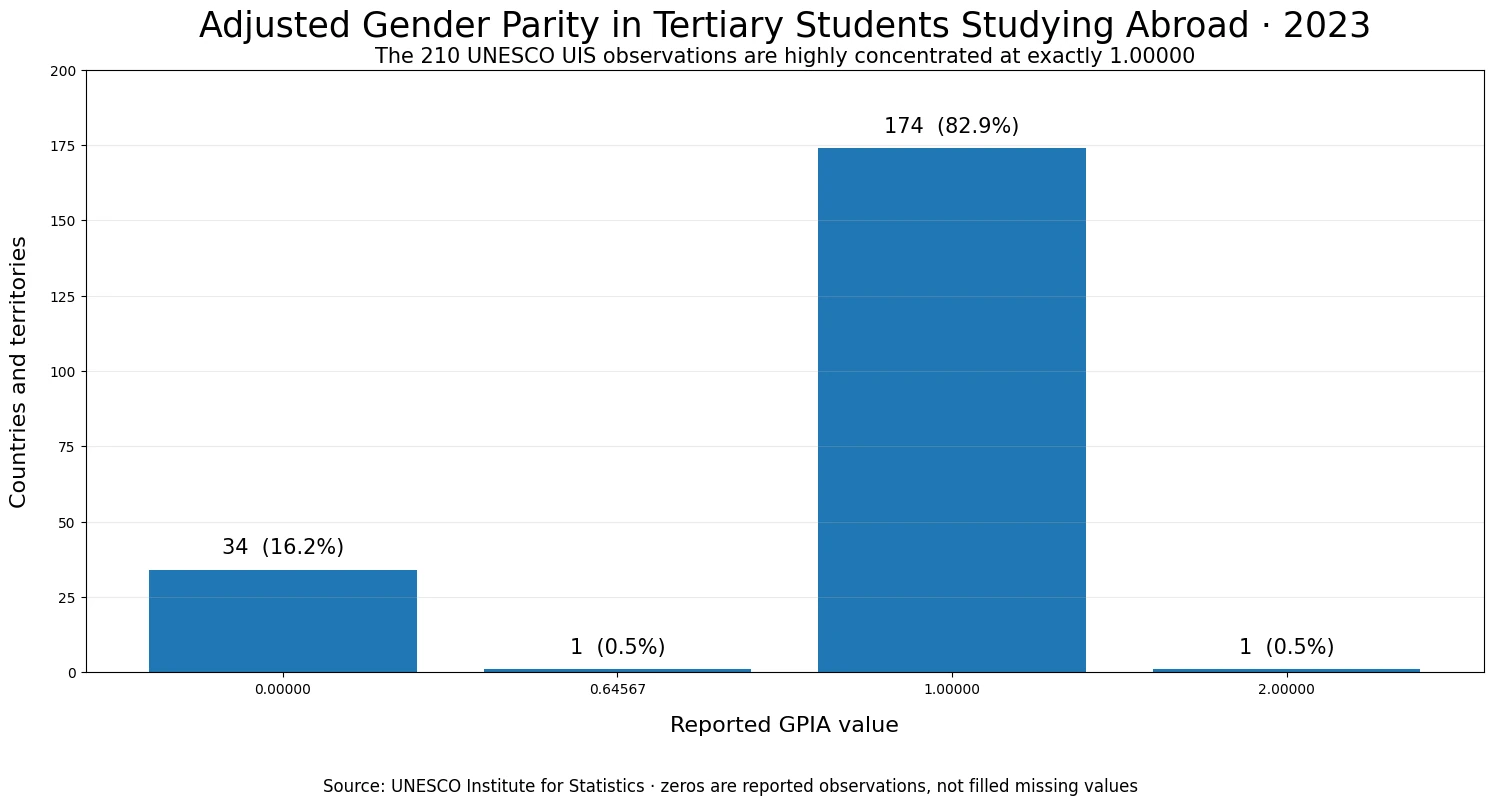
Table of Contents
The series compares female and male student counts, not mobility rates
It is easy to confuse this indicator with the GPIA of an outbound mobility ratio because both belong to the same family of international-student statistics. The distinction is fundamental. A mobility ratio relates students abroad to the size of tertiary enrolment in the origin country. This series instead takes the female and male values for the number of outbound internationally mobile tertiary students and summarizes their relationship on the adjusted parity scale. A country can therefore have the same parity index as another country while sending a very different number of students abroad.
That difference also means the indicator should not be used to infer the likelihood that an individual student studies overseas. Nor does it tell us whether an origin country has a large tertiary system, whether study abroad is common relative to domestic enrolment, or which destinations are preferred. It is a composition measure. The useful question is whether the female and male values are aligned, not whether the country has high or low student mobility overall.
Most of the 210 observations sit at exactly 1.00000
| Reported value | Countries and territories | Share of 210 observations |
|---|---|---|
| 0.00000 | 34 | 16.2% |
| 0.64567 | 1 | 0.5% |
| 1.00000 | 174 | 82.9% |
| 2.00000 | 1 | 0.5% |
Using the conventional 0.97–1.03 band around parity, 174 observations fall inside the band, 35 are below 0.97, and one is above 1.03. Every observation inside the band is exactly 1.00000 in the available 2023 series. That should not be rephrased as a claim that 82.9% of countries have achieved gender equality in higher education. The index refers to one specific statistical relationship among outbound tertiary students, not to access, completion, learning, employment, or gender equality in society more broadly.
The concentration at exactly 1 also argues against inventing precision that the source does not provide. With no underlying female and male counts in this dataset, there is no evidence that a reported 1.00000 conceals a small difference such as 0.99 or 1.01. The defensible approach is to preserve the published value and, if a finer explanation is needed, obtain the sex-disaggregated observations that produced the index.
How to interpret 0, 1 and 2 on the adjusted parity scale
UIS uses an adjusted parity index so that disparities on either side of 1 can be represented on a symmetric 0-to-2 scale. When the female indicator value is less than or equal to the male value, the female-to-male ratio is used. When the female value is higher, the transformation reverses the ratio and maps the result above 1. The UIS definition of adjusted parity indices explains that 1 marks parity and that larger distances from 1 represent larger disparities between the two groups.
The endpoints in this series therefore deserve careful wording. A reported 0 or 2 is an extreme value on the adjusted scale. Mathematically, such endpoints can be associated with an underlying value of zero on one side of the comparison. But this dataset contains the index, not the female and male student counts used to calculate it. It would be an unsupported step to say that a particular country had literally no female or no male students abroad without checking those underlying observations.
Why the mean of 0.84117 can be misleading on its own
A mean is sensitive to the shape of a distribution. Here, 34 zeros exert a large downward influence, even though 174 of 210 observations are at 1. The median, which is the middle value after sorting, is 1.00000 and therefore better reflects where most observations are located. The chart makes the same point visually: this is not a smooth range of country values but a distribution dominated by two exact points, especially parity.
Saudi Arabia at 0.64567 is the only observation between 0 and 1, while Paraguay at 2.00000 is the only observation above 1. These are notable because they break the otherwise discrete pattern, not because the index by itself tells us why. Explaining either case would require the sex-specific student counts, their reporting status, and potentially additional information on the coverage of internationally mobile students.
Reported zeros must remain separate from missing geographies
The 210 included rows contain no missing values, and the source records 34 observations as zero. Those zeros are data points and should stay zero. At the same time, some geographic units in the broader catalogue are not reported for this indicator. An unreported geography is not equivalent to a reported zero. Any map or aggregation that replaces absent geographies with zero would change the meaning of the dataset.
For that reason, a frequency chart is more informative than forcing a choropleth map for this particular series. A world map would color 174 places with the same parity value and 34 with the same zero, while the absence of some catalogue units would require a separate no-data treatment. The bar chart states the actual structure directly and avoids implying a continuous geographic gradient that is not present in the observations.
What the indicator can support—and what it cannot
The GPIA can support a precise statement about the reported relationship between female and male numbers of tertiary students studying abroad in 2023. It can identify observations at parity, below parity, above parity, and at the endpoints of the adjusted scale. It cannot tell us the absolute number of students, the share of a country’s tertiary population abroad, the destinations chosen, fields of study, degree levels, scholarship status, or the causes behind the gender composition.
This limitation matters when comparing countries. Two origins can both have a GPIA of 1 while one sends tens of thousands of students abroad and the other sends only a small number. Likewise, a value far from 1 does not by itself reveal whether the difference is driven by a large female value, a small male value, a small denominator, reporting practices, or another feature of the underlying counts. Those questions require the component data rather than the index alone.
Source and comparison rules
The reference year is 2023 and the source is the UNESCO Institute for Statistics indicator OE.5T8.40510.GPIA. The analysis uses the 210 reported country and territory observations as published, with no zero-filling for absent geographies and no reconstruction of hidden decimals. For comparisons over time or with related student-mobility measures, the indicator code and definition should be held constant. A GPIA for a mobility ratio, a destination region, or another education measure is not interchangeable with this student-count parity index.
Frequently Asked Questions
What does a GPIA value of 1 mean in this series?
A value of 1 marks parity between the female and male values for the number of tertiary students studying abroad from the same origin country.
Are the 34 zero values missing data?
No. They are reported zero observations in the 210-row series. Geographic units without an observation must remain separate from reported zeros.
Is this the same as the outbound mobility ratio gender parity index?
No. This series compares female and male student counts. An outbound mobility ratio first relates students abroad to tertiary enrolment in the origin country, so the denominator and interpretation differ.
Related Articles
- How Different Is the Public Pre-Primary Enrolment Share by Gender? (2024)
- How Different Is the Private-School Share of Secondary Enrolment by Gender? (2024)
- How Widely Does Multidimensional Poverty Vary Across Countries?
Green Map creates custom-edited map images using open geographic data sources such as geoBoundaries, Natural Earth, OpenStreetMap, and government open data. These maps are edited visual materials, not raw data files, and are provided for education, documents, presentations, and graphic reference.