Estimated small-scale solar photovoltaic generation in the U.S. commercial sector was highly concentrated by state in 2025. California recorded 7,523.804 thousand MWh, or about 7.524 TWh, the largest value among the 50 states and the District of Columbia. New York followed with 2,845.578 thousand MWh, while Massachusetts produced 2,281.621 thousand MWh. Together, those three jurisdictions accounted for 51.0% of the 51-jurisdiction total.
The scope of the series matters. These observations represent estimated small-scale solar PV net generation for the commercial sector, reported in thousand megawatthours. One thousand MWh equals one GWh, so the national state-level sum of 24,794.627 thousand MWh is about 24.795 TWh. This is not the same as total solar generation and should not be treated as utility-scale solar output. Small-scale PV is a separate EIA statistical category intended to capture distributed installations that are not represented in the same way as large utility power plants.
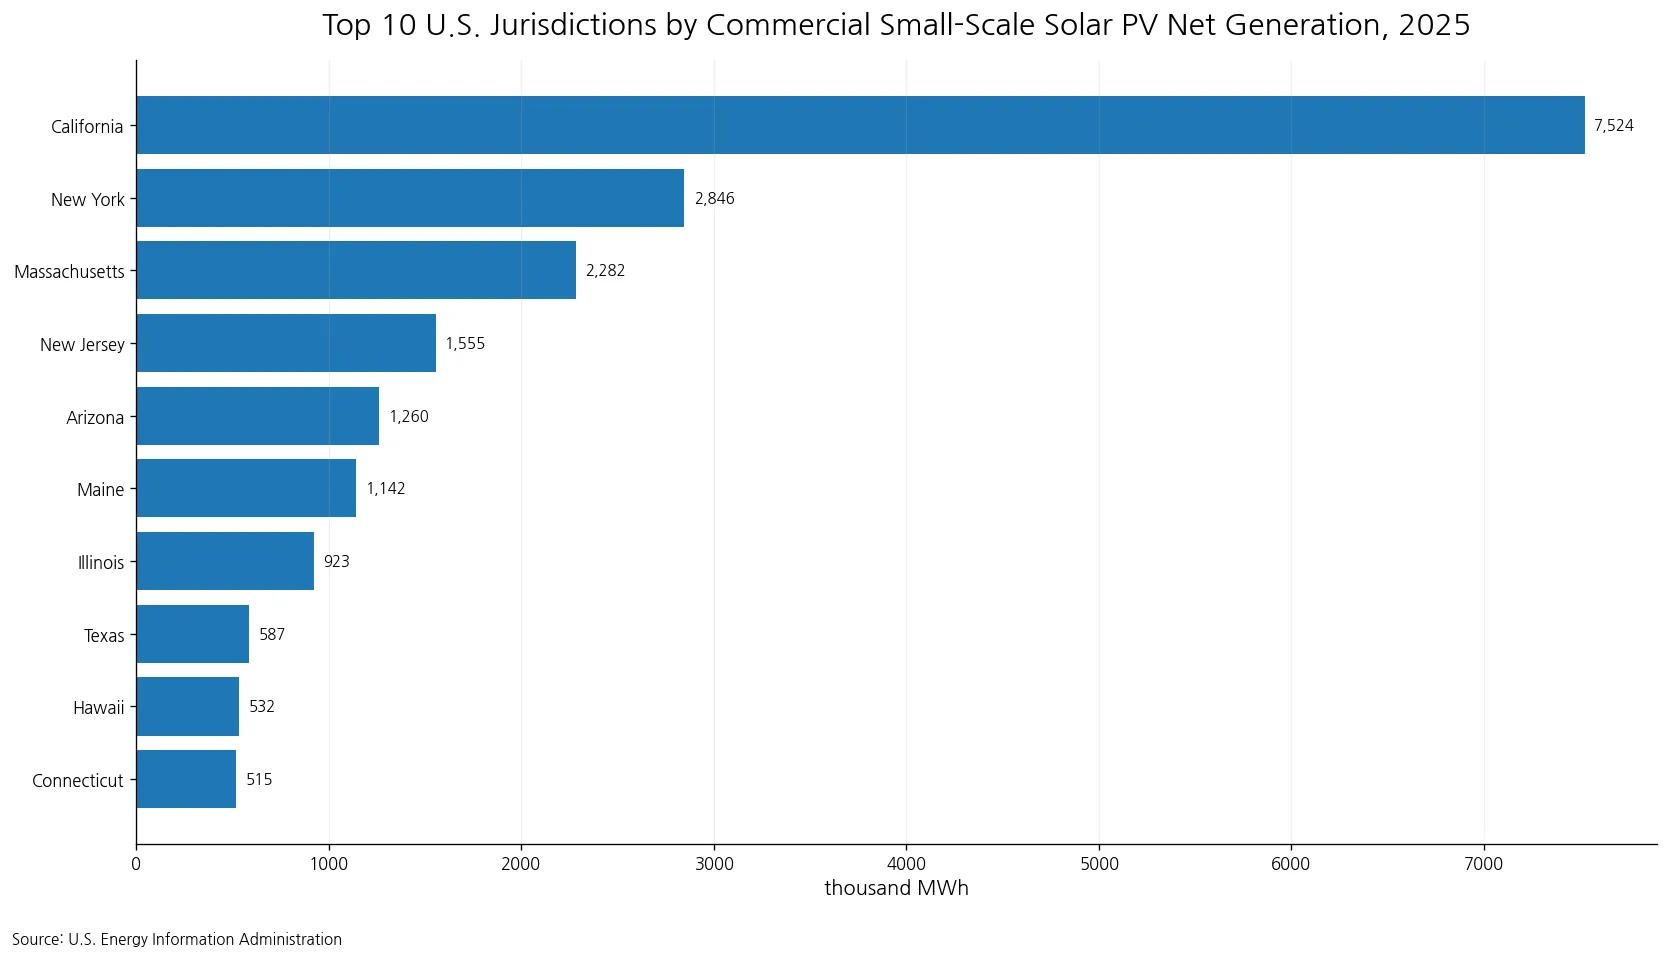
Table of Contents
California alone accounted for 30.3% of the 2025 total
The 51-jurisdiction total was 24,794.627 thousand MWh. California represented 30.3% of that amount. New York contributed 11.5%, and Massachusetts contributed 9.2%. The gap between California and New York was 4,678.227 thousand MWh, which was larger than New York’s entire annual value. California was therefore not merely first; it stood well apart from the rest of the distribution.
Concentration remains visible when the ranking is widened. The top five jurisdictions supplied 62.4% of the total, and the top ten supplied 77.3%. By contrast, the bottom ten together represented only 0.5%. More than three quarters of estimated commercial small-scale solar PV generation was associated with just ten of the 51 jurisdictions in this 2025 comparison.
The top ten include several different regional patterns
The ten highest values were California, New York, Massachusetts, New Jersey, Arizona, Maine, Illinois, Texas, Hawaii, and Connecticut. The list includes sunny western and southwestern states, but it also contains a large group of northeastern states and jurisdictions. Illinois and Texas add further geographic variety. The pattern cannot therefore be reduced to a simple assumption that the states with the strongest sunlight automatically have the highest commercial small-scale PV generation.
| Rank | Jurisdiction | 2025 generation (thousand MWh) | Share of total |
|---|---|---|---|
| 1 | California | 7,523.804 | 30.3% |
| 2 | New York | 2,845.578 | 11.5% |
| 3 | Massachusetts | 2,281.621 | 9.2% |
| 4 | New Jersey | 1,554.857 | 6.3% |
| 5 | Arizona | 1,259.790 | 5.1% |
| 6 | Maine | 1,141.564 | 4.6% |
| 7 | Illinois | 923.003 | 3.7% |
| 8 | Texas | 586.882 | 2.4% |
| 9 | Hawaii | 531.783 | 2.1% |
| 10 | Connecticut | 515.217 | 2.1% |
Maine, in sixth place, recorded 1,141.564 thousand MWh and was the last jurisdiction above one million MWh when the source unit is converted. Illinois followed at 923.003 thousand MWh. Texas, Hawaii, and Connecticut were grouped between roughly 515 and 587 thousand MWh. The difference between tenth-place Connecticut and eleventh-place Colorado was only 60.158 thousand MWh, showing that the top-ten cutoff is a convenient reporting boundary rather than a sharp break in the middle of the distribution.
The median was far below the mean
The mean across the 51 jurisdictions was 486.169 thousand MWh, while the median was only 161.905 thousand MWh. The mean was about 3.0 times the median because several very large values, especially California, pulled the average upward. New Mexico sat at the median with 161.905 thousand MWh. Half of the jurisdictions were above that value and half were below it.
The first quartile was approximately 47.839 thousand MWh and the third quartile was approximately 399.088 thousand MWh. In other words, the middle half of the jurisdictions fell within a broad band of roughly 48 to 399 thousand MWh. California’s value was about 18.9 times the third-quartile threshold. In a distribution this skewed, the median and concentration shares are more informative than a national average alone when describing a typical state-level scale.
At the bottom, annual values fell to single-digit thousands of MWh
North Dakota had the smallest value at 1.559 thousand MWh. South Dakota recorded 3.069, Wyoming 4.018, and Alaska 5.550 thousand MWh. Mississippi was also below 20 thousand MWh at 10.907. The distance between these values and the multi-terawatt-hour scale seen in California illustrates how wide the state distribution was.
| Jurisdiction | 2025 generation (thousand MWh) |
|---|---|
| North Dakota | 1.559 |
| South Dakota | 3.069 |
| Wyoming | 4.018 |
| Alaska | 5.550 |
| Mississippi | 10.907 |
| Nebraska | 14.048 |
| Alabama | 18.243 |
| West Virginia | 18.560 |
A low value in this table does not mean that a state has little solar power overall. The metric covers only estimated small-scale PV generation attributed to the commercial sector. Residential small-scale systems, industrial installations, and utility-scale solar plants belong to different statistical categories. A state can have substantial solar activity in one of those categories while appearing relatively low in this commercial small-scale series.
Commercial small-scale PV is not the same market as utility-scale solar
Small-scale solar is generally associated with distributed installations such as systems on buildings or customer sites, while utility-scale solar consists of larger generating facilities whose output is tracked through a different reporting structure. The ownership model, interconnection, financing, load served, and operating purpose can differ significantly between these categories. For that reason, a ranking of commercial small-scale PV should not be presented as a ranking of total state solar power.
California’s 30.3% share is a good example of why the denominator must stay visible. The correct interpretation is that California represented 30.3% of the summed 2025 state-level estimate for commercial small-scale solar PV net generation in this series. It does not mean California generated 30.3% of all U.S. solar electricity. Total solar would require combining or separately evaluating additional EIA categories with compatible definitions.
What the data can establish directly
The 2025 observations support several firm descriptive conclusions. California ranked first at 7,523.804 thousand MWh. The top three accounted for 51.0% of the total, the top ten accounted for 77.3%, and the bottom ten together accounted for just 0.5%. The median was 161.905 thousand MWh, far below the mean of 486.169. These statements are direct rankings or arithmetic summaries of one consistent state-level series.
The table alone does not establish why the values differ. State incentives, commercial electricity prices, building stock, solar resources, installation costs, net-metering rules, tax provisions, and the structure of the local electricity market could all matter, but none of those explanations is tested by this single variable. Establishing cause would require matching the generation series with additional data for the same year, geography, and sector.
A one-year snapshot does not show growth
Every observation in this comparison is for 2025. Without the same series for earlier years, year-over-year growth and long-term trends cannot be calculated. California’s leading position in 2025 does not by itself show that California has been the fastest-growing market, and a low 2025 value does not show that a state is declining. Those are time-series questions rather than cross-sectional ones.
The 2025 distribution can still serve as a useful baseline. When matching annual observations become available, the same measures can be recalculated: California’s share, the combined share of the top ten, the median state, and changes in rank. That would show whether commercial small-scale PV generation is becoming more geographically dispersed or remains concentrated in a relatively small group of states.
How to compare this series with other EIA solar measures
The safest comparison begins with the sector, technology, and unit. This series uses estimated small-scale solar photovoltaic generation and the All Commercial sector, expressed as thousand MWh. Other EIA datasets may report electric utility solar, independent power producer solar, total utility-scale solar, residential small-scale solar, installed capacity, or generation from all renewable sources. Those measures answer different questions even when the titles contain many of the same words.
A state can therefore rank high in commercial distributed PV but lower in utility-scale generation, or the reverse. Capacity and generation are also different: capacity measures the potential size of installed equipment, while generation measures electricity actually produced over a period. Keeping those distinctions clear prevents a state ranking from being interpreted as a broader solar-market ranking than the data support.
Conclusion: commercial small-scale solar generation was strongly concentrated in 2025
The 2025 sum across the 50 states and the District of Columbia was 24,794.627 thousand MWh, approximately 24.795 TWh. California contributed 30.3%, while New York and Massachusetts brought the top-three share to 51.0%. The top ten accounted for 77.3%. The large gap between the mean of 486.169 thousand MWh and the median of 161.905 thousand MWh reinforces the same point: the distribution was highly skewed toward a limited number of jurisdictions.
The main limitation is equally important. These figures describe estimated commercial small-scale solar PV net generation, not total solar output and not utility-scale generation. The data are well suited to comparing the 2025 state distribution, but explaining the causes of the differences or measuring growth requires additional variables and multiple years of the same EIA series.
Frequently Asked Questions
Which state had the most commercial small-scale solar PV net generation in 2025?
California had the highest value at 7,523.804 thousand MWh, accounting for 30.3% of the 51-jurisdiction total.
Does this measure all solar generation in each state?
No. It measures estimated small-scale solar PV net generation for the commercial sector. Residential small-scale and utility-scale solar are separate categories.
How concentrated was commercial small-scale solar generation in 2025?
The top three jurisdictions accounted for 51.0% of the total and the top ten accounted for 77.3%.
Related Articles
Green Map creates custom-edited map images using open geographic data sources such as geoBoundaries, Natural Earth, OpenStreetMap, and government open data. These maps are edited visual materials, not raw data files, and are provided for education, documents, presentations, and graphic reference.