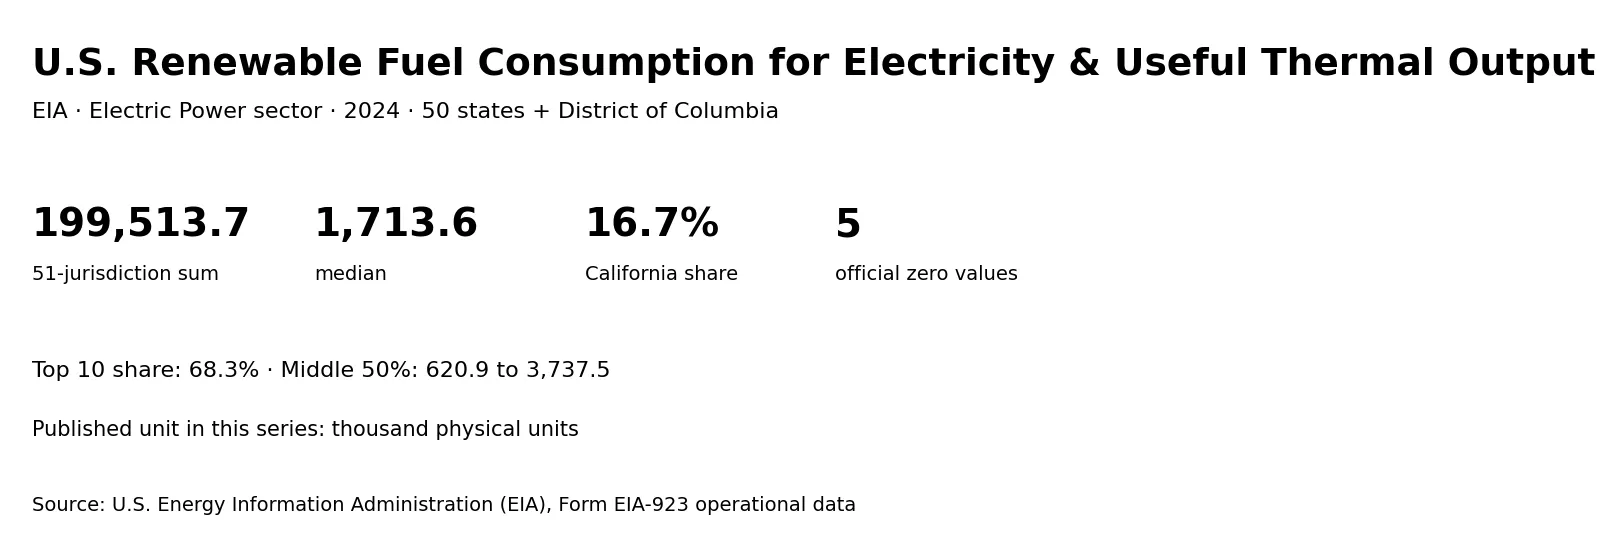
U.S. Energy Information Administration (EIA) operational data show a highly uneven state distribution for 2024 renewable-fuel consumption used for electricity generation and useful thermal output in the Electric Power sector. The dataset covers 51 jurisdictions—the 50 states and the District of Columbia—and the published series unit is thousand physical units. The 51-jurisdiction sum is 199,513.662, the median is 1,713.557, and the mean is 3,912.033.
The unit needs to remain exactly as published for this series. It should not be relabeled as Btu, megawatthours, barrels, short tons, or another physical unit. EIA also publishes heat-content and generation measures separately, and those answer different questions. The analysis here therefore focuses on the relative size and concentration of state values within this fixed EIA series rather than converting the observations into a different energy measure.
Table of Contents
California leads and the top 10 account for 68.3% of the total
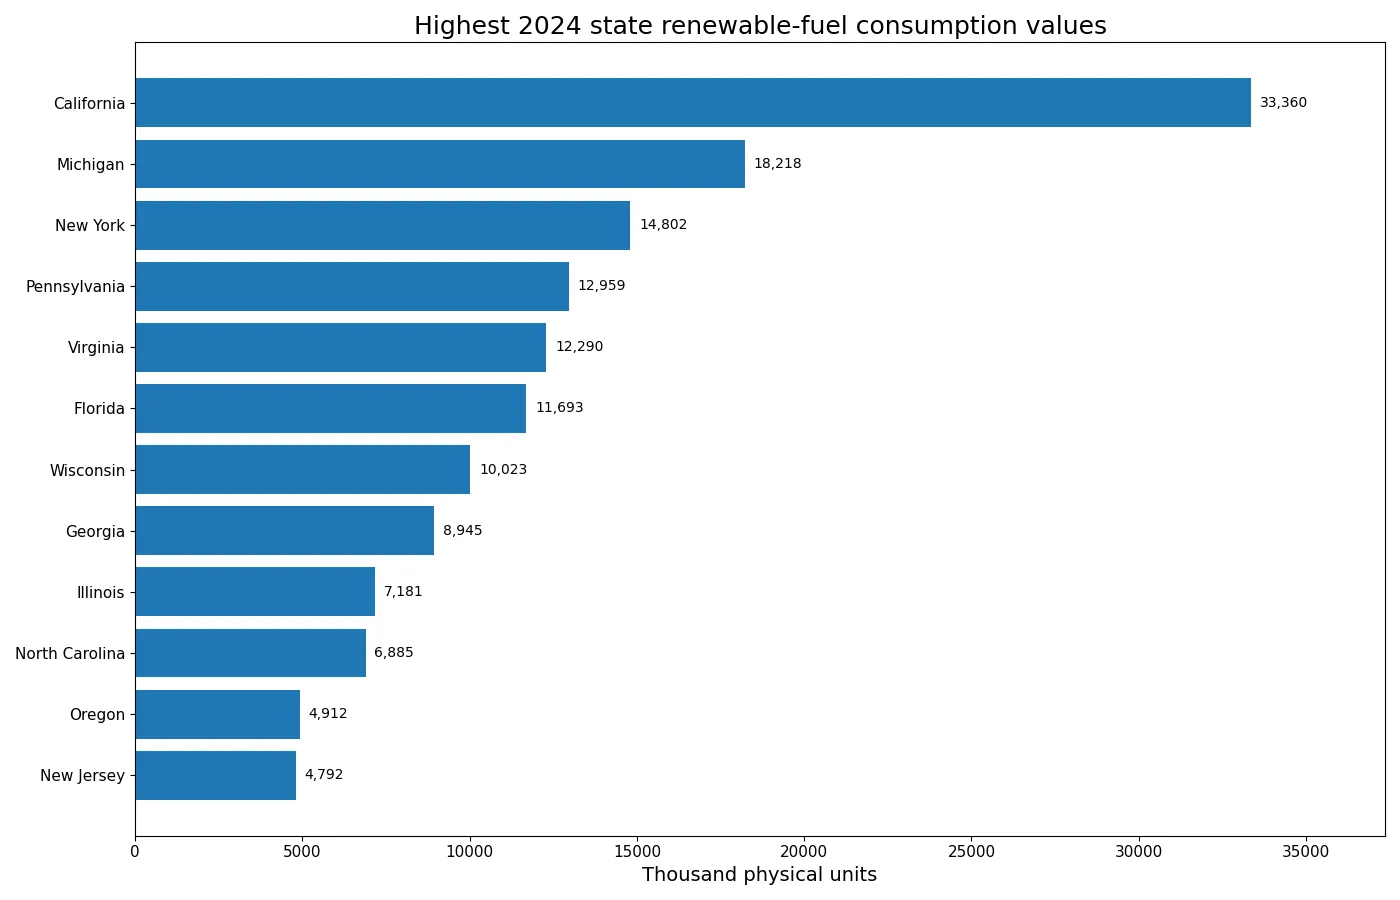
California has the largest 2024 value at 33,360.389. Michigan follows at 18,218.463, New York at 14,801.639, Pennsylvania at 12,958.905, and Virginia at 12,289.719. California alone represents about 16.7% of the 51-jurisdiction sum. The top three account for 33.3%, the top five for 45.9%, and the top ten for 68.3%.
| State or jurisdiction | 2024 value |
|---|---|
| California | 33,360.389 |
| Michigan | 18,218.463 |
| New York | 14,801.639 |
| Pennsylvania | 12,958.905 |
| Virginia | 12,289.719 |
| Florida | 11,692.924 |
| Wisconsin | 10,023.455 |
| Georgia | 8,945.332 |
| Illinois | 7,180.656 |
| North Carolina | 6,885.259 |
The gap between California and Michigan is 15,141.926, almost as large as Michigan’s entire value. Concentration is therefore visible even inside the leading group. California exceeds 33,000, while the tenth-ranked North Carolina is about 6,885. The top ten are important collectively, but the first state is unusually large even compared with other high-value states.
This ranking is not a ranking of renewable electricity generation. Fuel consumption in physical units and net generation are separate EIA measures. A state can rank differently across fuel use, heat content, useful thermal output, installed renewable capacity, or electricity generated. The safest reading is simply that these are the state values for the specified renewable total-consumption series.
The median is only 1,713.557
The median is 1,713.557. The first quartile is 620.944 and the third quartile is 3,737.505, so half of the observations lie between roughly 621 and 3,738. The maximum, 33,360.389, is about 19.5 times the median. The mean of 3,912.033 is also far above the median because the largest states pull the arithmetic average upward.
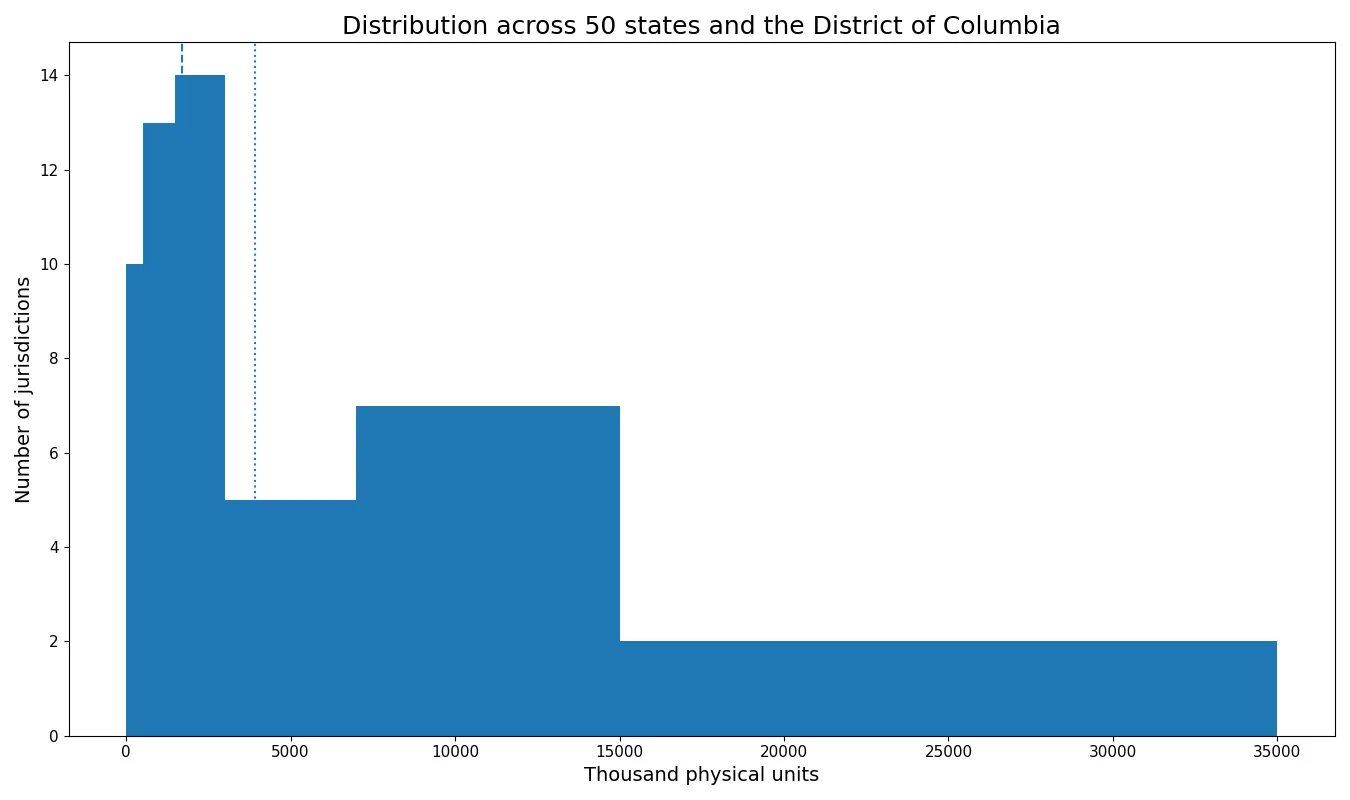
By value band, 10 jurisdictions are below 500, 13 are from 500 to under 1,500, 14 are from 1,500 to under 3,000, 5 are from 3,000 to under 7,000, and 9 are at 7,000 or above. The distribution is therefore strongly right-skewed rather than evenly spread across states.
The state differences cannot be assigned to one cause from this dataset alone. Renewable fuel mixes, generation technologies, combined-heat-and-power activity, plant operations, and the structure of each state’s Electric Power sector can all differ. The table establishes the size of the differences but does not identify a single causal explanation for them.
Five jurisdictions have official zero values
There are 5 official zero values: Alaska, District of Columbia, North Dakota, South Dakota, and Wyoming. The next-lowest positive observations are West Virginia at 88.507, Louisiana at 104.983, Hawaii at 133.183, Mississippi at 143.726, and Montana at 410.912.
| State or jurisdiction | 2024 value |
|---|---|
| Alaska | 0.000 |
| District of Columbia | 0.000 |
| North Dakota | 0.000 |
| South Dakota | 0.000 |
| Wyoming | 0.000 |
| West Virginia | 88.507 |
| Louisiana | 104.983 |
| Hawaii | 133.183 |
| Mississippi | 143.726 |
| Montana | 410.912 |
A reported zero is not the same as missing data. All 51 rows contain numeric values, and the five zeros are part of the official series. They should not be removed or reclassified as no data. Conversely, if a jurisdiction were absent from another dataset, that absence should not be filled with zero unless the source explicitly reports a zero observation.
A zero in this metric also does not mean that the jurisdiction has no renewable energy activity at all. The series is limited to a particular EIA sector, fuel grouping, field, and reference year. Renewable generation, consumption in other sectors, or other renewable measures can still be nonzero.
Cumulative shares show strong concentration
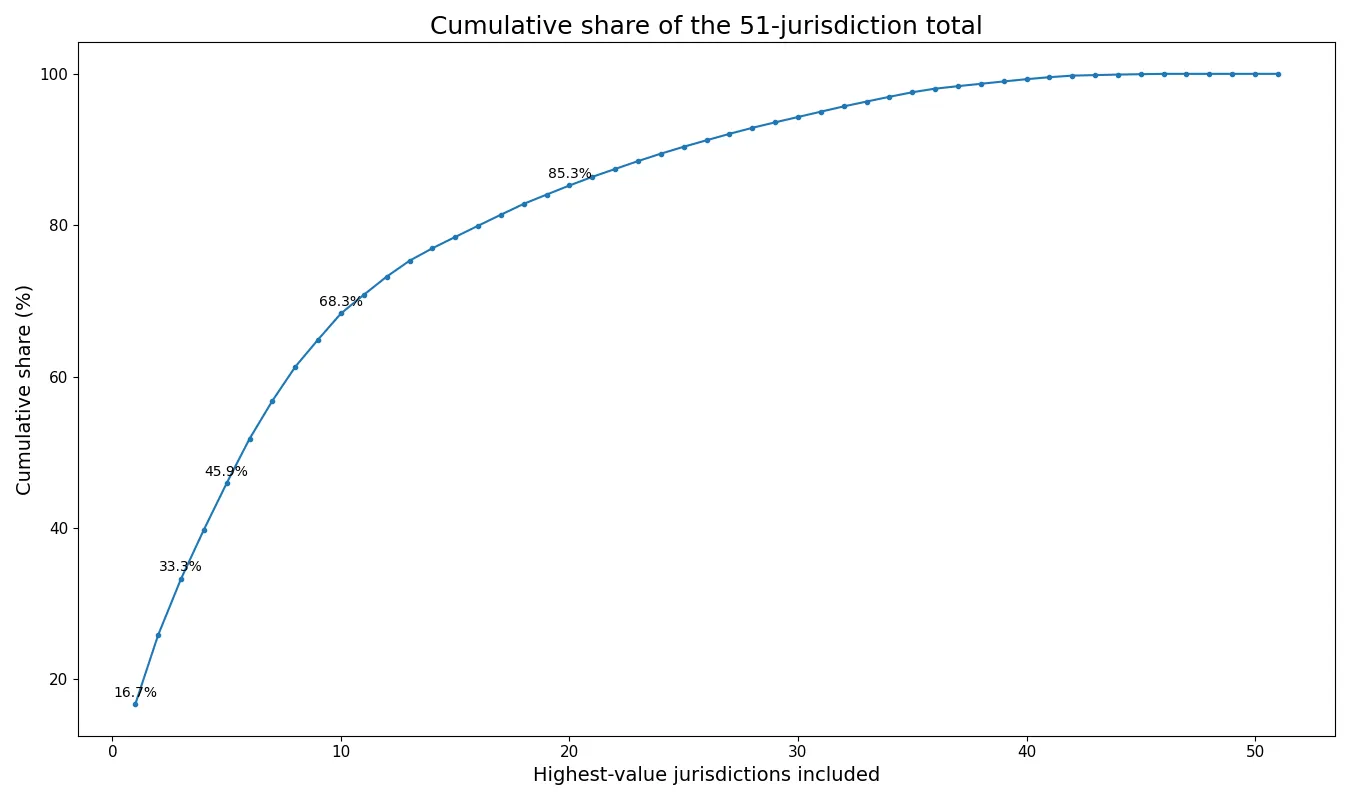
California accounts for 16.7% of the total, the top three for 33.3%, the top five for 45.9%, and the top ten for 68.3%. The cumulative curve rises quickly at the beginning, which indicates that the aggregate is not distributed evenly across the 51 jurisdictions. Ten states alone account for more than two-thirds of the total.
This concentration calculation is purely descriptive. It is not a market-concentration measure and does not indicate market power, utility ownership, or policy influence. It simply divides the state values by their 51-jurisdiction sum and reports how much of that total is contained in the largest observations.
Texas is outside the top ten in this series
Texas records 3,288.597, placing it 14th among the 51 jurisdictions. That may look different from familiar renewable-capacity or electricity-generation rankings. The contrast illustrates why metrics should not be substituted for one another: a state that ranks highly in wind or solar generation does not automatically occupy the same position in a renewable-fuel physical-unit consumption series.
Fuel consumption and electricity generation measure different stages of the energy process. Consumption records fuel input under the specified EIA definition, while net generation measures electricity output. Useful thermal output can also matter for combined heat and power. Differences in technology and fuel mix can therefore produce different state orderings across EIA series.
The published physical-unit label should not be converted casually
EIA electricity operational data include physical-unit fuel consumption and separate heat-content or generation measures. For this renewable aggregate, the source metadata identify the unit as thousand physical units. Because that is the unit attached to the series, the state comparison keeps it unchanged. Borrowing the unit from a coal, natural-gas, or petroleum series would create an inconsistent measure.
Physical units are also not the same as energy-equivalent units. If the analytical goal is to compare heat content across fuels, a Btu-based series is more appropriate. If the goal is electricity output, net generation should be used. The current series is most useful for comparing the state distribution of the exact EIA renewable consumption measure.
One year cannot establish a trend
The values are a 2024 cross-section. They do not show whether renewable-fuel consumption is increasing or decreasing in any state. A trend analysis would require the same total-consumption field, renewable fuel grouping, Electric Power sector, geography, and unit across multiple years.
Consistency matters because EIA has many adjacent series. Changing the fuel group, sector, field, or unit can produce a different metric even when the title looks similar. Year-over-year analysis should therefore use the exact same series definition before calculating growth rates or long-run changes.
Source and main 2024 pattern
The figures come from U.S. Energy Information Administration electricity data. EIA describes its electric power operational data as monthly and annual operations by state, sector, and energy source, sourced from Form EIA-923. The EIA Open Data documentation explains the API structure and its data and facet parameters.
The main 2024 pattern is concentration. California represents 16.7% of the total and the top ten account for 68.3%. At the same time, the median is only 1,713.557 compared with a mean of 3,912.033, and five jurisdictions report zero. The distribution is best described as a small group of very large observations alongside many medium and small state values.
Frequently Asked Questions
What is the unit of this EIA series?
The published unit is thousand physical units. The values are not relabeled as Btu, megawatthours, barrels, or another unit.
Does California ranking first mean it also generates the most renewable electricity?
No. This series measures renewable-fuel consumption in physical units, while net generation is a separate EIA metric.
Are the five zero values missing data?
No. They are official reported zeros in the 2024 series and should remain distinct from missing observations.
Why is the mean much higher than the median?
A small number of very large state values raise the average. The mean is 3,912.033, while the median is 1,713.557.
Related Articles
Green Map creates custom-edited map images using open geographic data sources such as geoBoundaries, Natural Earth, OpenStreetMap, and government open data. These maps are edited visual materials, not raw data files, and are provided for education, documents, presentations, and graphic reference.